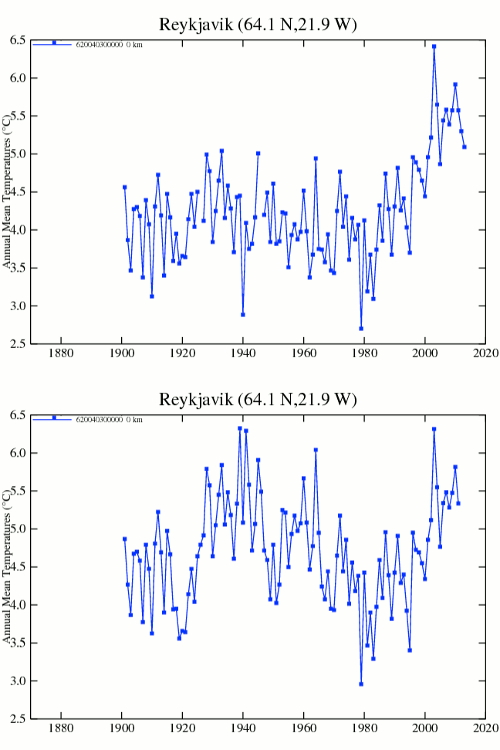
Adjusted : Data.GISS: GISS Surface Temperature Analysis
Measured : Data.GISS: GISS Surface Temperature Analysis
Disrupting the Borg is expensive and time consuming!
Google Search
-
Recent Posts
- Analyzing The Western Water Crisis
- Gaslighting 1924
- “Why Do You Resist?”
- Climate Attribution Model
- Fact Checking NASA
- Fact Checking Grok
- Fact Checking The New York Times
- New Visitech Features
- Ice-Free Arctic By 2014
- Debt-Free US Treasury Forecast
- Analyzing Big City Crime (Part 2)
- Analyzing Big City Crime
- UK Migration Caused By Global Warming
- Climate Attribution In Greece
- “Brown: ’50 days to save world'”
- The Catastrophic Influence of Bovine Methane Emissions on Extraterrestrial Climate Patterns
- Posting On X
- Seventeen Years Of Fun
- The Importance Of Good Tools
- Temperature Shifts At Blue Hill, MA
- CO2²
- Time Of Observation Bias
- Climate Scamming For Profit
- Climate Scamming For Profit
- Back To The Future
Recent Comments
- Bob G on Analyzing The Western Water Crisis
- Bob G on Analyzing The Western Water Crisis
- Bob G on Analyzing The Western Water Crisis
- arn on Analyzing The Western Water Crisis
- Scott Allen on Analyzing The Western Water Crisis
- conrad ziefle on Analyzing The Western Water Crisis
- conrad ziefle on Analyzing The Western Water Crisis
- Bob G on Analyzing The Western Water Crisis
- Bob G on Analyzing The Western Water Crisis
- Bob G on Gaslighting 1924


Reblogged this on BLOGGING BAD w/Gunny G ~ "CLINGERS of AMERICA!".
Sorry bit dumb on this – what does it mean?
It’s another example of the ‘Team’ trying to erase the ‘blip’…the much warmer temperatures, globally, in the mid-1930s-early 1940s, making the post 2000 temps the ‘hottest ever’.
> Iceland Met Office say that “The GHCN “corrections” are grossly in error in the case of Reykjavik”
http://notalotofpeopleknowthat.wordpress.com/2012/01/25/how-giss-has-totally-corrupted-reykjaviks-temperatures/
> The Iceland Met Office tell us “The 20th century warm period that started in the 1920s ended very abruptly in 1965. It can be divided into three sub-periods, a very warm one to 1942, a colder interval during 1943 to 1952, but it was decisively warm during 1953 to 1964.The cold period 1965 to 1995 also included a few sub-periods. The so called “sea ice years” 1965 to 1971, a slightly warmer period 1972 till 1978 and a very cold interval from 1979 to 1986”.
http://notalotofpeopleknowthat.wordpress.com/2012/01/28/icelands-sea-ice-years-disappear-in-ghcn-adjustments/
> “The changes in Reykjavik, Iceland were particularly heinous – because they were specifically objected to by the Icelandic Met Office. Meteorologist Mark Johnson contacted the senior expert at the Icelandic Met Office and asked him about NASA data tampering in iceland. Here is their exchange :
1) Are you happy with the adjustments as they stand right now?
No, I am not happy with the adjustments as they stand, but I might no be quite up to date. I don’t know if they have been making additional changes during the last 2-3 weeks.
2) Have you or any of your staff contacted or been contacted by anyone from NASA Goddard Space Institute officials?
No, but we made some contact with them about 5-6 weeks ago. Best wishes,
Trausti Jónsson senior meteorologist Icelandic Meteorological Office”
http://stevengoddard.wordpress.com/spectacularly-poor-climate-science-at-nasa/
Darn those blips 😉
Also, mosquito season is now over in the N.W. corner of Greenland.
http://www.wunderground.com/global/stations/04201.html
Thanks Guys!
Reblogged this on Standard Climate.
I have several times tried to get the Mosher’s of the world to explain just this one station, as their “superior” knowledge is beyond my comprehension to understand their entire homogenization process. I have simply said, “hey, help me understand why this one station is like this.” No answers ever from a of the defenders of the surface record. They runaway from the question.
Curiously these inexplicable graphs from one station, perfectly mimic the overall changes.
Hey, my local station ‘moved’ 7 times, with adjustments for each move…but it is primarily a river gauge, in a purpose built building, anchored to the bedrock of the river. The only answer I could ever get from that crowd was…well, something changed, so the adjustments are justified.
Their half-assed ‘appeasement’/reconciliation crap is just as bad, if not worse, than the ‘sanctioned’ messing with the record done by ‘official’ means.