Jennifer Francis of Rutgers is the key figure behind the global warming makes it cold idiocy.
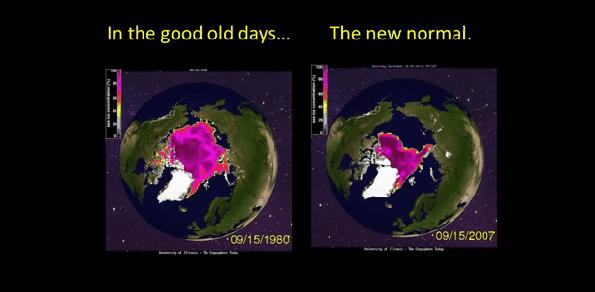
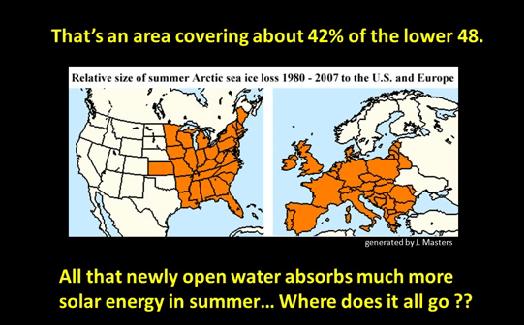
Here are couple of her main slides
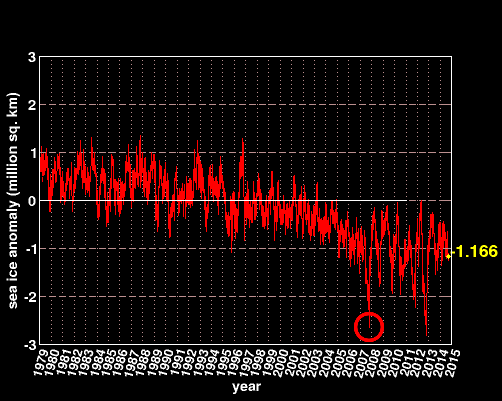
She says that September 2007 was “the new normal” – when in fact it was an extreme outlier. The red circle below marks her “new normal”
Her thesis has already collapsed. But it gets worse. She claims that open water in September is absorbing sunlight. Apparently no one told her that the sun sets at the North Pole in mid-September, and it receives almost no sunlight that time of year. In fact it is the exact opposite. Open water in September is able to radiate heat out into space – which ice covered water can’t do.
Because of this, late summer ice loss is a negative feedback, not a positive one. These experts talk very confidently about topics which they fail to understand the most basic facts of.
Garbage in, garbage out.


Junk Science has only been identified in climatology, but it extends across the spectrum of government-funded science. Why?
The US House of Representatives turned over responsibility to the US NAS to review annual budgets of the national research agencies, like NASA, NSF, DOE, EPA, etc.
The sad fact is that tax dollars go to “scientists” to discover “evidence” for whatever politicians tell the US NAS they want “scientific evidence.”
The Standard Models of heavy nuclei and stars are two clear examples of government-funded deception:
https://dl.dropboxusercontent.com/u/10640850/WHY.pdf
How come you never hear the alarmbeciles talk about the albedo of Antarctic sea ice? How all that southern sunlight around 60 or 70 degrees S latitude is reflected off the ice? All they talk about is the scorching sunlight around 80 or 90 N latitude.
There’s a lot of ice between 55 and 60°S at the moment!
The open water releases heat even after the Sun is below the horizon, resulting is less temp differential, thus meandering jet stream = so called polar vortex.
Nonsense. By mid-October ice has covered the entire Arctic Basin
Why does their data stop in 2008….we know there has been a recovery since 2008
http://arctic.atmos.uiuc.edu/SEAICE/timeseries.1870-2008
Because there has been a recovery since 2008
Yea, like the open water that released the polar vortex in 78 and 84? Or was that just sasquatch that time since there was less open water?
Do you wear a big red noze in your routine?
Dr. Will Happer:
” About this time of year in 1777, just before the Battle of Princeton, there was a similar sequence. On January 2, Cornwallis’s men marched south from New York City through cold rain and muddy roads to try to trap George Washington and his little Continental Army in Trenton . On the night of January 2-3, a polar vortex swept across New Jersey, with snow and a very hard freeze. Aided by the extremely cold weather, Washington was able to evacuate his troops and artillery over newly frozen roads and to avoid Cornwallis’s encirclement. Reaching Princeton on the viciously cold morning of January 3, Washington won another battle against the British and escaped to winter quarters in Morristown. Thank you polar vortex!”
http://www.linda-goodman.com/ubb/Forum26/HTML/002455.html
The thesis has collapsed. Enter Bob’s meandering arguments …
“The open water releases heat even after the Sun is below the horizon…”
It release heat that heads straight to space. Remember the earth “heat engine” moves heat FROM the tropics TO the Arctic and out to space.
So that open water represents part of the system that is moving heat FROM the tropics via the Gulf Stream To the Arctic and thence to space.
Overall, increased heat losses from open ocean in the Arctic (when Arctic sea ice is at a minimum in late August-September) are much greater than increased heat absorbed into that open water. More sea ice loss in the Arctic => More heat loss from the planet and a net cooler planet.
The opposite happens in the Antarctic: More sea ice around Antarctica means more heat reflected from the planet and a net cooler planet.
As a whole, Antarctic sea ice is MUCH, MUCH closer to the equator every day of the year.
At the point of maximum solar radiation at TOA, the ANTARCTIC sea ice is is a wide “ring” slowly varying from 59.2 south (last October under 1370 watts/m^2) to about 64 south latitude (in January under 1410 watts/m^2) to a minimum sea ice extent at 3 Mkm^2 (in March at 70 south latitude back down to 1360 watts/m^2). So, when the TOA solar radiation is at its maximum, ARCTIC sea ice is dark. When the top-of-atmosphere radiation is at its max, Antarctic sea ice is not at its minimum.
At this point with less Ice in the Arctic PLUS more sea ice in the Antarctic the earth is in a net energy loss mode. (The earth is not in energy balance, it never is, it is always trying to reach energy balance. That is why we have weather.)
A paper was published refuting the claims’s of Jennifer Francis’ paper, saying those results were “an artifact of the methodology.” As has been said, if the data is tortured sufficiently, it will confess to anything.
http://judithcurry.com/2013/08/21/arctic-sea-ice-and-weather/
Nice understatement:
“Judah Cohen, a climate forecaster at Atmospheric and Environmental Research in Massachusetts added: “It is not simple to explain how sea ice loss that peaks in August and September impacts the circulation at mid-latitudes [during] December through March.”
http://judithcurry.com/2013/08/21/arctic-sea-ice-and-weather/
If not for the pernicious influence of man we’d never suffer any cold snaps or heat waves.
And there was never a polar vortex until last winter.
The ice is recovering a few months after the “new normal” so when exactly did the “open water” that is not open impact the jet stream?
http://igloo.atmos.uiuc.edu/cgi-bin/test/print.sh?fm=09&fd=01&fy=2007&sm=11&sd=01&sy=2007
By 12/1/07 even more sea ice http://igloo.atmos.uiuc.edu/cgi-bin/test/print.sh?fm=09&fd=01&fy=2007&sm=12&sd=01&sy=2007
RACookPE1978 said in August of this year @
wattsupwiththat(DOT)com/2014/08/14/smoke-from-russian-fires-over-arctic-sea/#comment-1709041
So I did a quick look at Judith Curry on the subject of the Arctic. The first thing I turned up was:
Climate Dialogue: Melting of the Arctic sea ice
Exploring different views on climate change
However these are only the views of Warmists of various stripes. No Deniers allowed.
And so we come to Judith Curry.
Judith Curry, November 15, 2012 at 5:43 pm
http://www.climatedialogue.org/melting-of-the-arctic-sea-ice/#comment-93
Do not forget the ‘A’ in AGW stands for the recent CO2 contribution from mankind. SEE: No Tricks Zone discussion of Murray Salby’s paper that is still waiting for publication. Salby, was using the figures from the IPPC. The graphs are real eye openers BTW. They look at the derivative of the CO2 data.
large net-changes in CO2 emissions [which vary annually from 0% to almost 200%] are uncorrelated with human contributions [4% of annual emissions, with 96% coming from natural sources] SO mankind gets ~50% of the blame based on 4% of the annual emission or ~ 4% of (400 ppm minus 315 ppm) = 3 to 4 ppm change in 56 years at the point where the log curve is going flat…. RIGHT! A wee bit of politics in that statement, HMMMmmmm?
So I did a quick look at some of Curry’s papers:
Here are a couple older papers”
Annual Cycle of Radiation Fluxes over the Arctic Ocean: Sensitivity to Cloud Optical Properties
Judith Curry (June 1991)
curry(DOT)eas.gatech.edu/currydoc/Curry_JC5.pdf
A series of Modeling experiments using four types of clouds. “The modeled total cloud optical depth (weighted by cloud fraction) ranges from a low in winter of 2 to a high in sumer of 8… “Values of modeled surface cloud radiative forcing are positive except for two weeks in midsummer: over the course of the year clouds have a net warming effect on the surface in the Arctic. Total cloud radiative forcing at the top of the Atmosphere is determined to be positive only briefly in early autumn. Surface longwave fluxes are shown to be very sensitive to the presence of lower-tropospheric ice crystal percipitation during the cold half of the year.”
The body of the text shows the actual data on clouds in the Arctic, especially in winter, to be sketchy and conflicting. The paper does what it can with the available data on “cloud fraction and cloud microphysical properties and “coupling [that with] the radiative calculations of a one-dimensional thermodynamic sea-ice model, internally consistant annual cycles of surface temperature, surface albedo, cloud fraction an cloud optical properties, components of surface and TOA fluxes, and surface and TOA cloud forcings were determined.”
Sea Ice-Albedo Climate Feedback Mechanism – Judith Curry (June 1993)
http://curry.eas.gatech.edu/currydoc/Curry_JC8.pdf
Models, looks at melt ponds and ice thickness among other parameters. Starts off in the intro with the CAGW models show doubled CO2 concentrations is considerably amplified in the Arctic. Then goes into the snow/ice albedo feedback mechanism. It seems to be models all the way down but the reasoning is not too bad.
Finally a study (ten years later) that is not models all the way down.
Radiative transfer in the summertime Arctic
http://curry.eas.gatech.edu/currydoc/Benner_JGR106.pdf
More recently on her blog this summer Judith Currysaid:
I coauthored two papers that looked at both the arctic and antarctc sea ice versus enso
The second paper is:
Liu, J.P., J.A. Curry, and D.G. Martinson, 2004: Interpretation of recent Antarctic sea ice variability. Geophys. Res. Lett., 31, Art. No. L02205. http://curry.eas.gatech.edu/currydoc/Liu_GRL31.pdf
If you want to see what the actual energy is in the arctic vs the equator to get an idea of what is involved:
Click on the date to see his spread sheet.
The value of 1150 W/m^2 at the equator at mid day vs TOA for that day receiving 1353 W/m^2 gives a much better idea of how much energy is ‘lost’ before it encounters the oceans at the Equator and is absorbed or reflected. ‘Lost’ is being reflected or being available to interact with the upper atmosphere such as forming ozone. In other words at that latitude at midday the atmosphere is pretty darn transparent especially when you consider the chemical reactions taking place in the atmosphere and the fact that some of the incoming radiation is absorbed and transformed in to ‘heat’ – kinetic energy.
Solar radiation differentially heats the tropics and the poles. For example in September at noon the surface on a clear day could receive up to 1150Wm^2 at the equator while Lat. 80°N only receives 92 Wm^2.
The greater winter time meridional temperature gradients create the Brewer-Dobson circulation a winter phenomenon. It transports ozone and heated air upwards into the stratosphere and polewards. Next added in the Rocky Mountains and the Himalaya-Tibet complex, together with the Coriolis deflection, and you create a variation of Rossby waves called standing planetary waves.
When standing planetary wave reaches the stratosphere, it decelerates the wintertime jet stream and can even displace it, causing the displacement of the polar vortex. Cooling air sinks in the polar regions creating the meridional overturning from equator to pole in the winter hemisphere and thus establishes the Brewer-Dobson circulation cell.
That is all standard text book weather information. It is interesting that the Brewer-Dobson circulation cell that causes the displacement of the polar vortex is normally a WINTER TIME weather phenomenon.