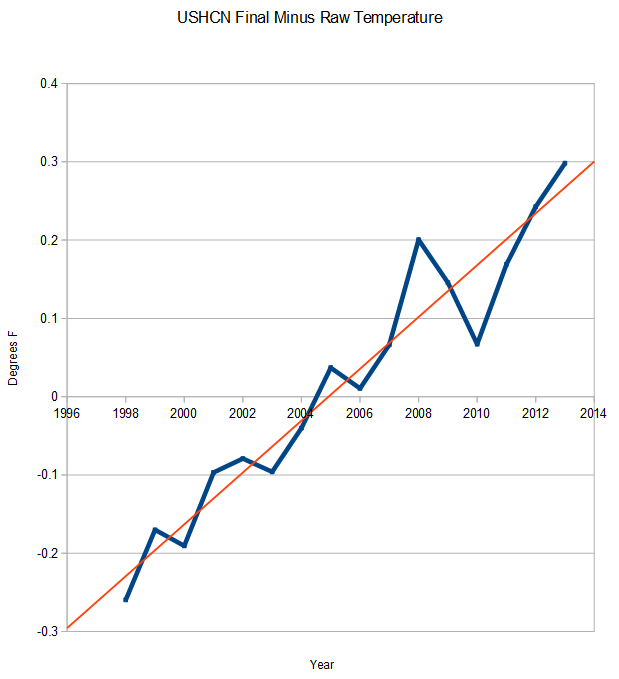
NCDC tells us that improvements in temperature reading technology since 1998 require an additional 0.5F adjustments
Disrupting the Borg is expensive and time consuming!
Google Search
-
Recent Posts
- Gaslighting 1924
- “Why Do You Resist?”
- Climate Attribution Model
- Fact Checking NASA
- Fact Checking Grok
- Fact Checking The New York Times
- New Visitech Features
- Ice-Free Arctic By 2014
- Debt-Free US Treasury Forecast
- Analyzing Big City Crime (Part 2)
- Analyzing Big City Crime
- UK Migration Caused By Global Warming
- Climate Attribution In Greece
- “Brown: ’50 days to save world'”
- The Catastrophic Influence of Bovine Methane Emissions on Extraterrestrial Climate Patterns
- Posting On X
- Seventeen Years Of Fun
- The Importance Of Good Tools
- Temperature Shifts At Blue Hill, MA
- CO2²
- Time Of Observation Bias
- Climate Scamming For Profit
- Climate Scamming For Profit
- Back To The Future
- “records going back to 1961”
Recent Comments
- Robertvd on Gaslighting 1924
- conrad ziefle on Gaslighting 1924
- arn on Gaslighting 1924
- Gordon Vigurs on Gaslighting 1924
- Bob G on Climate Attribution Model
- conrad ziefle on Climate Attribution Model
- Ohio Cyclist on Climate Attribution Model
- Bob G on Climate Attribution Model
- Bob G on Climate Attribution Model
- Bob G on Fact Checking NASA


Basically 1 degree then with rounding.
Improvements should require no adjustments.
What justification can NCDC have for including all these adjustments? Our thermometers are suppose to be getting more accurate and reliable with time, not the other way around.
I’m still waiting for that big negative adjustment for UHI. When will that show up?
“Today’s forecast…
Lower Gehenna, Highs around 100 C, with jets of fire and burning brimstone.
Hades, Highs around 100 C, humid and unseasonably hot.
Tartarus, Highs around 200 C, with a chance of scattered magma storms.”
With a forecast like that, I wouldn’t count on any time soon…
I remember that day. Spring of 2004.
Yes, I remember that glorious day, that one single day in late spring of 2004… After decades, and decades of being unable to properly read a thermometer, the scientists had finally collaborated on development of a technique whereby they could actually, definitively, look at a thermometer and get the real reading from it. It was wonderful! The numbers came rolling in, and all was right with the world — for one day. Alas! Every silver lining has a cloud, and the day was barely over when the same scientists who had so consistently read thermometers too high for all their lives, the same scientists who had at last managed to get it right for that one wonderful day, suddenly lapsed once more into the ways of error — only now they were reading their instruments too low. It was pandemic of climatological and observational hypothermia. The situation has only gotten worse. Every year that passes, the scientists become more myopic, less rational, increasingly unable to make sense of their own equipment. Every year they read temperatures lower and lower and lower.
Thank goodness, at least the fine savants at NCDC are helping fix all the mistakes!
Does this organization advocate recalibrating the official thermometer the US uses at NIST.
I stopped believing any of the USHCN “records” after dutifully downloading the daily data for several months. “Historical temperatures” can vary by as much as 4 degrees C, just from whatever the algorithms are doing to the “data”. For instance one of my favorites, that Paul Homewood has written about: Circleville Ohio. In July of 2014, the January 1934 temperatures ranged from 9.9C to 13C. You’d get a different temperature, depending upon what daily data set you downloaded. I believe this is an effect of the Pair-Wise Homogenization Algorithm, and not the UHI adjustments as some seem to think. To be honest, I’m no longer interested enough to find out exactly why…
Sure, from all I can gather we are actually on a slide down in temperatures globally but they can’t let anyone else know that, can they? The slide down started in ca. 2005. So they need even more and faster adjustments, double at least, higher slope of adjustments, just to keep public temperature graphs at least level and flat. Expect the adjustments to continue until about 2035if the 60 year cycle continues, right around 2 × +0.000625 K/mo unless they start allowing some of the decline to show through in the graphs.
However, that graph above shows adjustments to be a bit more than quadruple that rate which comes from the average over the span from 1940 onward. Why? One guess may be to force a little NCDC-made ‘warming’ to give the goons pleasure.
Tony, I believe it was you that started me looking harder into these ‘adjustments’ quite a while ago and for that… a big thank you.
Thermometers doesn’t need any adjustment in the way they read the temperature, because I believe that they just need an improvement. All of us wants to have an accurate thermometer and can give a quick reading.