
July maximum temperatures in Wisconsin have dropped at a rate of 1.9 degrees per century since 1895, but our friends at NCDC wipe out almost all of this decline by altering the data.
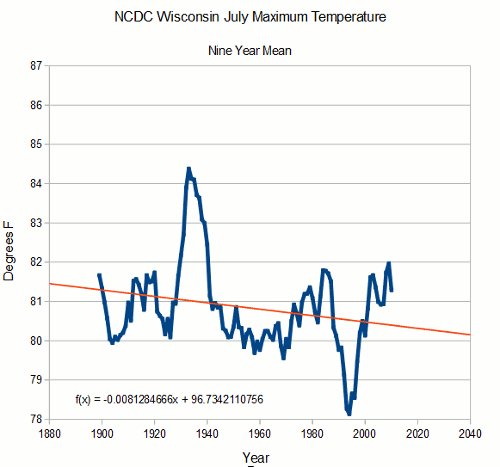
The adjustments are a spectacular hockey stick of cooling the past.
They blame their adjustments on things like time of observation bias (TOBS) but that story doesn’t hold any water.
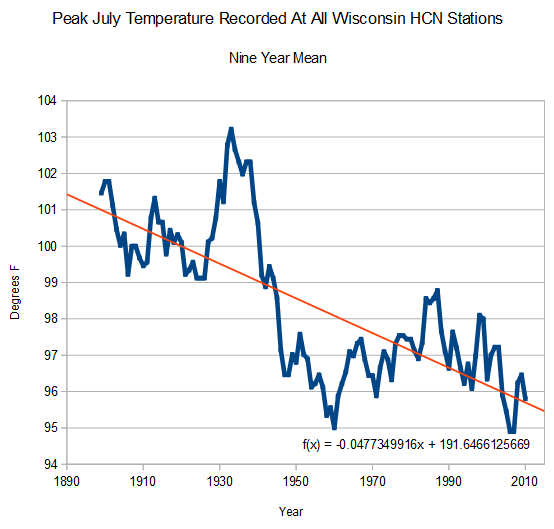
The next graph shows the peak July temperature recorded at all Wisconsin HCN stations. This is a measurement which can’t be affected by TOBS, because it wouldn’t make any difference if you double counted the peak temperature for the month. It shows that Wisconsin summers were consistently much hotter prior to 1950
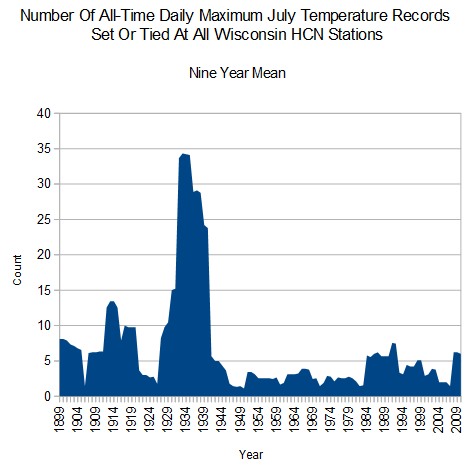
And the next graph shows the number of daily July all-time temperature records set or tied at all Wisconsin HCN stations. Once again, this measurement is not likely to be affected significantly by TOBS, and shows that Wisconsin summers used to be much hotter.
The bottom line is that the USHCN temperature adjustments are fraudulent, they hide the decline in US temperatures, and they do them all over the country.
The worst forest fires in US history occurred in Wisconsin during the 19th century. They almost never have large fires any more.
http://www.rootsweb.ancestry.com/~wioconto/PeshtigoFullFireMapOnly.jpg

Occasionally, some of your visitors may see an advertisement here.

It’s “interesting” that the last time temperatures dropped (as they did in the 60s & 70s) like they have done for the lat 15-20 years, the climate experts were warning us of an impending return of an ice age. Obviously before someone figured out that the money is in Global Warming, not cooling.
Here’s something I don’t understand about the TOBS corrections (your figure 2 above). The reason, supposedly, that corrections change over time is because observers *gradually* shifted their observation times from one standard to another (presumably midnight?). I assume they were just following orders from the National Weather Bureau or NOAA. Why didn’t they all change to a new standard at the same time? Was there no control over this? And why do any corrections extend to the modern era when temperatures were monitored around the clock (certainly since the 70s, 80s)? Can we look at other local temperature data to see if the TOBS corrections are valid for a given site (I know that the algorithm for correcting the TOBS error is approximate, based on an old model, and is location-dependent)?
The adjustments are COMPLETELY POLITICAL.
The station down the street from me (very rural) was put in and started running as of March 2001. It is State of the Art with temp listings every half hour available to the public. Therefore there is ZERO reasons for any adjustments.
The minimum temperature for April 6 was 44 °F and changed to 48 °F on April 8.
For April 15th 2014 the current record shows a Min Temperature of 41 °F (the 14th shows 63 °F and the 16th shows 34 °F)
On April 16th at 6:21 am “history for April 15” showed:
METAR….Temp….Dew point
5:55 AM…35.1 °F….25.3 °F
6:55 AM…34.0 °F ..24.8 °F
11:55 PM…35.6 °F ..34.7 °F
These temperatures are no where NEAR 41 °F!
……
They played games with the high temperatures too.
I counted the temperatures 90 °F or above during the summer of 2013. None in April or May unlike other years and only FIVE days at 90 °F and over (one at 95 °F) Unfortunately I did not keep good copies of the data.
In the spring of 2014 the data was:
June 2013 (3)
2 days – 90 °F
one day — 95 °F
Jul 2013 (7)
3 days – 90 °F
1 day — 91 °F
3 days – 92 °F
Aug 2013 (4)
one day — 90 °F
2 days – 91 °F
one day — 92 °F
Sept 2013 (1)
one day — 91 °F – 1
TOTAL 15 days 90 °F and ^ NOT 5!
There were 105 days 990 °F and above for the three years I looked at scattered over the last ten years so that is enough data to see a trend. The data is in °F but looked funny so I also included °C.
Temperature ———- COUNT
(32.2 °C) 90 °F..——..6 ALL in 2013
(32.8 °C) 91 °F..——..41
(33.3 °C) 92 °F..——..4 ALL in 2013
(33.9 °C) 93 °F..—–..10
(34.4 °C) 94 °F..——..0
(35.0 °C) 95 °F..—–..17
(35.55 °C) 96 °F..—..10
(36.1 °C) 97 °F..——..0
(36.67 °C) 98 °F..—..16
(37.2 °C) 99 °F..-..0
(37.77 °C) 100.°F-..1
Now that distribution is weirder than snake shoes. ALL the data for 90 °F and 92 °F is in 2013 and it just so happens to add up to the extra 10 above 90 °F that wasn’t in the same data set last year.
Make of it what you will. But you might want to do as I did, copy data for this year from a rural station near you and then look at how it changes over time.
Nice work
Wow, that’s sad… that’s … yep… its FRAUD !!
Somebody needs to file a Lawsuit here.. Geez…
Steve/Tony,
The considerable evidence you have laid out has comfirmed everything I ever believed, just being someone who liked to look up weaher records for fun, having excellent access to the NOAA Library for many years going back to the 1960’s.
I guess the question now is how to get all this information out to the public so that anyone with an iota of curisousity can find the facts for themselves. Have you considered publishing a journal of some kind? Though your website is a pretty good means. Just that not enough people seem to know about it.
Andy
I think it is painfully obvious by now that max temps are NOT increasing in the US, and many are exhibiting a steady decline since the 1930’s.
Has anyone on the Warmist side attempted to explain how AGW could be responsible for a decline in maximum temperatures at the same time as a rise in minimum temperatures? They are always posting average temperatures, without discussing the fact that min and max temps are behaving in completely opposite ways which get muddled by using averages.
Unless they have a better explanation, the most obvious explanation seems to be that natural atmospheric temperatures are actually declining, but that the minimum temps are rising primarily due to an underappreciated Urban Heat Island (UHI) effect.
Oh, they have a pat answer…of course minimum temperatures are going up, that is to be expected.
These are the same idiots who support things like passive solar houses…with large ‘thermal mass storage’ devices…made of concrete, stone, brick, asphalt, etc. But such things don’t matter to the general urban (suburban) temperature record…UHI is not a problem or at most a very minor ‘blip’.
I’m not sure if that was the largest fire in US history. In 1910 there was a fire that burned over 3 million acres in Washington, Idaho, and Montana. In 1905 there was a fire that burned about 95% of the state of New Mexico plus parts of surrounding states. And before records were kept wild fires often burned on and on until winter. Fires frequently burned the whole great plains to the Mississippi river. In Washington this year the liberal media claimed a 250,000 acre fire was “The biggest ever in Washington,” ignoring the “Great Fire” of 1910.