
The US drought monitor shows North Texas in exceptional drought
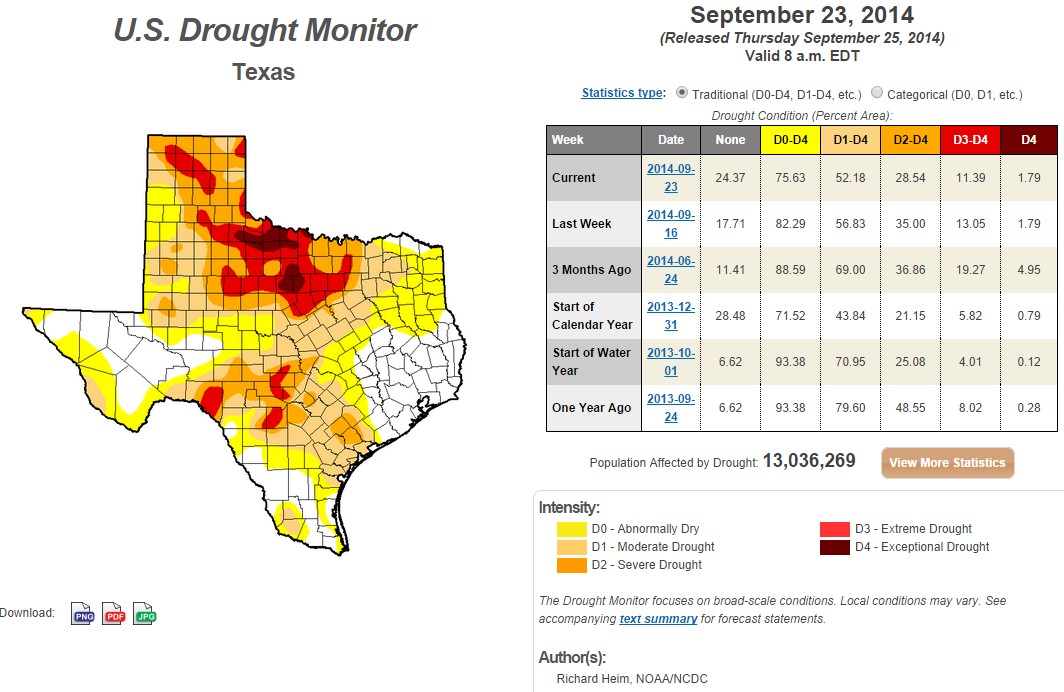
This is quite impressive, considering that region isn’t experiencing any drought.
The US drought monitor shows North Texas in exceptional drought
This is quite impressive, considering that region isn’t experiencing any drought.

Seems the US government is doing a really good job of teaching kids to not trust the government or the media.
Some remain brainwashed but the brighter kids have figured out they are being fed B. S.
A recent conversation with a high school sophomore warmed my heart. Not only does he understand CAGW is B. S. he also knew the science and could certainly give Al Gore or even Jim Hansen a run for his money.
I hope you are right.
It pays to talk to kids one on one.
Most are happy to have an older adult talk to them and not talk down to them. Get a discussion going. Banking is usually a good one because it is politcally neutral. The idea is to get them thinking and engaged and to make them realize the teachers and MSM are not the only place to get info.
I have had some rather intense conversations with blacks in dredlocks at burger joints.
The last guy was taking economics!
Absolutely correct. I used to tutor Junior High and High School kids as a volunteer. They were mostly minority, but a good mix. When we talked, which was often, they often had a better grasp on reality than adults I worked with.
I used to follow the US drought monitor quite closely. For over a year, it showed my county in a severe drought, even though folks were getting stuck with their riding lawn mowers trying to mow their backyards. And the ponds were as high as we had ever seen them. In comparison to the 1930s when the lakes dried up. I do not know the algorithm that the US drought monitor uses to develop its graphic, but it does seem to overstate dry conditions.
I think they have abandoned algorithms and are just colouring with a red crayon!!
My impression of the algorithm is that if you have less rain than you did last year, you are now having a drought…even if the previous year was an extremely wet year and the current year is normal to wet.
Heh. Droughts are relative in my area. We had a drought, a severe one if you put your faith in NOAA, when we got a foot less rain than average. What’s our average you ask? Oh, some 55 inches a year (hydrological, which goes from October to October). A lot of places would love to have 40 inches of rain each year. Most ‘dry’ years see about 4 feet of rain, most ‘wet’ ones about 5 feet here. I suspect the index uses the variance from the monthly mean. I have not looked into it, so I’m probably wrong.
It has to be something like that…variance from the monthly mean. Where I live is probably the one of the ‘wettest’ areas in the East.
It doesn’t hurt the index that a number of the rain events, this summer, at least here, were severely under-reported. Tipping bucket rain gauges are notorious for under-reporting rapid cloudburst type rain…the 1/2″ in 15 minute kind of rain. More than once, this summer, the ‘official’ gauge reported less than 0.1″ of rain while radar and my ‘coffee can’ gauge reported over 1″. My count showed us being about 2″ above for the months of June, July and August, while the ‘official’ report is about 1 1/3″ down. Of course the index was showing my area as ‘dry’ or worse, earlier this year. But, last week the NWS made an ‘official’ statement that it had been a ‘wet’ summer in WV, so everything is now showing ‘normal’ or wetter (except for a small part of eastern WV).
It is immaterial how much rain you receive, the only thing that matters is who measures the rain that you do receive. — Nickolas Stalin – Joe’s big brother.
Only if the collective allows you your ration of rain, Comrade.
We’re from the government we are here to help…
ourselves…
to your money.
Where do they get their data? NWS AHPS shows more than half of Central Florida at 110 to 150% of normal with spots around showing 200% on the 30 day maps. The 180 day maps have well over half wearing the colors of 110% to 150% as well. Southeast RFC shows even higher numbers. We got flood warnings from NWS the other day… usually only happens here with slow tropical storms or slow hurricanes but we’re getting them now… along with 0.5″ to 1.0″ of rain every day. It’s the 26th of the month and we’ve had 26 days of rain totaling almost 30″. NOAA averages are 13 or 14 days of rain for 7-8″ total accumulations for September based on 1981-2010. The ditches are full and pastures are flooded and they’ve been that way since the end of June.
But… according to this Palmer Drought “Fantasy” we’re “mid range” in the drought index??? I assume from that they would rate the the Monsoon Season in Southeast Asia as “moderately moist.” Here’s yet another piece of “scientific data” I’ll now be ignoring.
no big deal, but you left off the appropriate apostrophes…it should read “we’re from the government and we’re here to….”