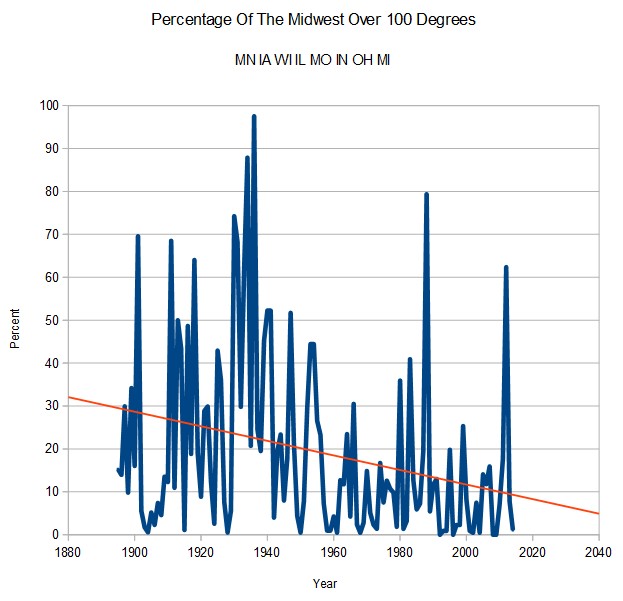
In the 19th century, about 30% of stations in the Midwest would reach 100 degrees every year. Now that figure is less than 10%. In 1936, almost every station in the Midwest reached 100 degrees.
Disrupting the Borg is expensive and time consuming!
Google Search
-
Recent Posts
- Ice-Free Arctic By 2014
- Debt-Free US Treasury Forecast
- Analyzing Big City Crime (Part 2)
- Analyzing Big City Crime
- UK Migration Caused By Global Warming
- Climate Attribution In Greece
- “Brown: ’50 days to save world'”
- The Catastrophic Influence of Bovine Methane Emissions on Extraterrestrial Climate Patterns
- Posting On X
- Seventeen Years Of Fun
- The Importance Of Good Tools
- Temperature Shifts At Blue Hill, MA
- CO2²
- Time Of Observation Bias
- Climate Scamming For Profit
- Climate Scamming For Profit
- Back To The Future
- “records going back to 1961”
- Analyzing Rainfall At Asheville
- Historical Weather Analysis With Visitech
- “American Summers Are Starting to Feel Like Winter”
- Joker And Midnight Toker
- Cheering Crowds
- Understanding Flood Mechanisms
- Extreme Weather
Recent Comments
- conrad ziefle on Ice-Free Arctic By 2014
- Bob G on Ice-Free Arctic By 2014
- Bob G on Ice-Free Arctic By 2014
- conrad ziefle on Ice-Free Arctic By 2014
- conrad ziefle on Ice-Free Arctic By 2014
- Disillusioned on Ice-Free Arctic By 2014
- conrad ziefle on Debt-Free US Treasury Forecast
- Nicholas McGinley on Debt-Free US Treasury Forecast
- Nicholas McGinley on Debt-Free US Treasury Forecast
- Bob G on Ice-Free Arctic By 2014


Thank you, Steven, for exposing climate change fraud.
Steven- what is the math behind the trend line?
Open office “Insert trend line”
OpenOffice Forum https://forum.openoffice.org/en/forum/viewtopic.php?f=9&p=145220
all about open office trend lines.
Those charts correlate very with the US corn crops. The years that spike are the years where there is a considerable reduction of the crop. Obviously there has been a down trend in that regard. More good news that alarmists don’t want to talk about.