
Arctic ice propaganda at NSIDC depends on graphs like the one below, which cleverly start at peak ice in 1979, and create the deceptive appearance of a linear decrease in ice – intended to fool the reader into believing it is due to CO2 emissions.
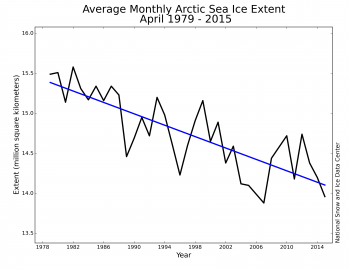
But they are hiding the Nimbus 5 microwave satellite data, which goes back to 1972 and was included in the 1990 IPCC report. The Nimbus 5 data completely wrecks their story, because it shows that ice in 1974 was no more extensive than it is today, and that NSIDC cherry-picked 1979 as their start date.
Below is an image from the Nimbus 5 satellite, taken in January 1976 – which shows how detailed the imagery was. NSIDC has no excuse for not using it. It was used in both the IPCC FAR and SAR reports.
Also interesting to note how much Antarctic sea ice has increased since 1976. The gain has been massive.
There is probably more sea ice on Earth now, than there was in the mid-1970s – which was the peak of the ice age scare.
NSIDC also failed to include this graph in their April Sea Ice News – which they normally do in April. Paul Homewood had to make a special request to obtain it.
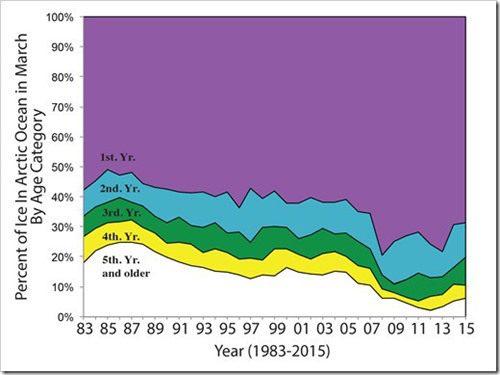
Arctic sea ice extent in 2014/2015 has been essentially identical to 2005/2006
NSIDC knows that Arctic sea ice is recovering, but they are hiding the information from the public.
It is stunning to think about the level of propaganda here. Sea ice on earth has increased since the 1970s ice age scare, yet we are being led to believe that Earth is overheating and the ice caps are disappearing.
[youtube=https://www.youtube.com/watch?v=0iYAjyTcaFI]

They are shameless and it is all very shameful. Keep up the good work. The truth will out.
Reblogged this on Climatism.
“It is stunning to think about the level of propaganda here.”
Not a lot of people know that!
http://GreatWhiteCon.info/2015/04/gross-deception-measuring-arctic-sea-ice-trends/
The truth will out.
Jim, noticed that you didn’t address the 1979 starting point and that you left out the 1972 starting point of the data from the Nimbus 5 satellite,that showed a much lower level.
Tony, was pointing out the dishonest starting point from 1979,which doesn’t seem to bother you. Meanwhile YOU left out this part on your overrated 1953-2012 chart:
“Satellite data from the SMMR and SSM/I instruments have been combined with earlier observations from ice charts and other sources to yield a time series of Arctic ice extent from the early 1900s onward. While the pre-satellite records are not as reliable, their trends are in good general agreement with the satellite record and indicate that Arctic sea ice extent has been declining since at least the early 1950s.”
So they combine a good satellite coverage with far less quality indirect coverage of the region to say it is credible……. ANOMALY chart that has no error bars on it since there is a lot of indirect measurement built into it.
Your “truth” is selective and dishonest.
“….Temperature rises faltered, so the data was altered,
The pseudo-scientists must protect their illusion,
Their political masters demand warming disasters,
Misinformation abounds in profusion.
More false claims being made just to keep us afraid,
And dare question you become a denier;
A shocking display to use fear in this way,
But remember that fear is a liar!….”
Read more: http://wp.me/p3KQlH-FY
The drop in temperature over the southern polar circle causes the appearance of the ozone hole at a height of between 20 and 30 km.
http://www.cpc.ncep.noaa.gov/products/stratosphere/strat-trop/gif_files/time_pres_TEMP_MEAN_AMJ_SH_2015.gif
http://www.cpc.ncep.noaa.gov/products/stratosphere/strat-trop/gif_files/time_pres_TEMP_ANOM_AMJ_SH_2015.gif
The temperature over the North Pole significantly below the average.
http://ocean.dmi.dk/arctic/plots/meanTarchive/meanT_2015.png
Click graf.
Cosmic radiation begins to increase.
http://sol.spacenvironment.net/raps_ops/current_files/rtimg/dose.15km.png
Click.
The average absorption of solar radiation on 5/13/15 is 236.3 W / m ^ 2.
It is a 4 W / m ^ 2 less than the reported average 240 W / m ^ 2.
http://www.ospo.noaa.gov/data/atmosphere/radbud/gs19_prd.gif
Click.
It is not true that a change in the cycle TSI 24 is too small to make cause a drop in temperature. Observations show something else.
http://www.woodfortrees.org/graph/pmod/from:1990
https://youtu.be/Zofmae_7XtE
NICE!!!
I am a physicist. I have been a physics professor for 22 years now. I believe in the conservation of energy. With more greenhouse gases in the atmosphere, more energy is being absorbed by the planet than is being radiated into space. It’s really very simple: the planet, as a whole, is warming up steadily. You cannot stop this process except by reducing greenhouse gases, or somehow increasing the albedo (reflectivity) of the planet itself.
Nothing I say above is an opinion – these are facts.
Yes, there will be (and have been) fluctuations in sea ice, sea temperature (surface and subsurface) and the atmosphere. Different regions will experience different changes at different times. But, overall, it is happening: the energy has to go somewhere and it will go into all of these things more and more as time goes on.
We are now in a situation with our atmospheric CO2 and ocean acidity that the earth has not seen for millions of years, and there already are consequences and there will be increasing consequences to come. The longer we wait the more costly it will be to adapt, if adaptation is possible.
Try to just step back, consider these facts, and begin to accept reality, folks. It’s here.
Energy is here.
http://woodfortrees.org/graph/pmod/from:1900
http://www.climate4you.com/images/SunspotsMonthlySIDC%20and%20HadSST3%20GlobalSeaSurfaceMonthlyTemp%20and%20300mbSpecificHumidity%20Since1960.gif
http://woodfortrees.org/graph/esrl-co2/from:1900
Are these facts?
If Artic sea ice is increasing why are the Chinese and everybody else lining up to use the north west passage?! Besides I’d worry more about ice melt on Greenland which is not floating but up on land.