Today, I checked the temperature data from Durban, a city in the South African Province of KwaZulu-Natal.
Looking at the data from the GHCN V2 dataset, we can see the city has had a cooling trend since 1885.
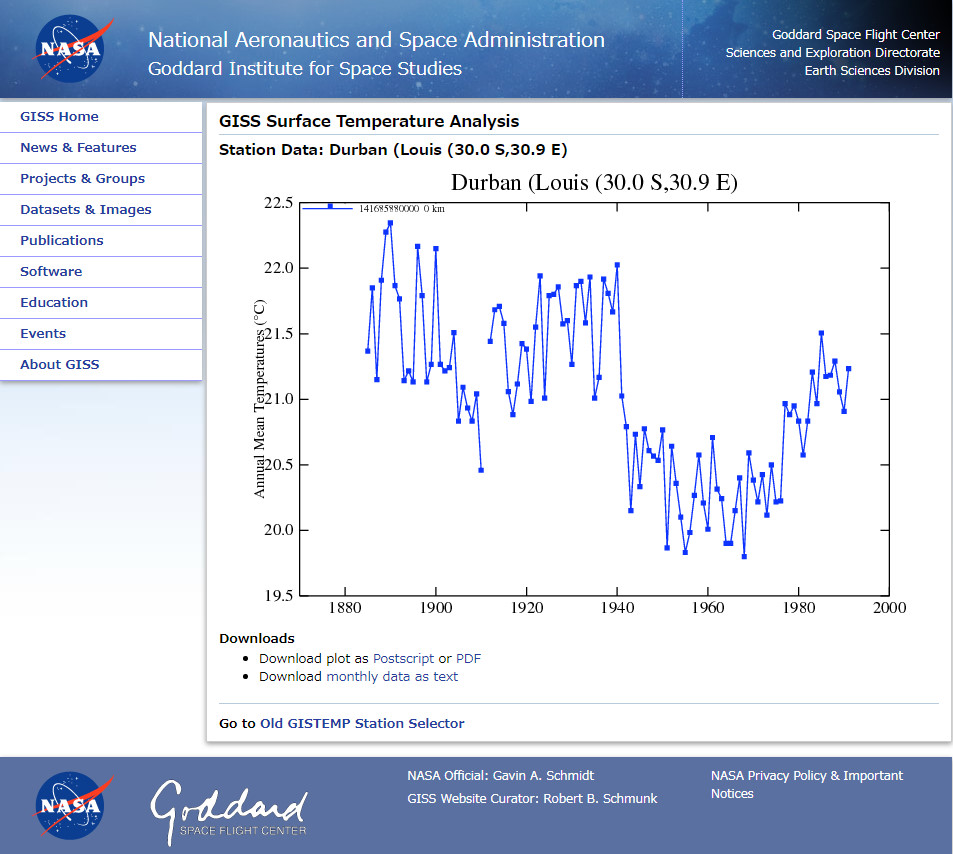
The chart from V2 above has data from 1885 to 1991, so let’s compare that period between the three versions of Unadjusted data.
? GHCN V3 Unadjusted / GHCN V4 Unadjusted
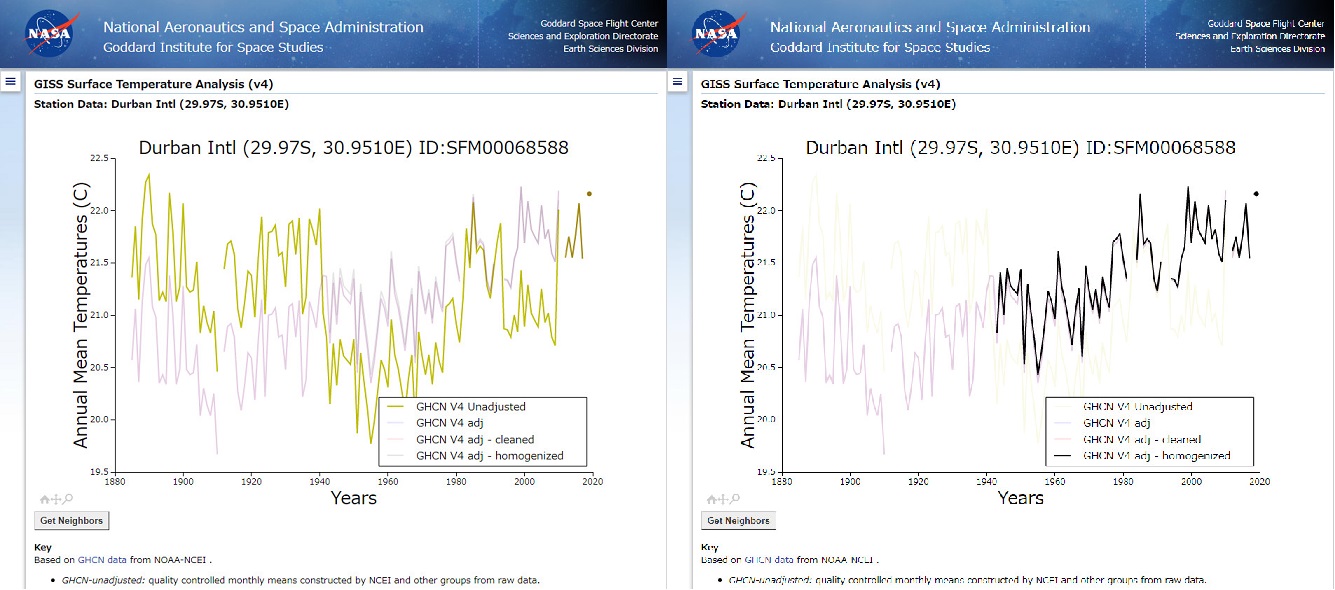
NASA used to claim that GHCN-Unadjusted is the raw data as reported by the weather station.
However, the unadjusted data the agency shows does not look like unadjusted data.
Comparing the GHCN V4 Unadjusted data and the GHCN V4 adj – homogenized data makes the story get even worse.
As you can see, NASA erased a cooling trend and created a warming trend.