What Changed In Texas?

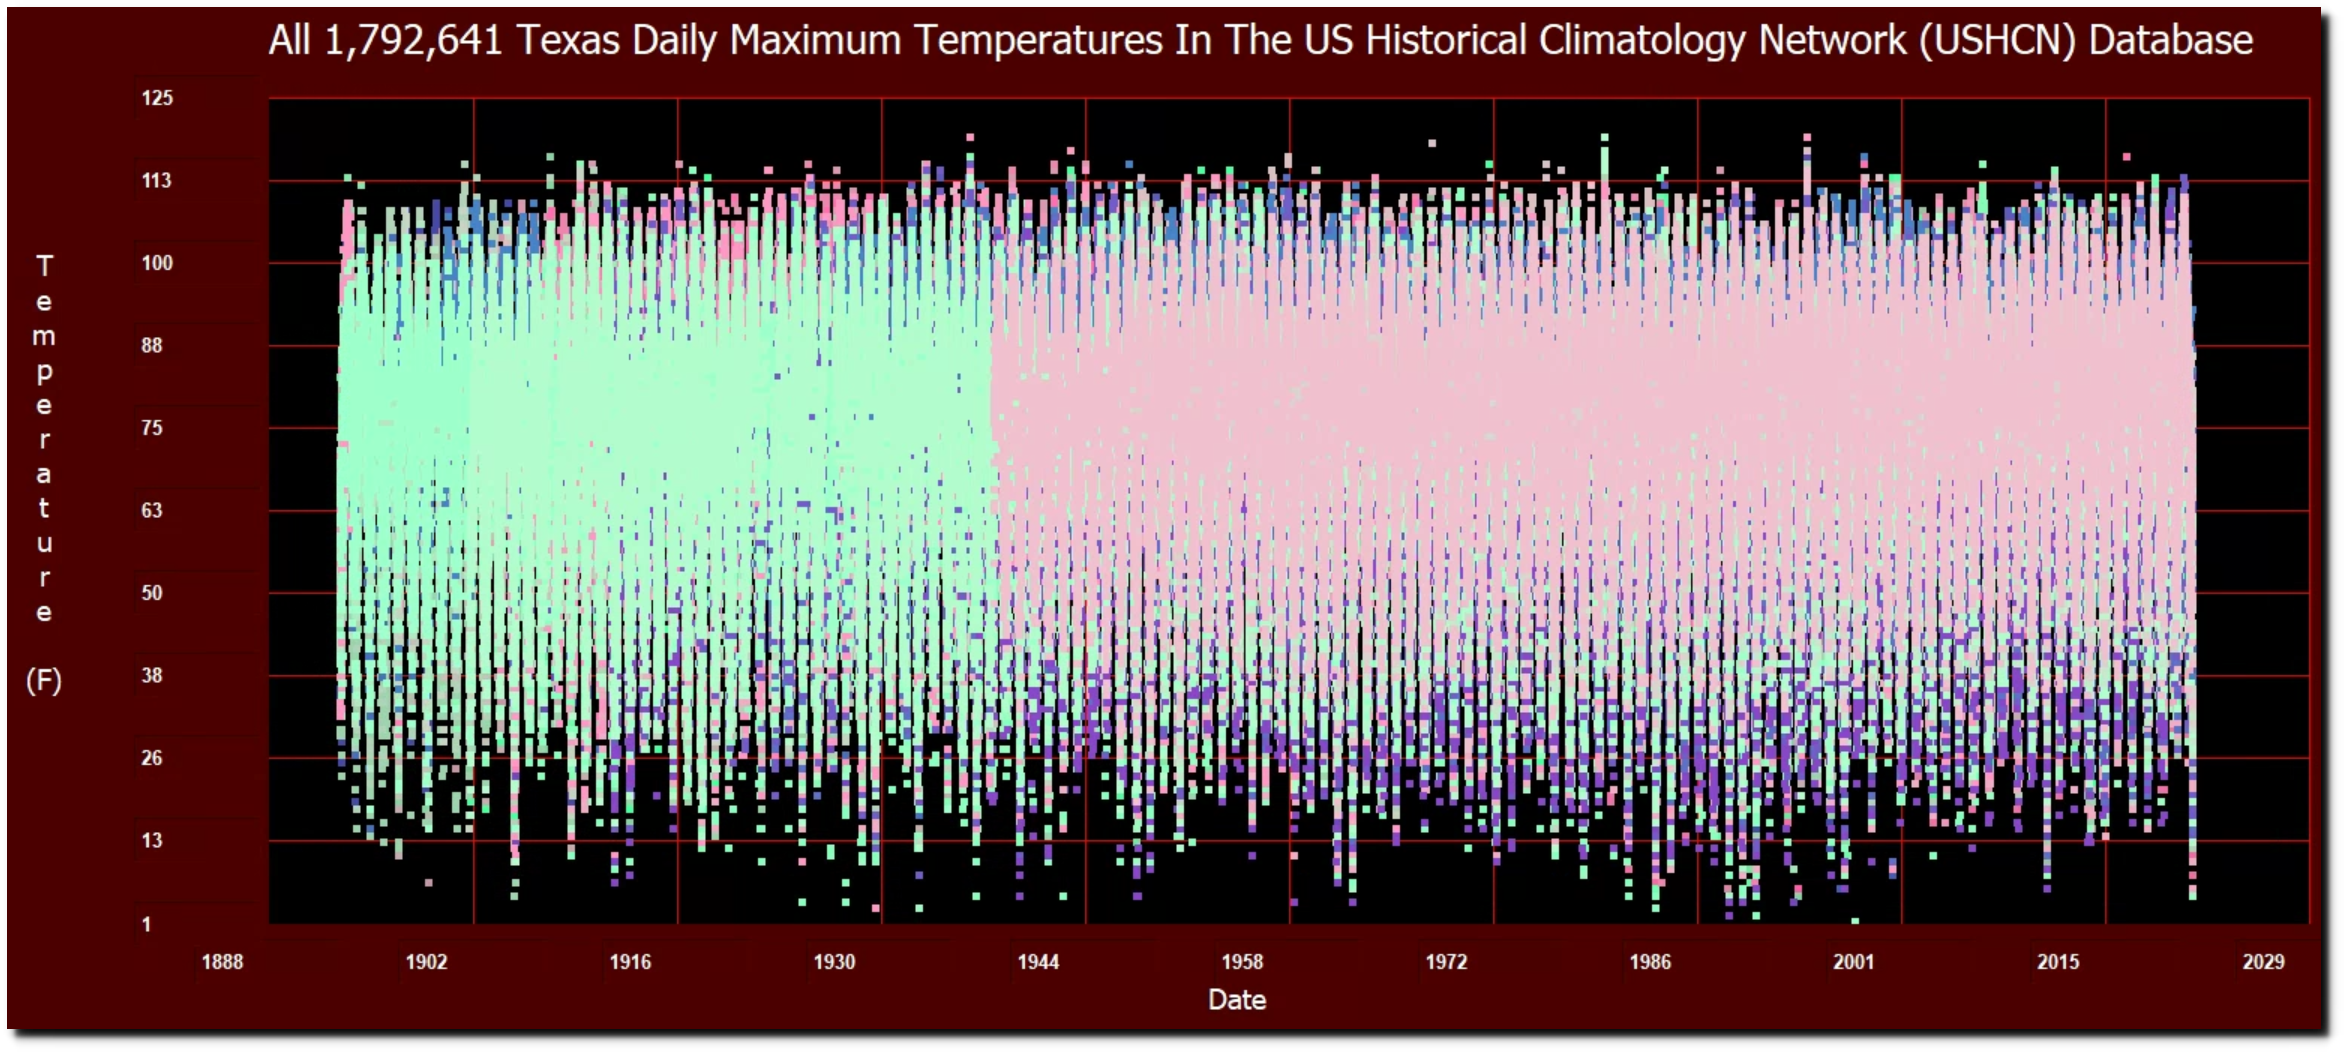
This graph shows all 1,792,641 daily maximum temperatures in Texas recorded in the USHCN database going back to the 19th century. Texas had similar cold in many years, including 2011, 1991, 1990, 1989, 1983, 1963 and 1961. But Texas used to rely on fossil fuels, rather than wind. I was living in Houston during the 1989, 1990 and 1991 cold snaps.

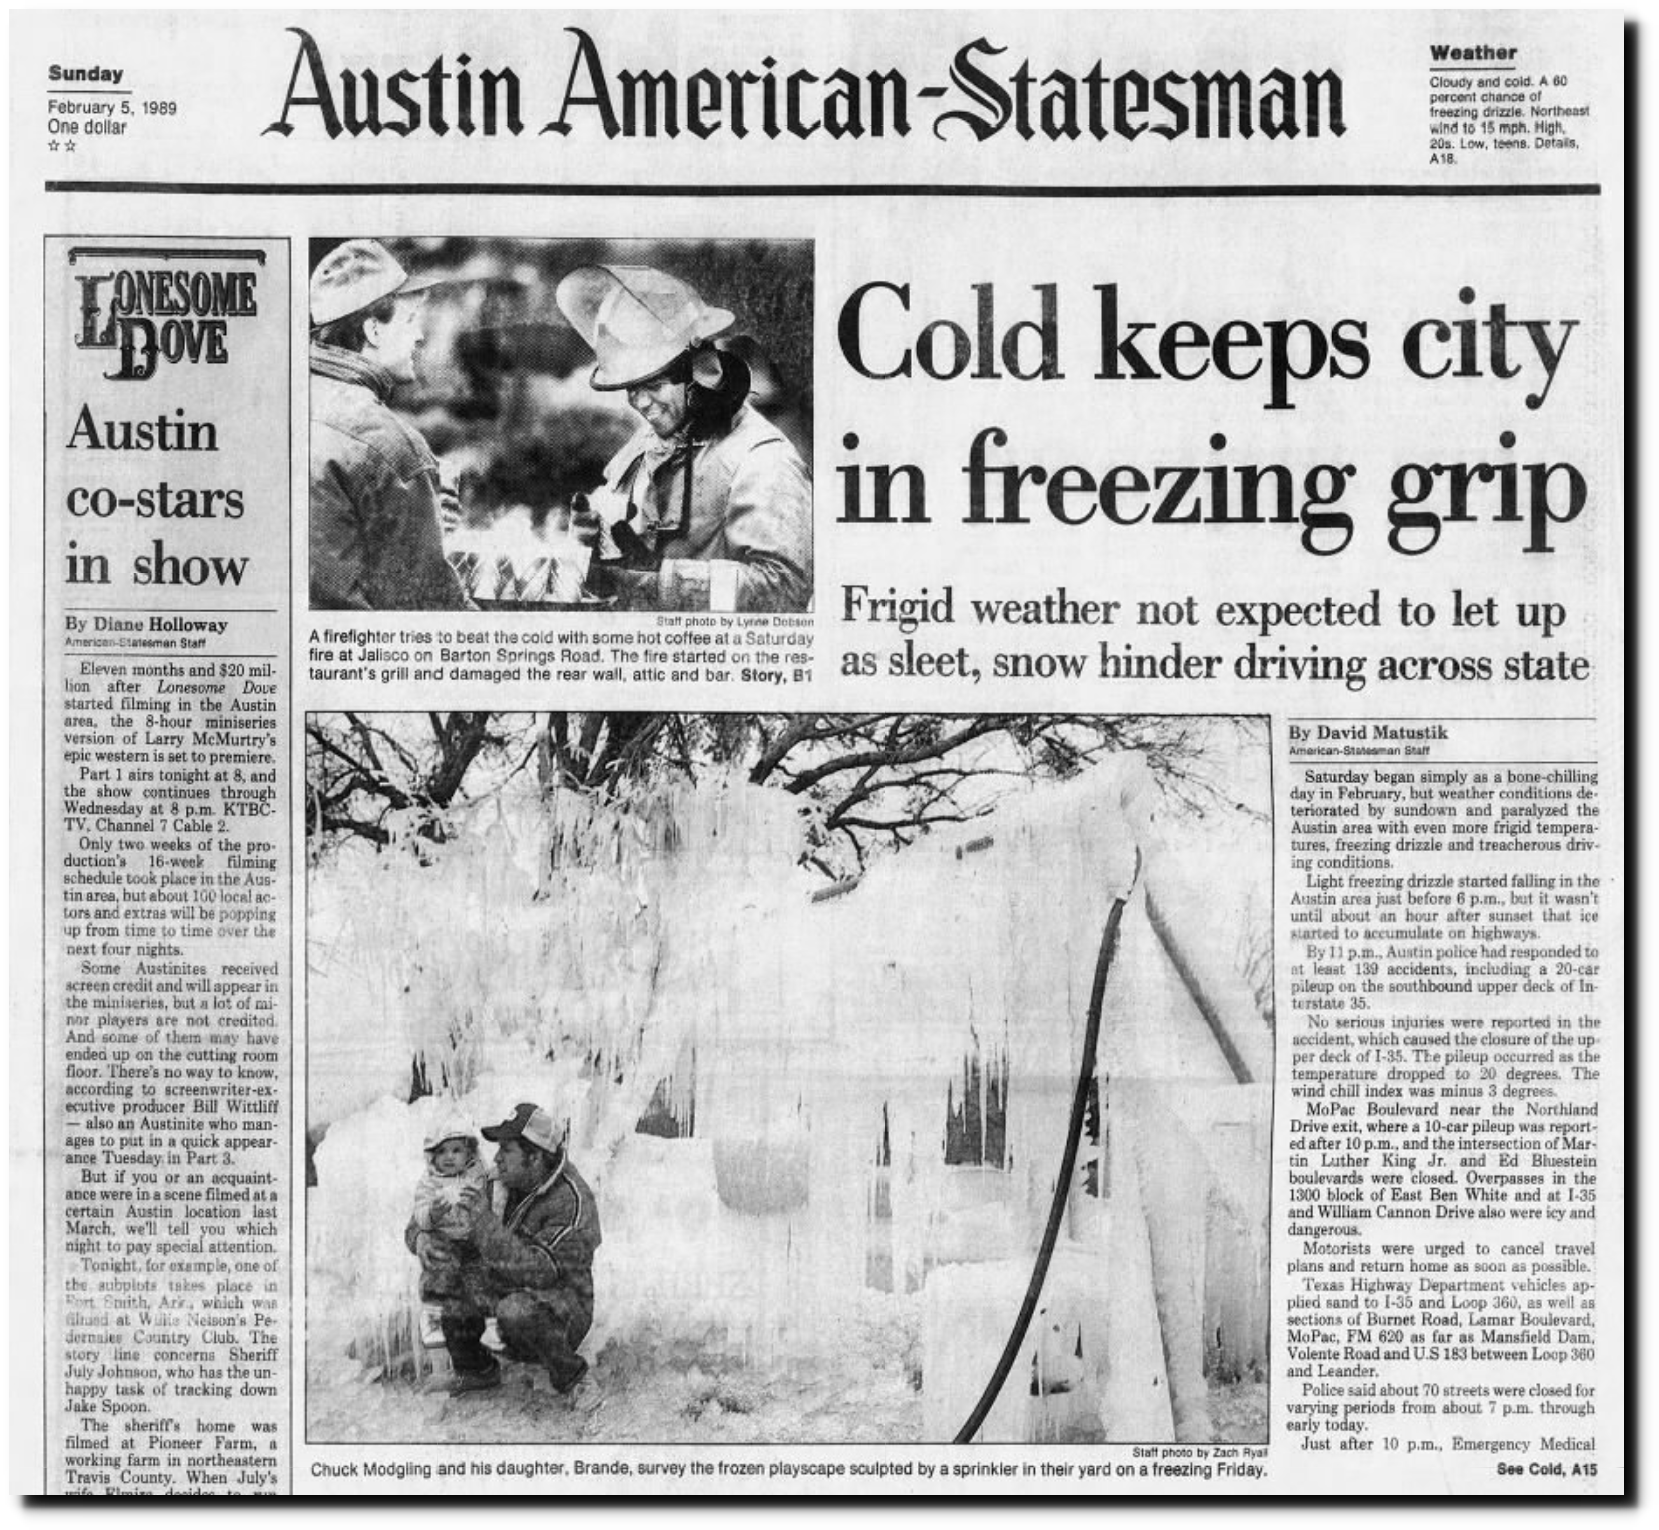
05 Feb 1989, 1 – Austin American-Statesman at Newspapers.com

The climate hasn’t changed. What has changed is the propaganda which has driven politicians to lunacy.

This entry was posted in Uncategorized. Bookmark the permalink.

12 Responses to What Changed In Texas?

  1. G W Smith says:

    What has change is respect for truth has taken a nose dive. Respect for others, respect for God, personal integrity and honor, all have been trampled under to leftist boot. A special thanks to BO.

  2. John Sturges says:

    What has changed is social media shaming as a few individuals have successfully sought authority over others using social issues of Global Warming, BLM and etc. It is not about the issues. Any issue will do as long as these folks can advance their careers being professional critics.

    It is truly about stepping on the productivity and innovation of others to advance one’s self interest. It is insidious behavior and has been part of society forever. What they do is pick a topic too big for the average person to understand, make false claims and position themselves as the solution.

  3. Robertvd says:

    Texas Just Ended the Future of Electric Cars in America
    Scotty Kilmer
    https://youtu.be/4111nIN7GMQ

  4. Shawn Rodgers says:

    What changed was Texas deregulated electric power such that power providers had no responsibility for providing power. Texas deregulation went into effect in 2002. Whatever was cheapest was the best. Building wind turbines that can withstand freezing temperatures was not cost effective. Maintenance was also a lower priority. When you ignore facts to support your views that is manipulation and propaganda.

    • Richard says:

      you’re missing BIG MONEY was involved such as T Boone Pickings who made Billions put wind mills up- GE Semi’s etc. the entire GW green energy programs who Obama paid out Billions of $$$ like the plant in Nevada at $1 billion is a total failure – Biden is going to do the same scams shams just like obama did

  5. Alexander+MCCLINTOCK says:

    As a kid in Belfast in the 1960s, I would often see an old bloke with his sandwich-board around his neck in the streets. The message said. “The end of the world is nigh”.
    What is it about human psyche that makes such sentiments so appealing?
    Mann started with “The end of the world is nigh due to cooling”,
    now it’s “The end of the world is nigh due to heating”.

    My wife is suggests that CAGW/CAGC is due to a shortage of 16 year old virgins for sacrifice. It’s just another unintended side effect of The Pill. ;)

  6. Mike W says:

    What do the different colors in the first chart (daily temp max via USHCN) represent? The overall green to pink shift around 1940 is quite obvious but I don’t understand what it is supposed to indicate specifically.

  7. D. Boss says:

    Tony, part of the problem is that almost everyone, everywhere is using flawed or selective or adjusted data to justify this insane Cult of Thermaggeddon.

    Last night on my local weather broadcast the normally objective meteorologist spouted off some bull chips that our Feb temps here in Palm Beach County Florida have risen 2.2 deg F since the 1970’s.

    Wasn’t that the low point where experts said another ice age cometh? By using selective data and starting with a very cold point you can fake warming.

    Isn’t there some way to get your hard hitting data and analysis and historical supporting literature research to a more mass media outlet? If enough people could see your presentations, a lot of this nonsense could be ridiculed into oblivion.

    Have you ever considered having your own show on “The Blaze” for example? I’d bet Glenn Beck would welcome you as a host of a Real Climate video or radio program. You could do your thing to a much wider audience and even have guests on to either support your positions, or even to debate you….

    https://www.theblaze.com/about

    They claim 165 million audience per month….

  8. Gary Hudson says:

    If possible, I would love to see a map showing atmospheric pressure, wind speed and temperature in Texas during both hot and cold extremes. This might educate the wind farm fanatics that wind power is not reliable available during hot and cold periods

    • Richard says:

      The average capacity factor for modern wind turbines in the US is 41.9%. The average size of new wind turbines in the USA is 2.43 MW in capacity.
      how many wind turbines would be required to generated 3.15 TWh of electricity.

      3.15 TWh divided by 2.43 MW capacity divided by 24 hours divided by 365 days divided by a capacity factor of 41.9% gives us about 353 wind turbines.

      So the first answer is that just over 350 wind turbines are required to replace a coal generation plant which likely has 2–3 generating units. That means that about 120–175 wind turbines are required to replace a single generating unit.

Leave a Reply

Your email address will not be published. Required fields are marked *