
I’ve spent thirteen years documenting how NASA’s James Hansen got everything wrong – and how he corrupted temperature data to cover it up. But he says he was correct about everything.
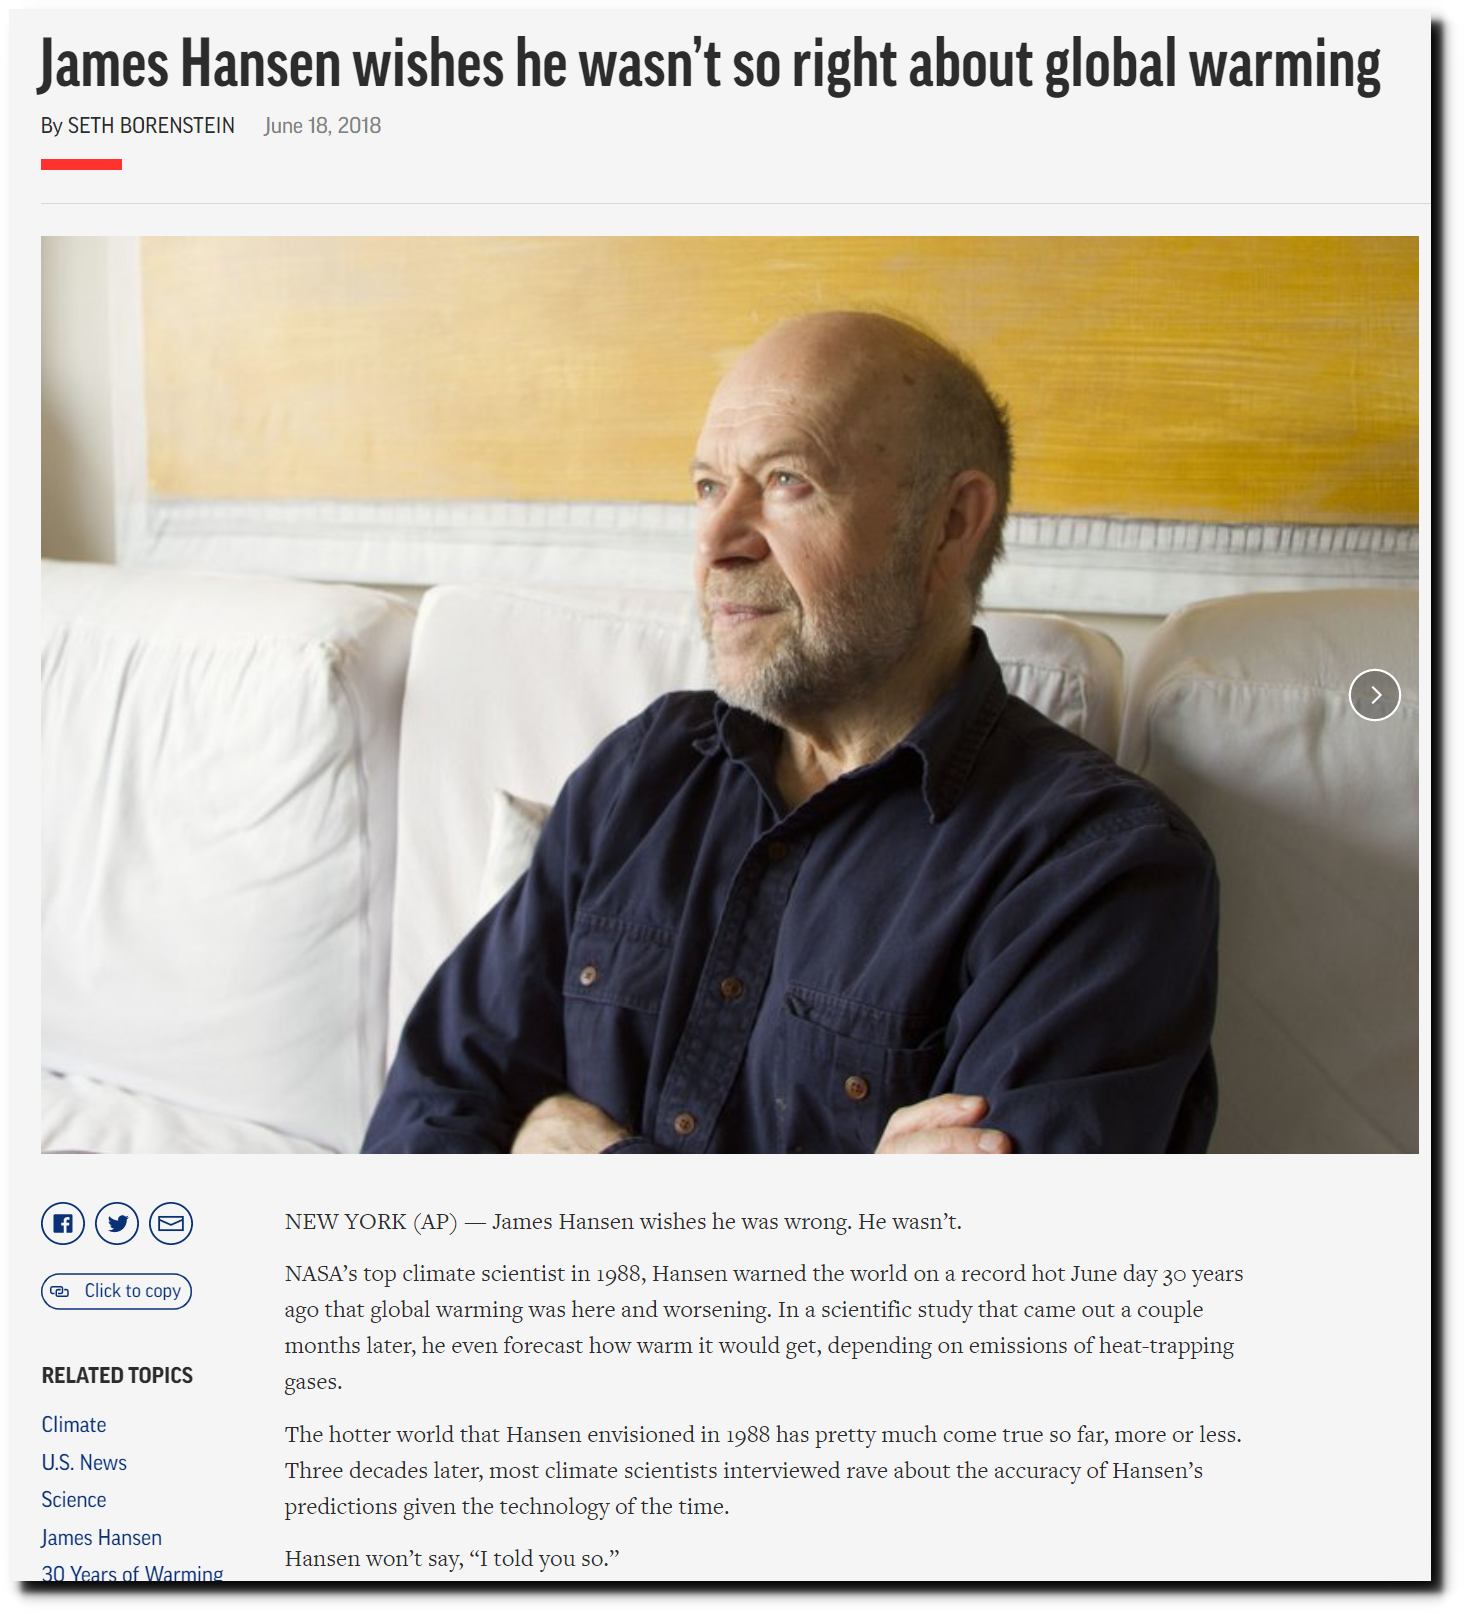 James Hansen wishes he wasn’t so right about global warming
I’m not going to detail his impressive list of failures here, but I am going to discuss the key failure which doomed all of his other predictions to failure as well. Central to his global warming theory is that a hot spot would appear in the lower troposphere near the equator. In 1985, he predicted 7C warming in the tropical troposphere hot spot.
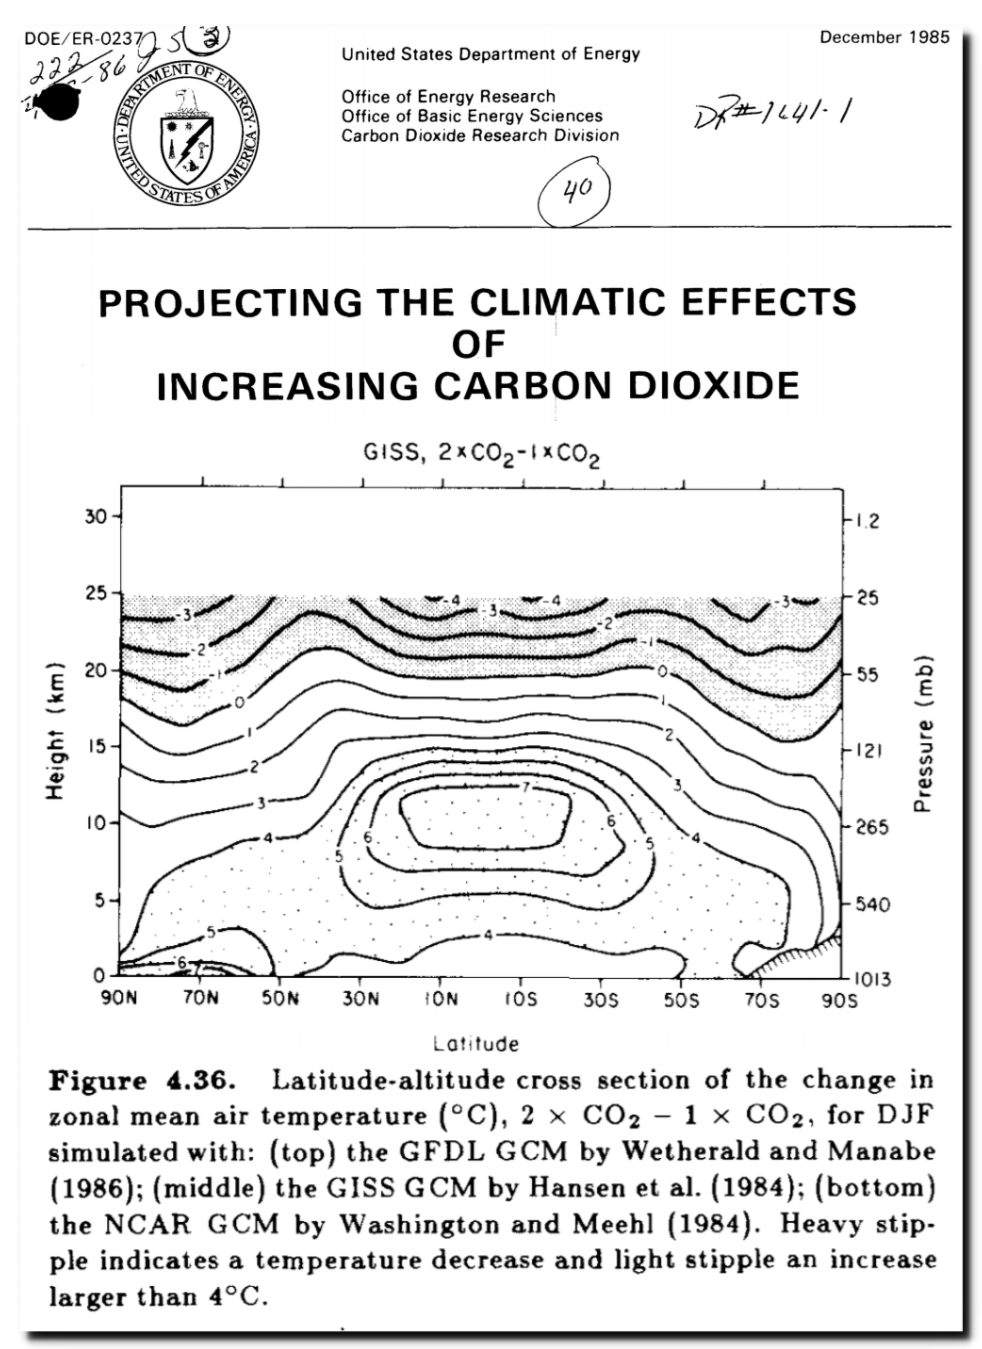 https://doi.org/10.2172/5885458
It didn’t happen, and tropical troposphere temperatures measured by satellites are not much different than they were 40 years ago.
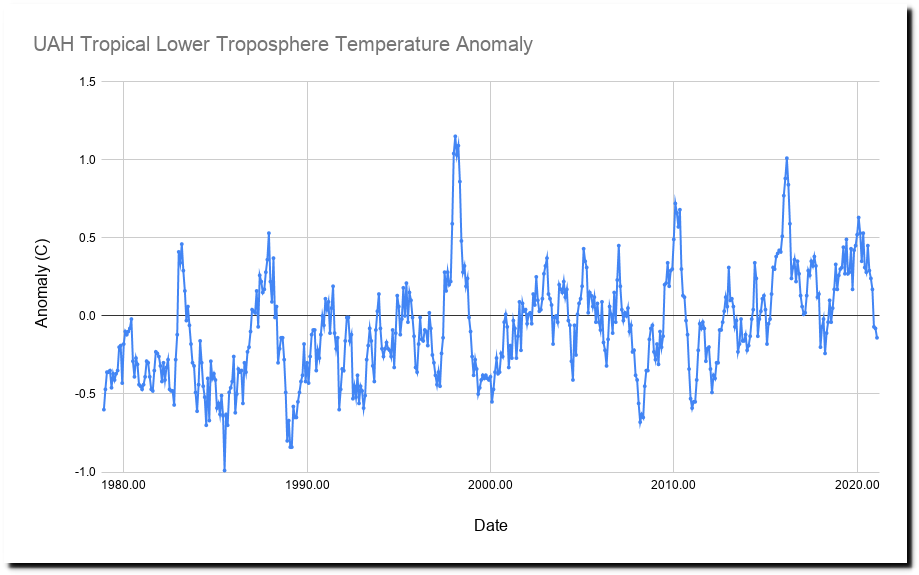
https://www.nsstc.uah.edu/data/msu/v6.0/tlt/uahncdc_lt_6.0.txt
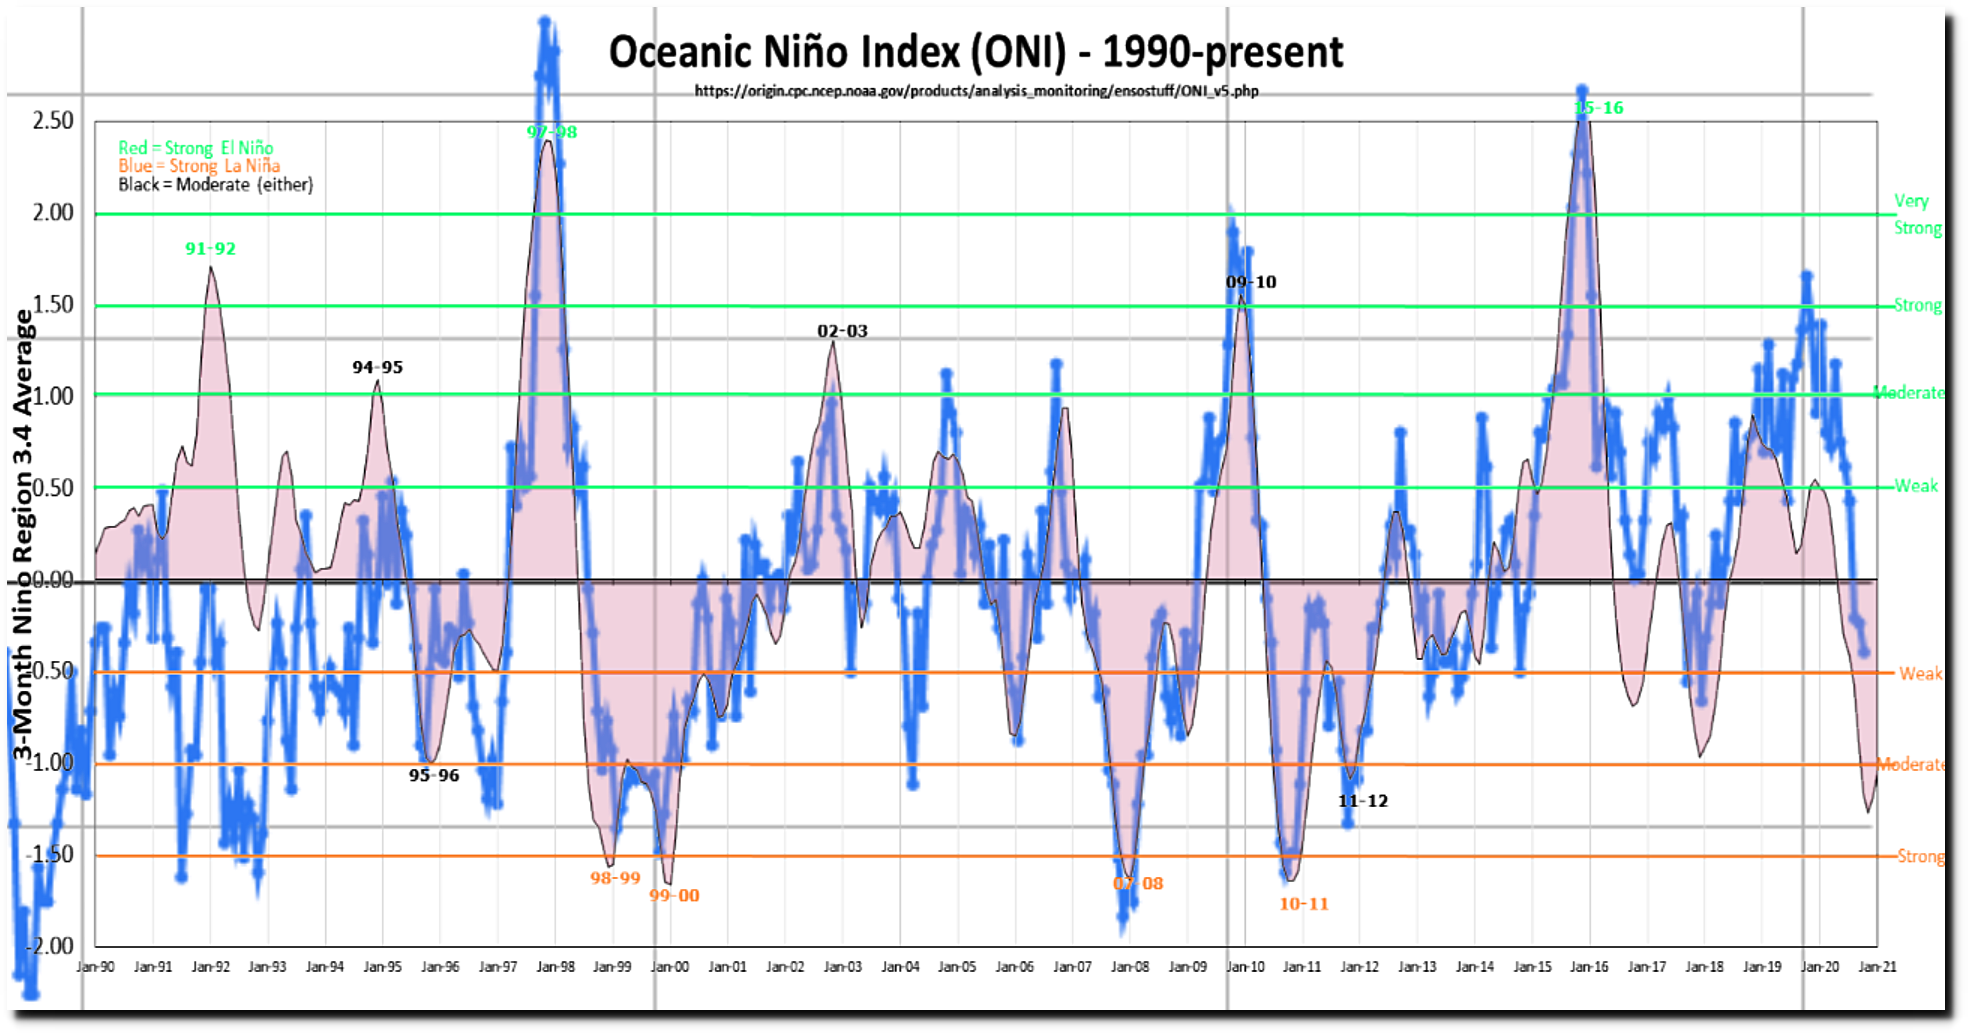
What actually controls variation in tropical troposphere temperatures are El Nino (warm) and La Nina (cold) events in the Pacific Ocean.
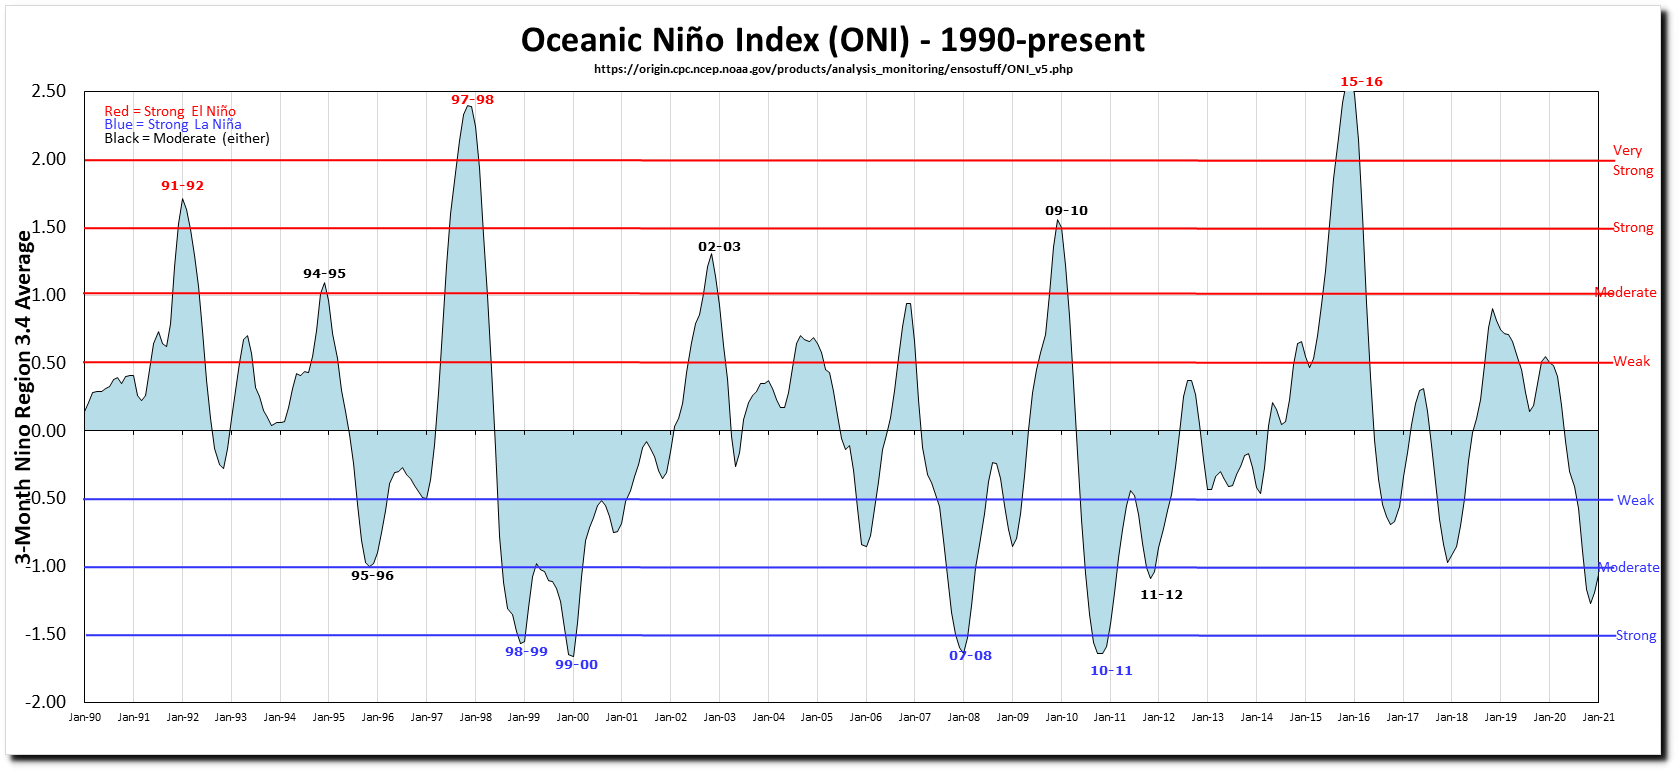
El Niño and La Niña Years and Intensities
This graph overlays the ENSO graph above in pink, on top of the satellite temperatures. The correlation with ENSO is quite good, and it shows little or no correlation with CO2.
Hansen has no clue what he is talking about, but he also controlled the temperature data – so he was able to tamper with it to make it appear like he was correct.
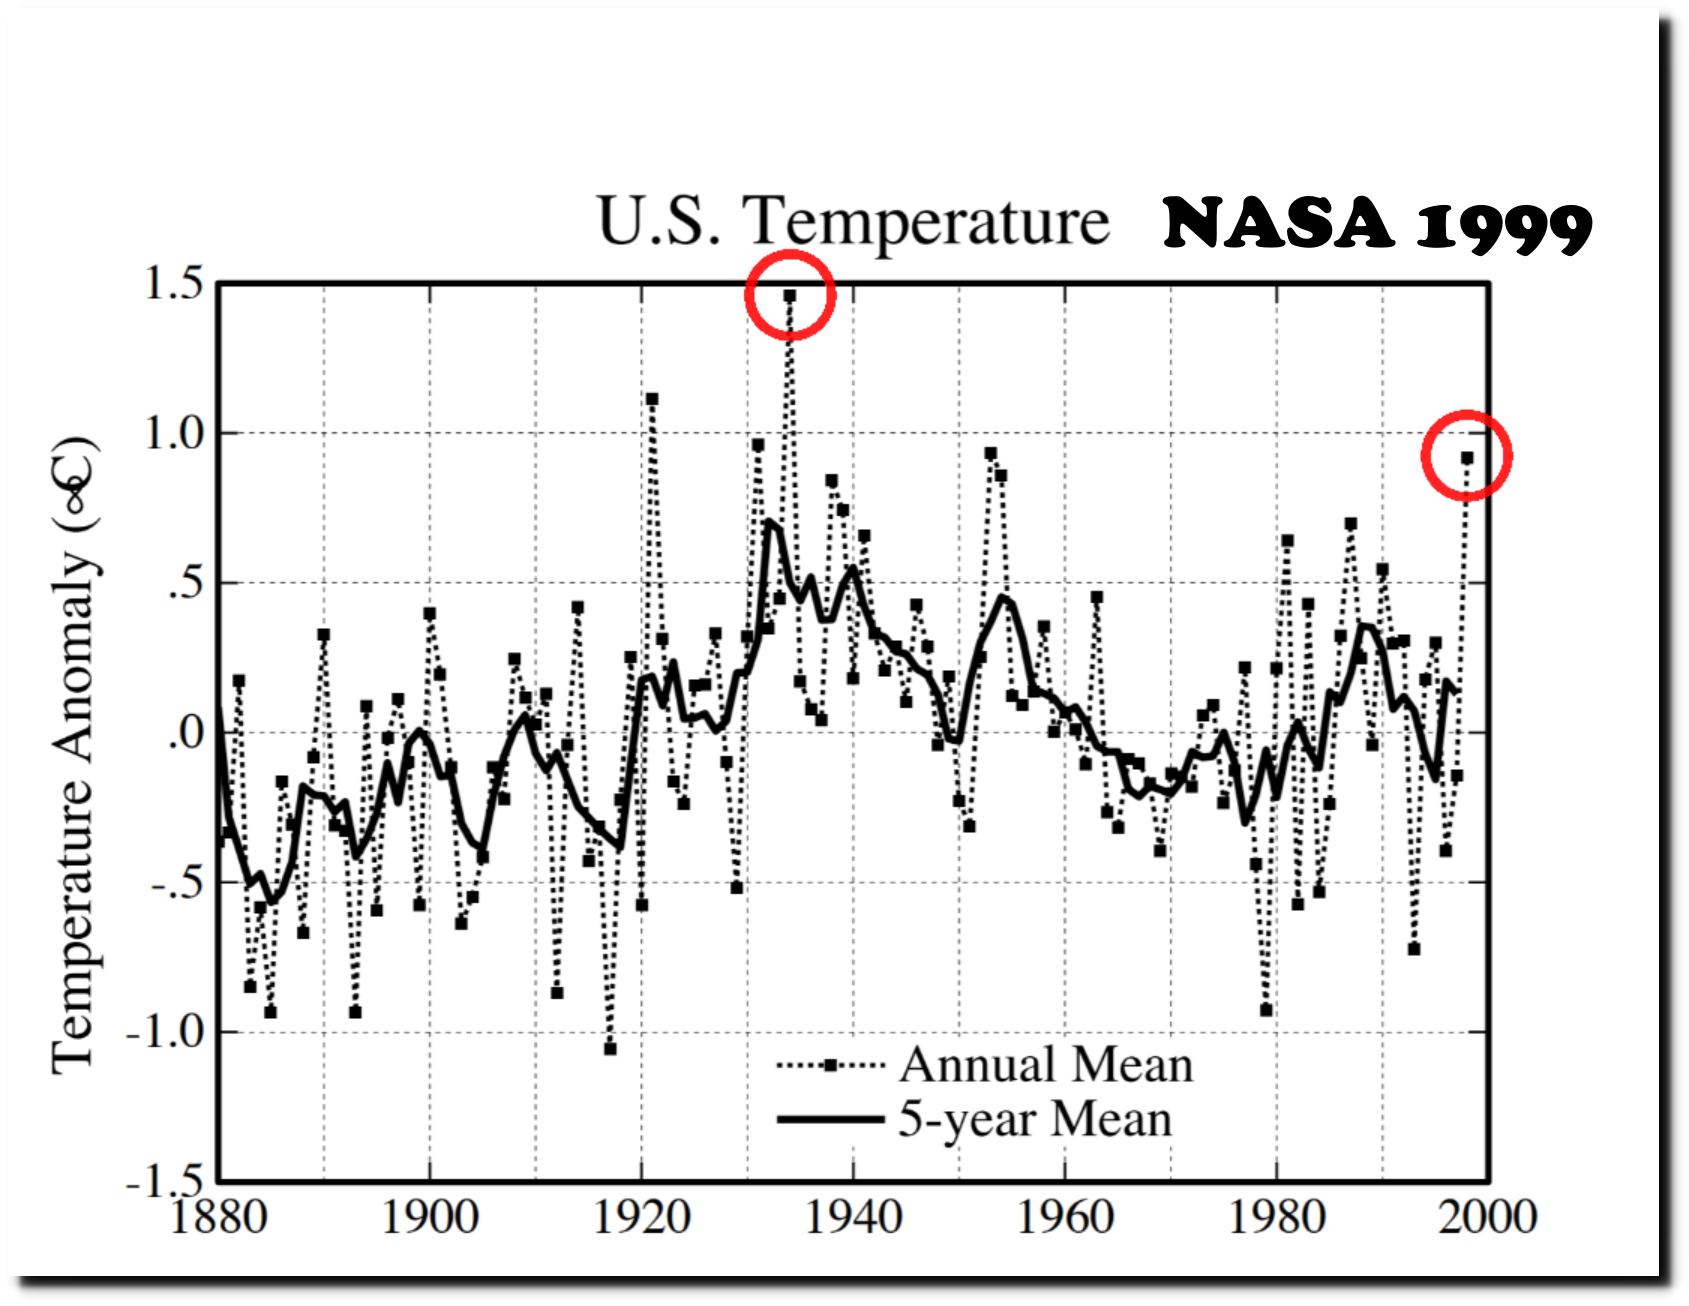
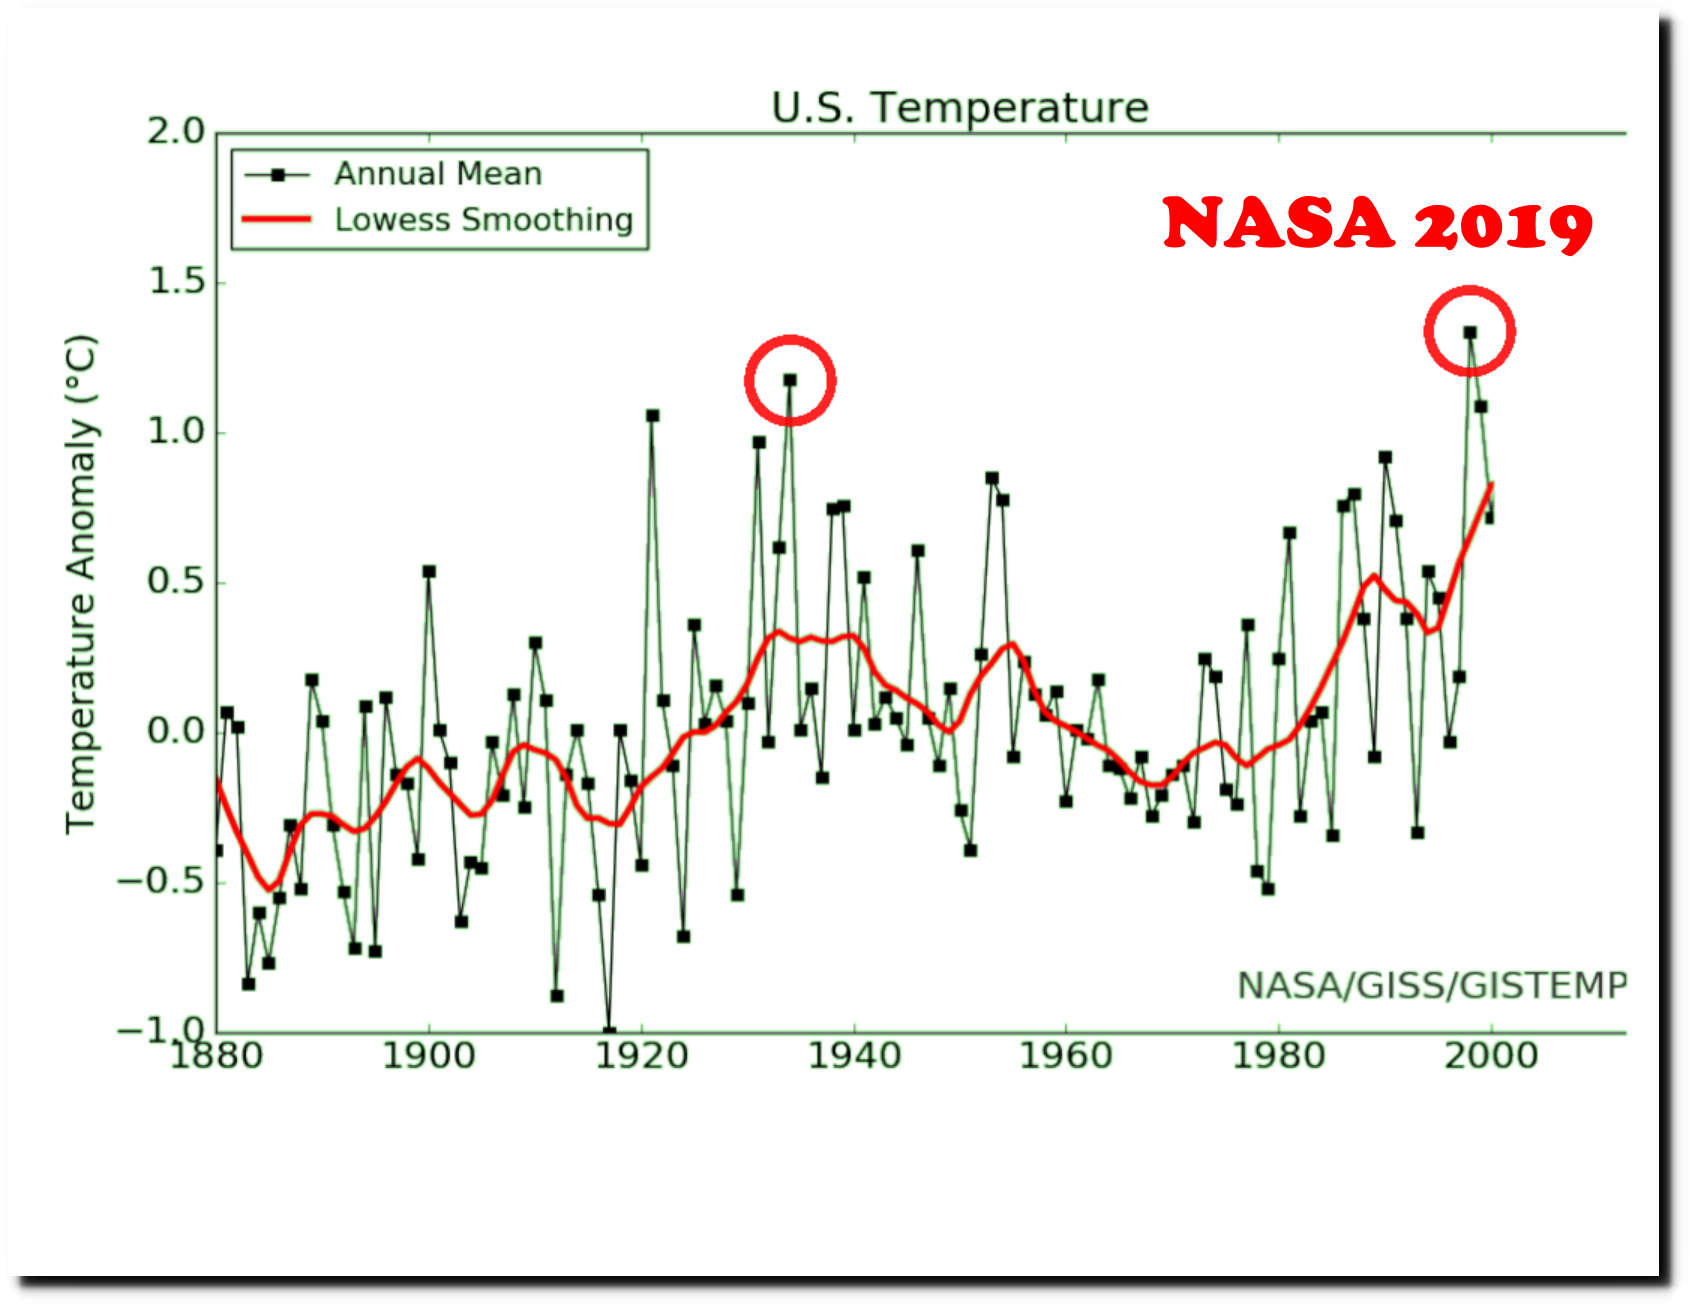
Here is an animation showing how the data has been altered over the past 20 years.
