
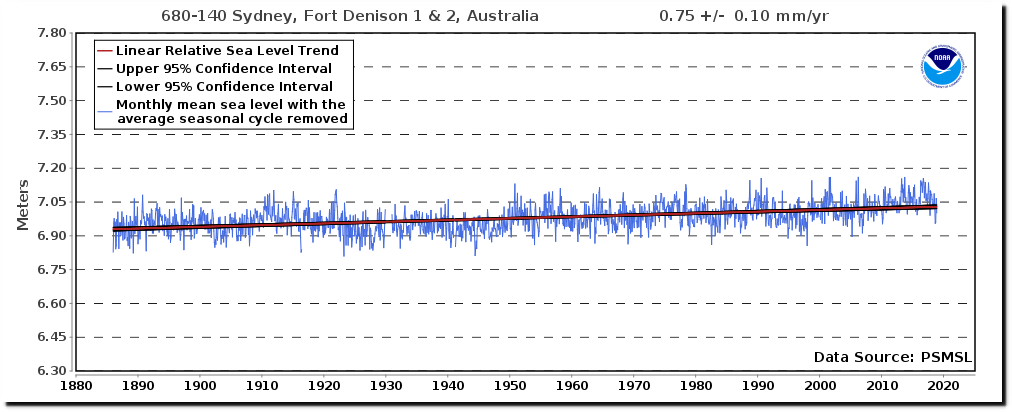
The NASA sea level web page shows that sea level rose very slowly from 1950 until the early 1990s (about 0.75 mm/year) – and then rise rates more than quadrupled since the early 1990s to more than 3 mm/year.
Sea Level | Vital Signs – Climate Change: Vital Signs of the Planet
But three months ago, NASA showed sea level rising more than twice as fast from 1950 until the early 1990s (about 1.7 mm/year) – and about 2.6 mm/year since the early 1990s.
Sea Level | Vital Signs – Climate Change: Vital Signs of the Planet
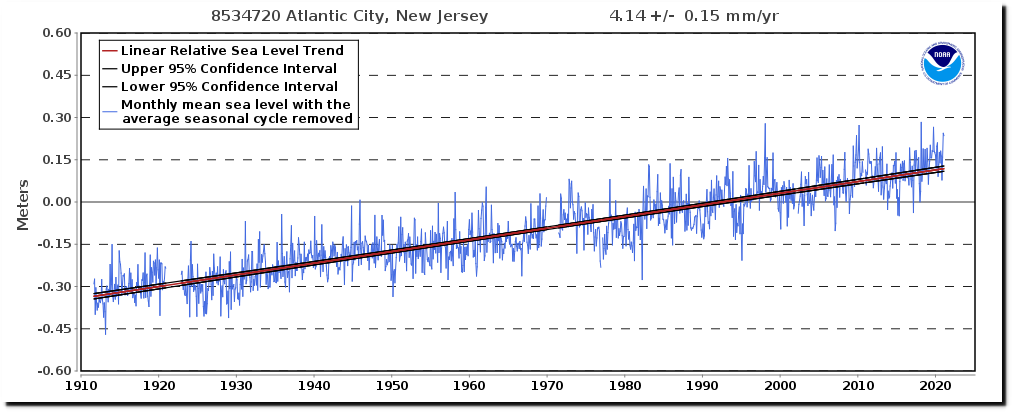
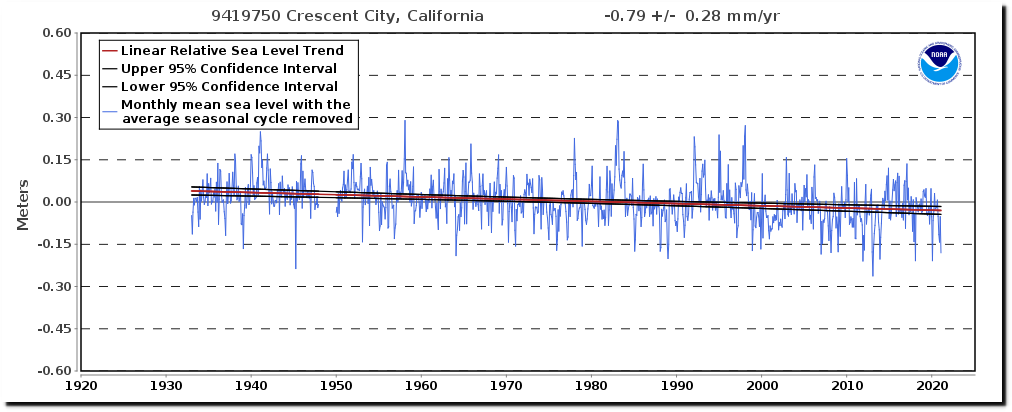
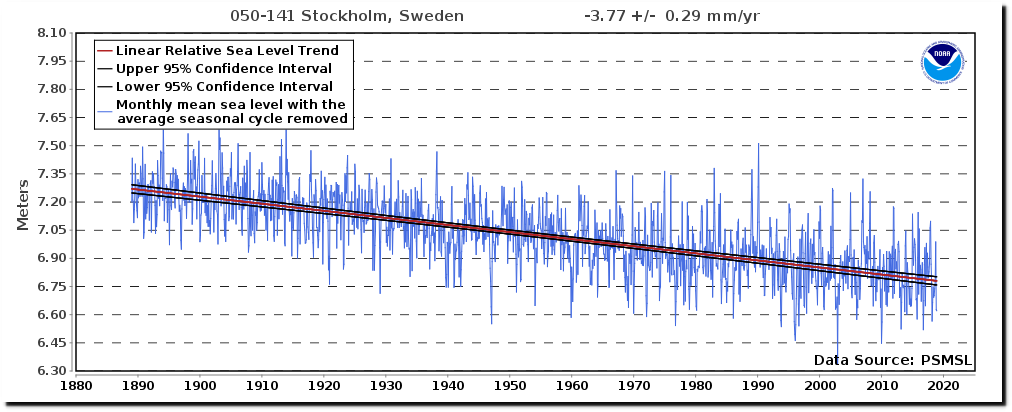
I can’t find any long term tide gauges which show any significant acceleration since 1990.
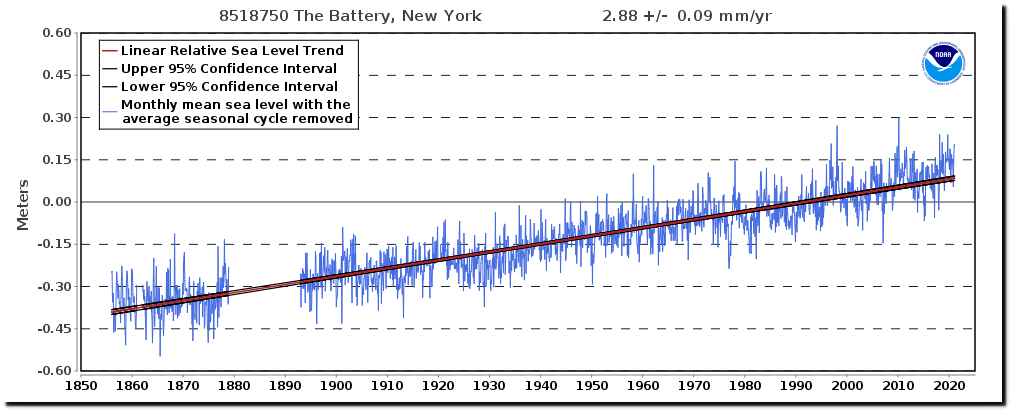
Sea Level Trends – NOAA Tides & Currents
Sea Level Trends – NOAA Tides & Currents
Sea Level Trends – NOAA Tides & Currents
Sea Level Trends – NOAA Tides & Currents
Sea Level Trends – NOAA Tides & Currents
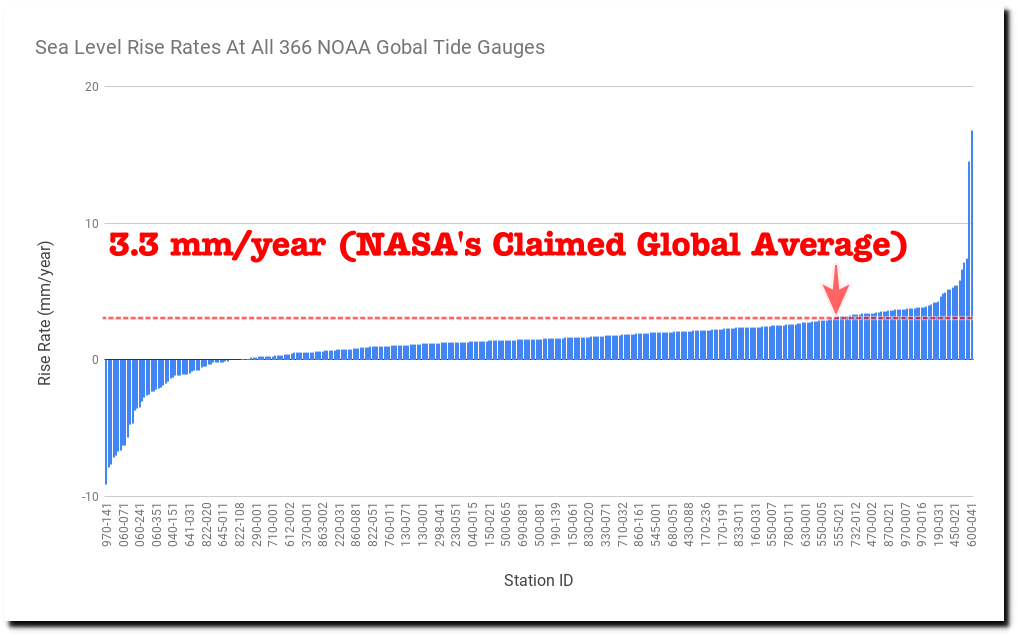
And more than 80% of NOAA tide gauges are below NASA’s claimed average of 3.3 mm/year.
Sea Level Trends – NOAA Tides & Currents
More stunning climate fraud from the current squatters in the White House. But there is more to this story. The NASA sea level graph shows rapid rise from 1920 to 1950 and then little sea level rise from 1950 to 1980.
Sea Level | Vital Signs – Climate Change: Vital Signs of the Planet
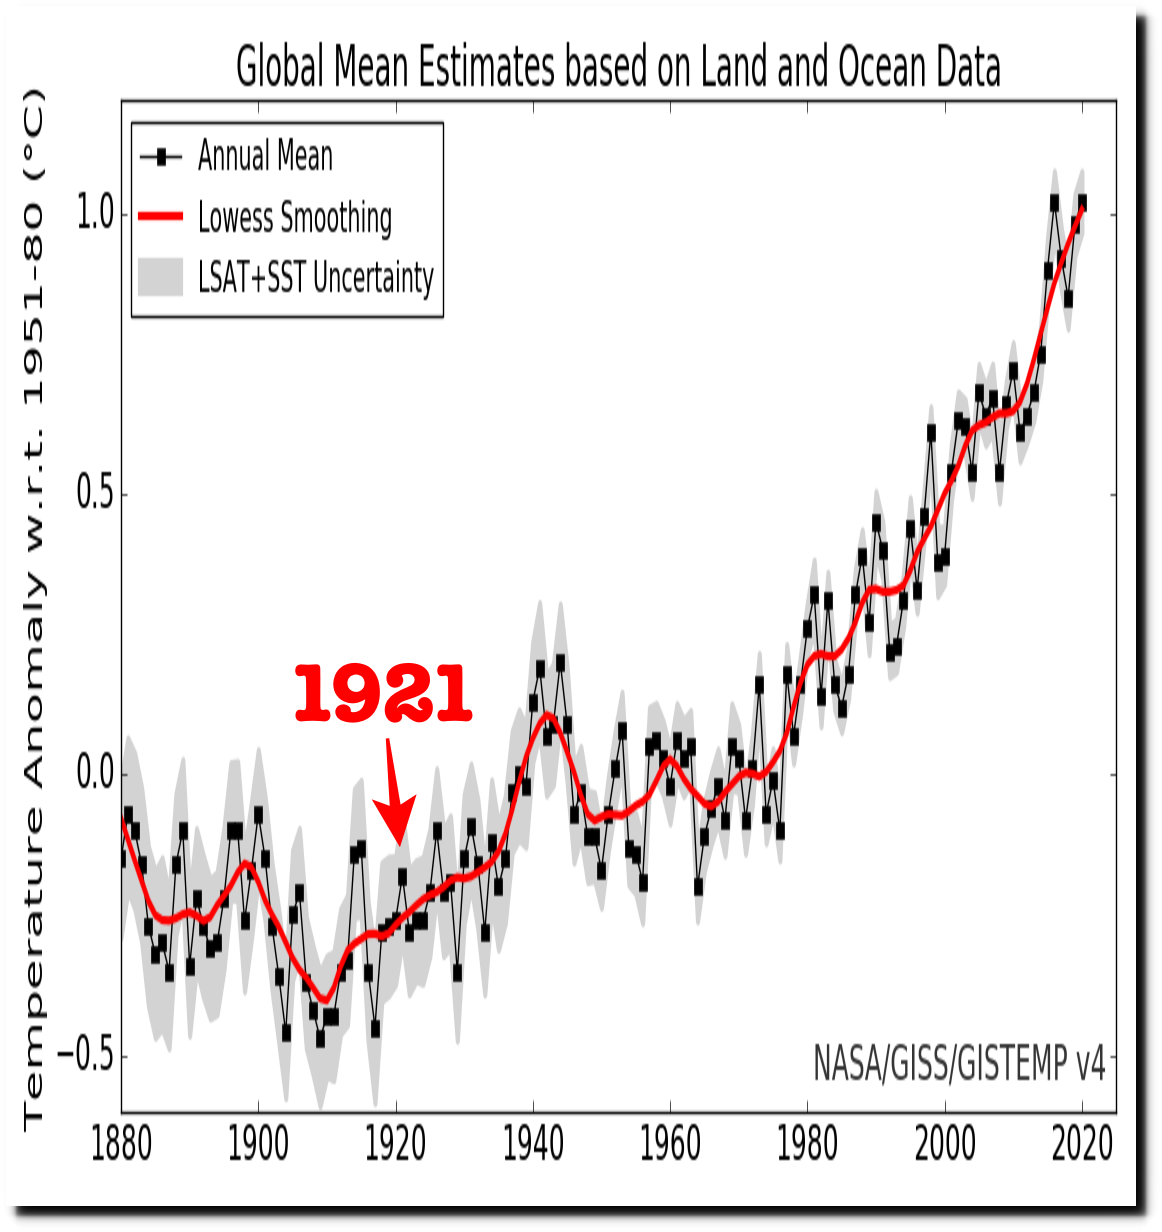
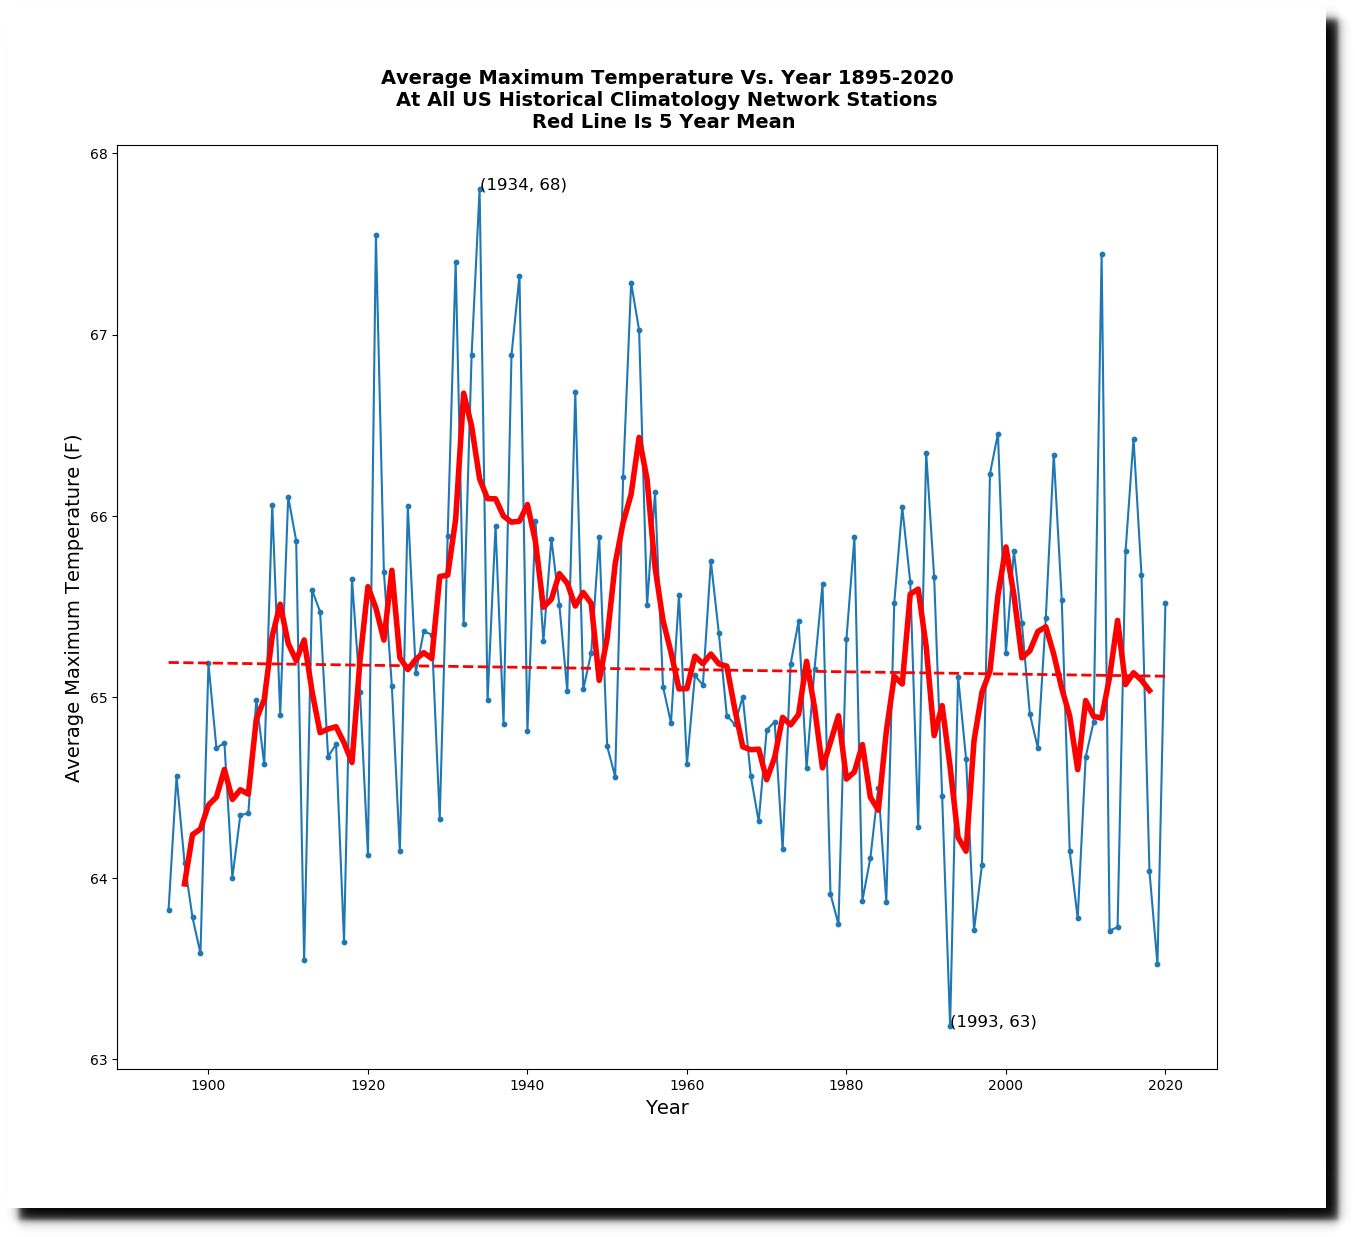
But NASA’s temperature graph shows 1920-1950 as being very cold with 1921 being one of the coldest years on record. Why would sea level be rising rapidly when temperatures are cold, and then rise rates slow down after 1950 when temperatures were warmer?
The NCAR graph from 1974 correlates much better with the sea level graph, because it shows rapid cooling after the 1940s.
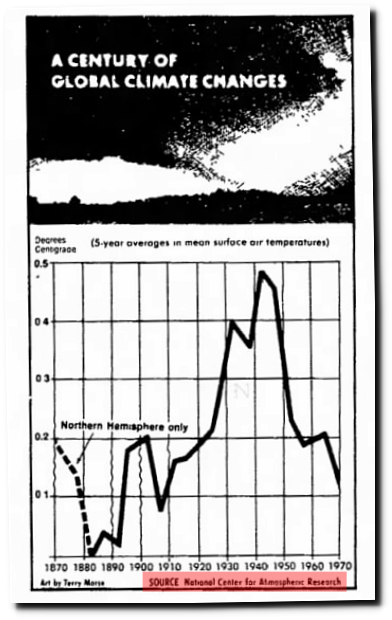
14 Jul 1974, Page 1 – Lincoln Evening Journal at Newspapers.com
NASA shows the year 1921 as being one of the coldest years on record, yet the historical record shows it as being one of the hottest.
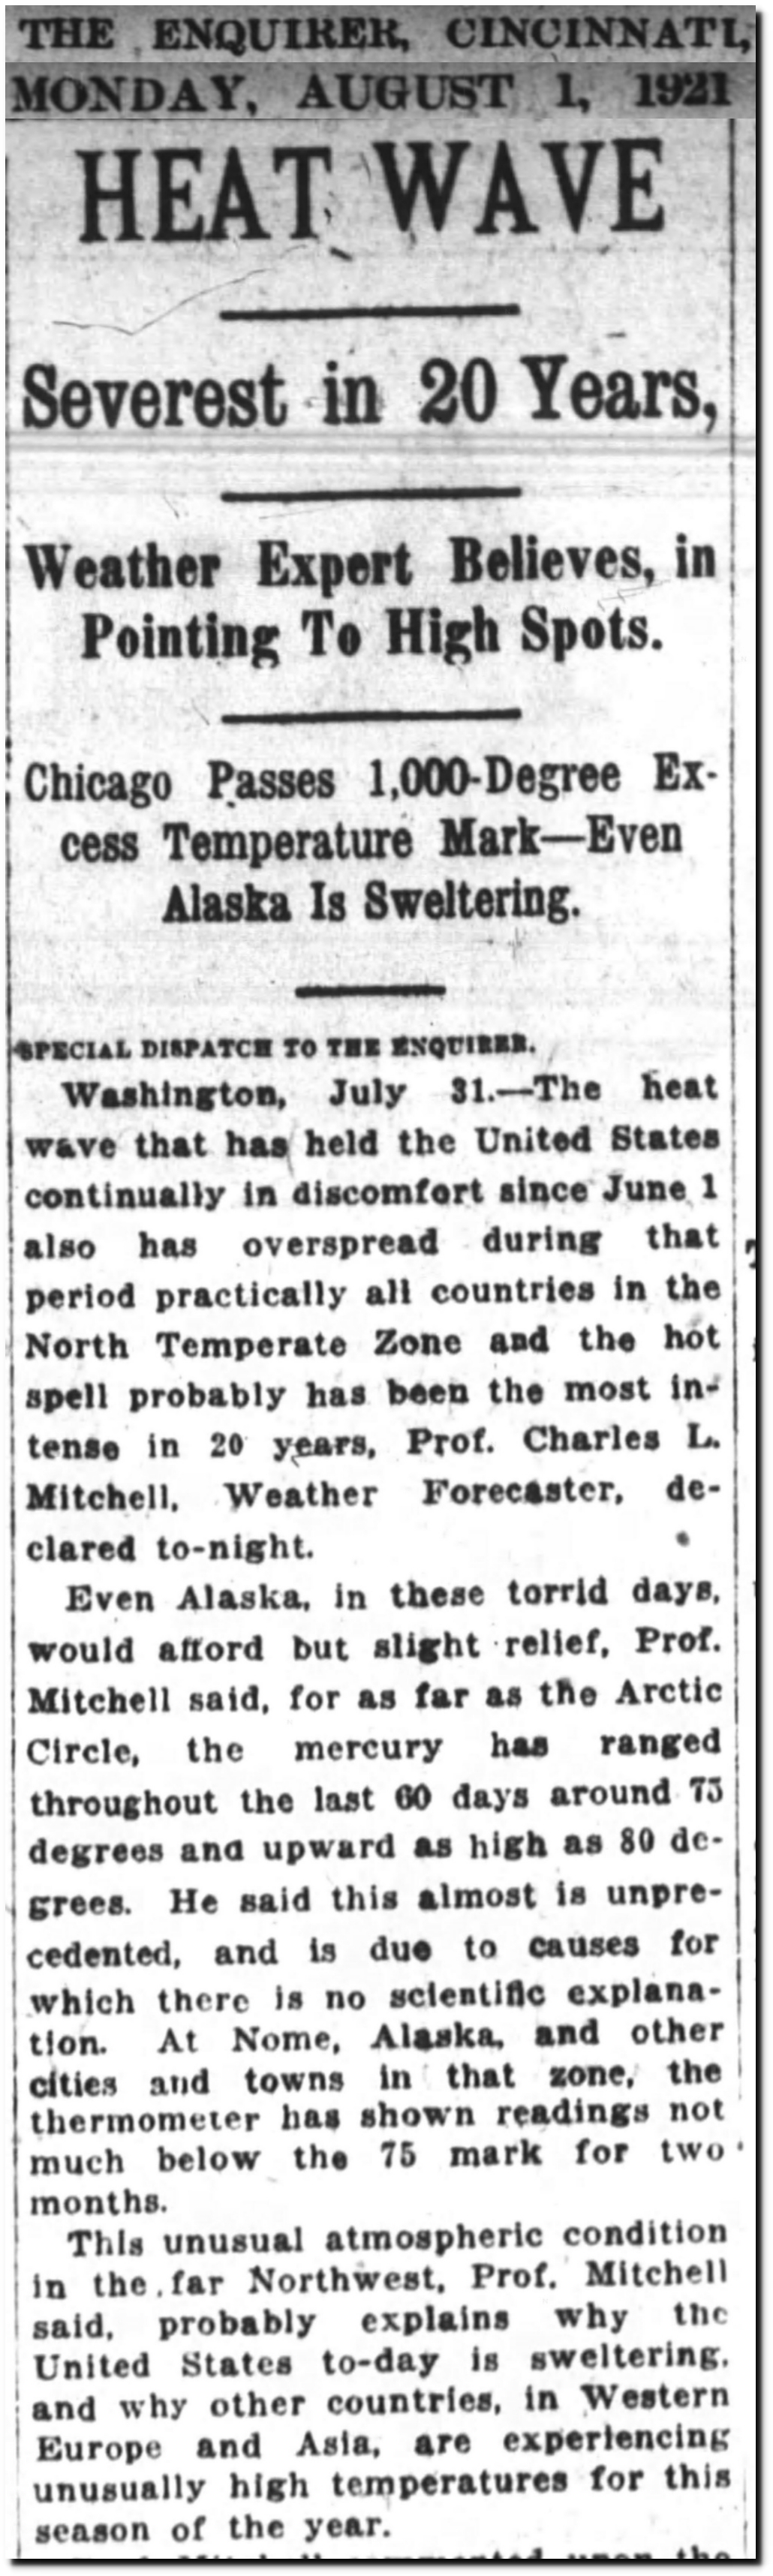
01 Aug 1921, Page 4 – The Cincinnati Enquirer at Newspapers.com
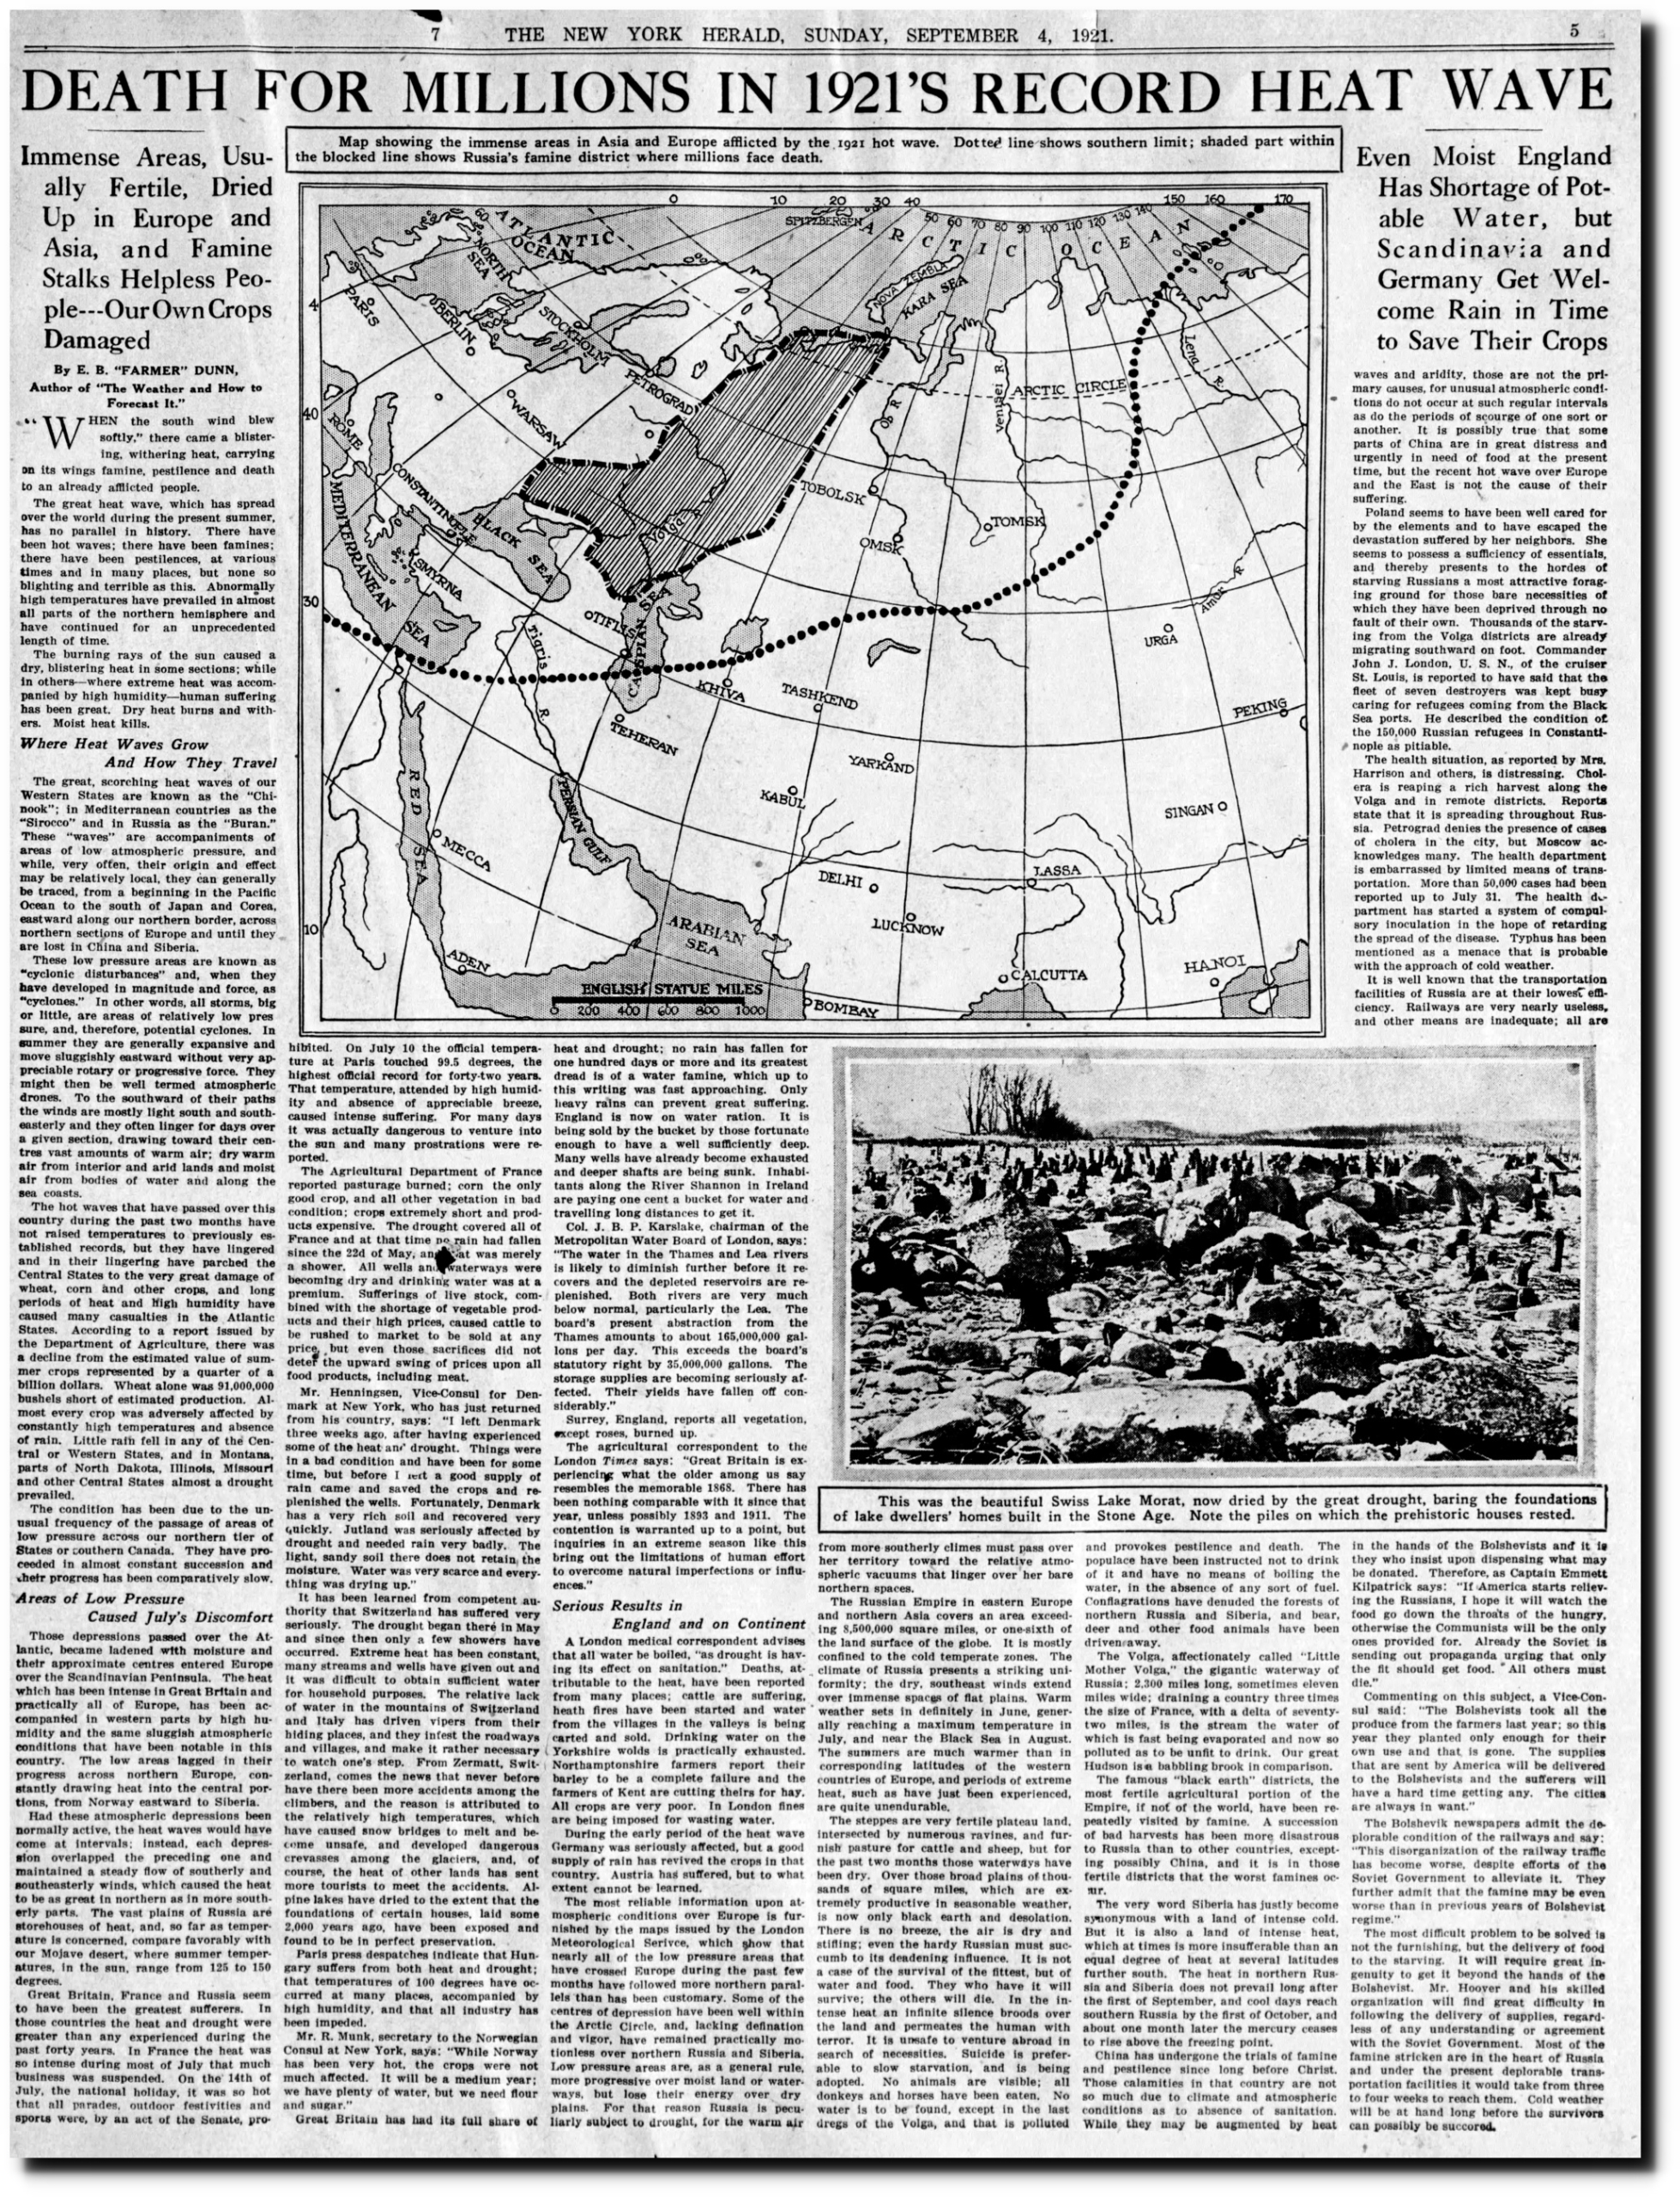
04 Sep 1921, 61 – New York Herald at Newspapers.com
The average daily maximum temperature in the US during 1921 was second highest on record.
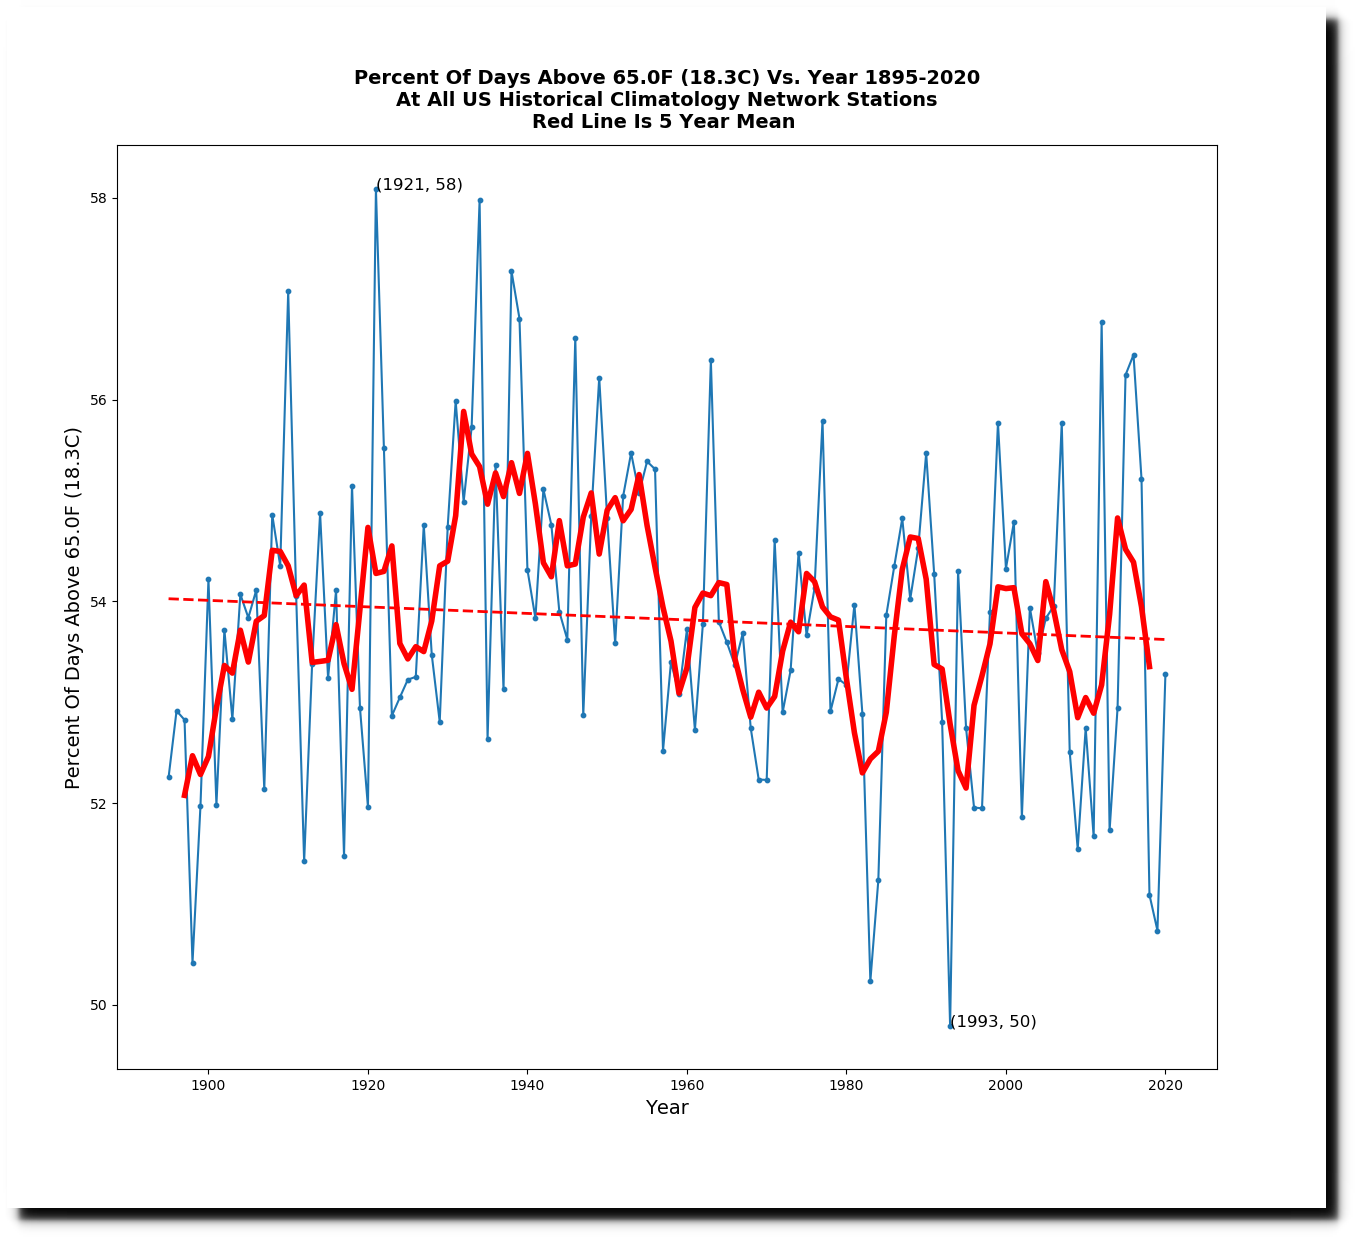
The percent of warm days in the US during 1921 was the highest on record, with 58% of days over 65F.
The ice between the North Pole and Alaska was “thin and rotten.”
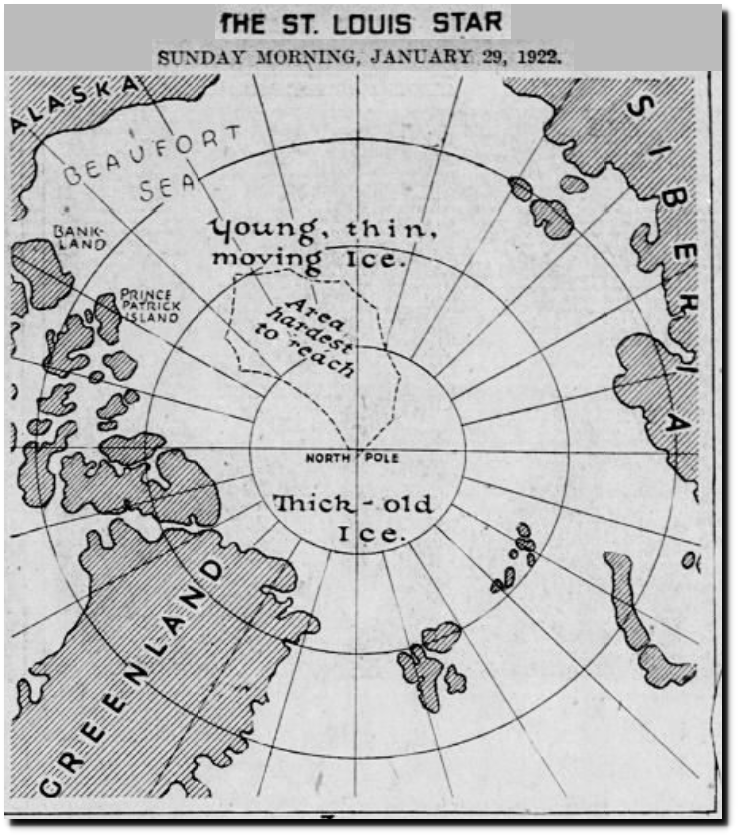
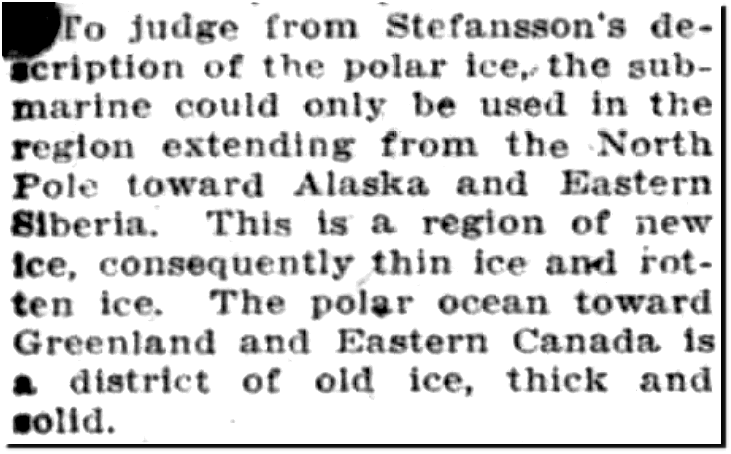
29 Jan 1922, Page 35 – The St. Louis Star and Times at Newspapers.com
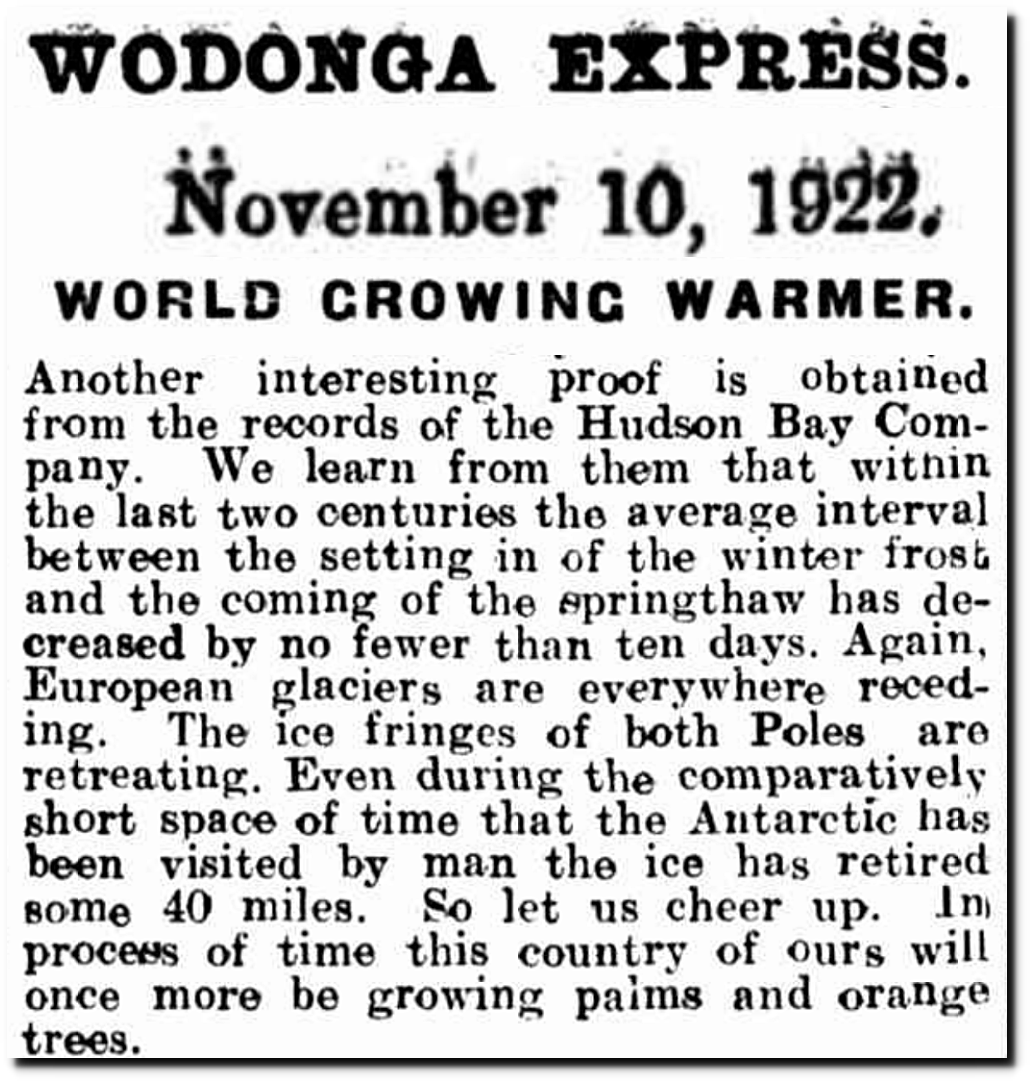
10 Nov 1922 – WORLD CROWING WARMER. – Trove
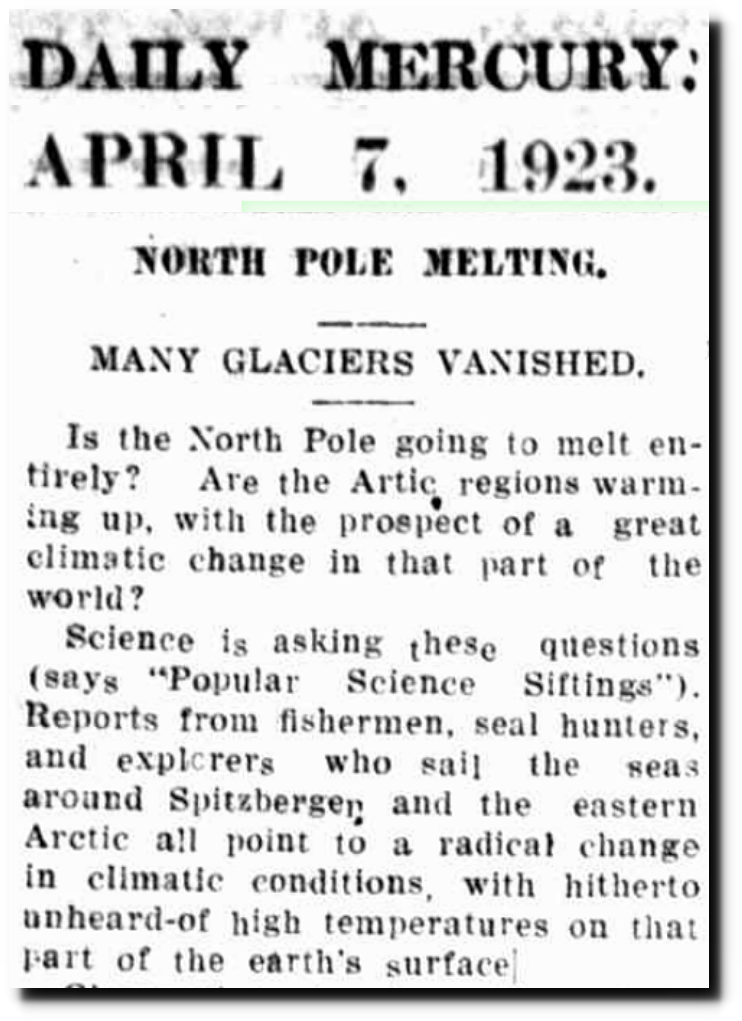
07 Apr 1923 – NORTH POLE MELTING. – Trove

TimesMachine: February 25, 1923 – NYTimes.com
Glacier National Park was melting fast and predicted to be ice free by 1948.
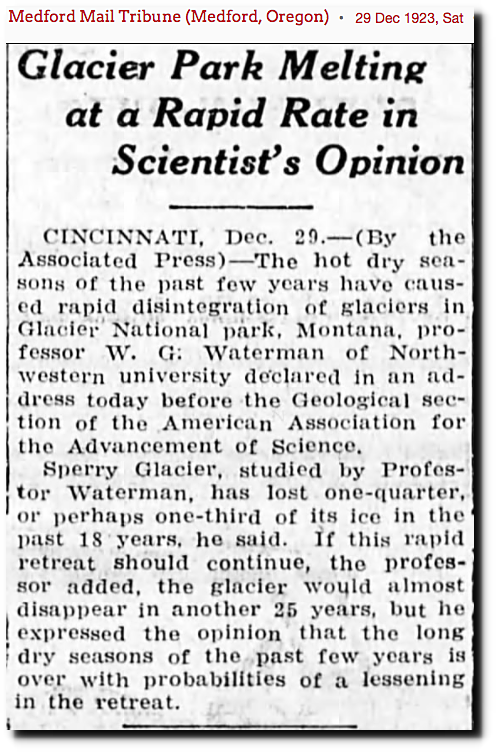
29 Dec 1923, Page 5 – at Newspapers.com
Australia had the world record heatwave in 1923-1924.
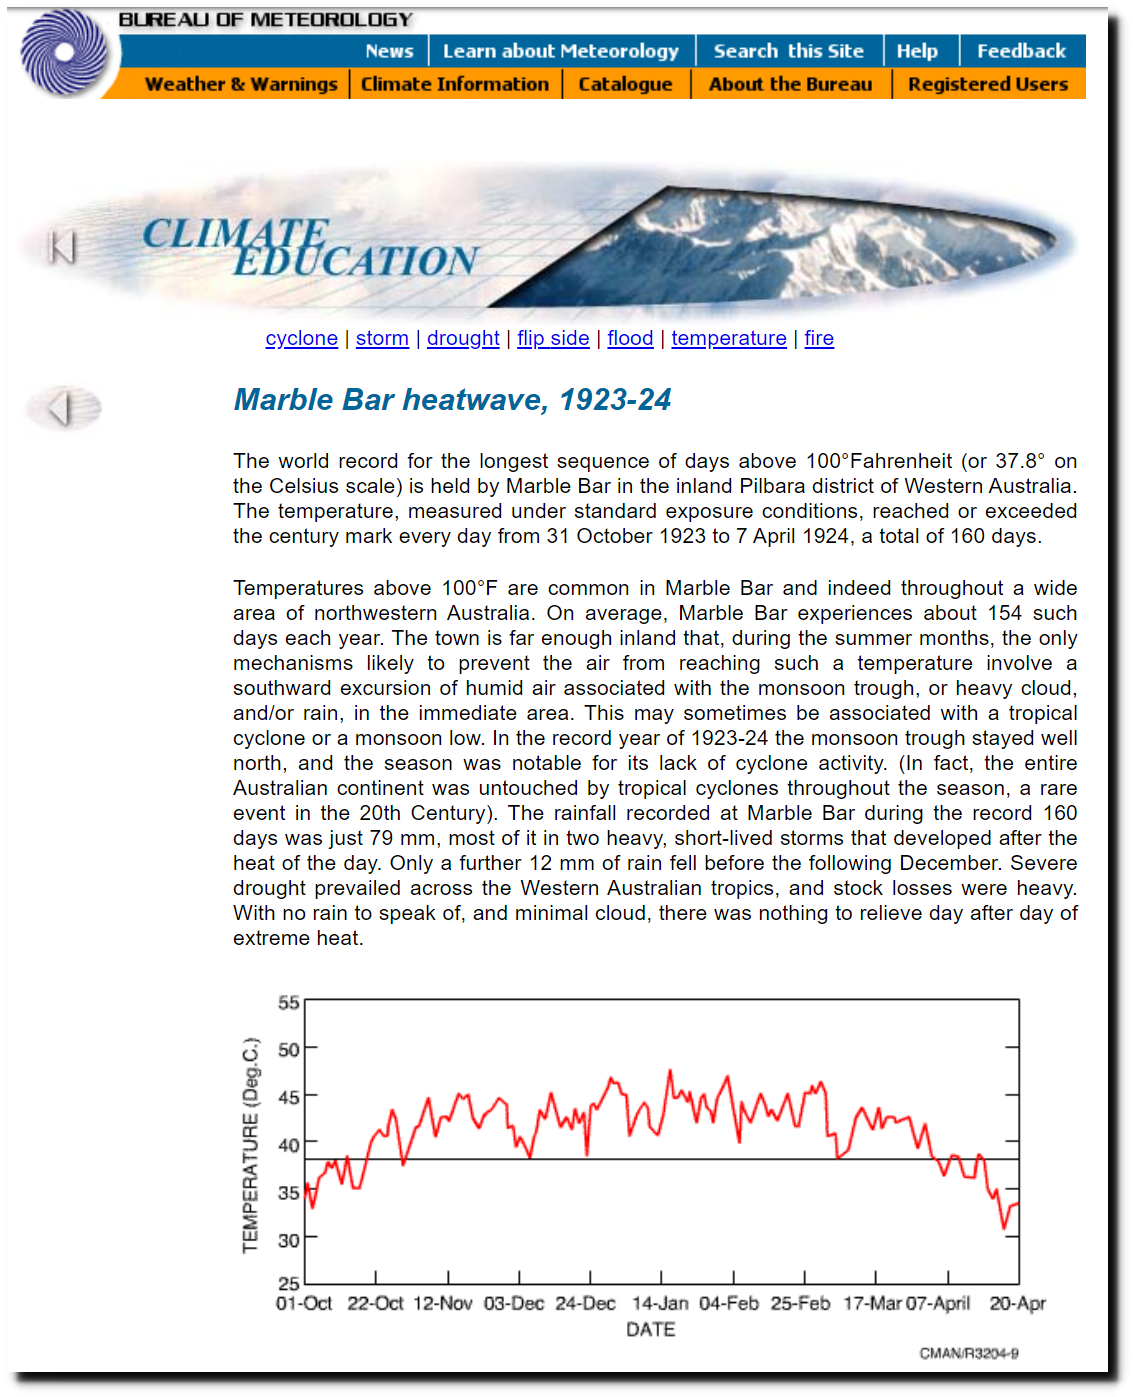
BOM – Australian Climate Extremes
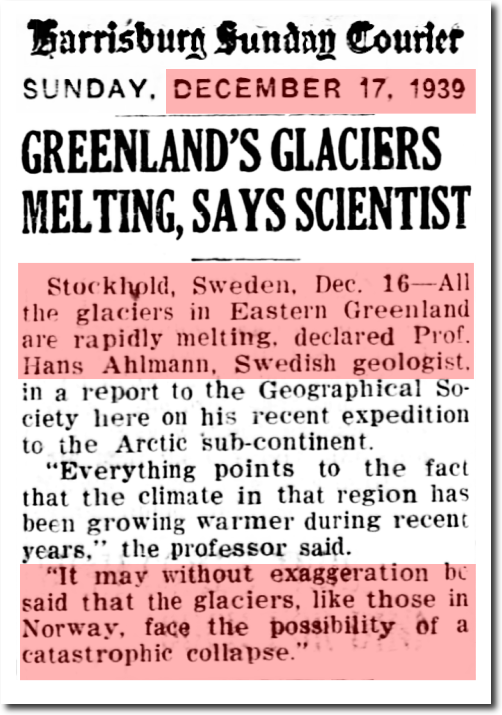
17 Dec 1939, Page 15 – Harrisburg Sunday Courier at Newspapers.com
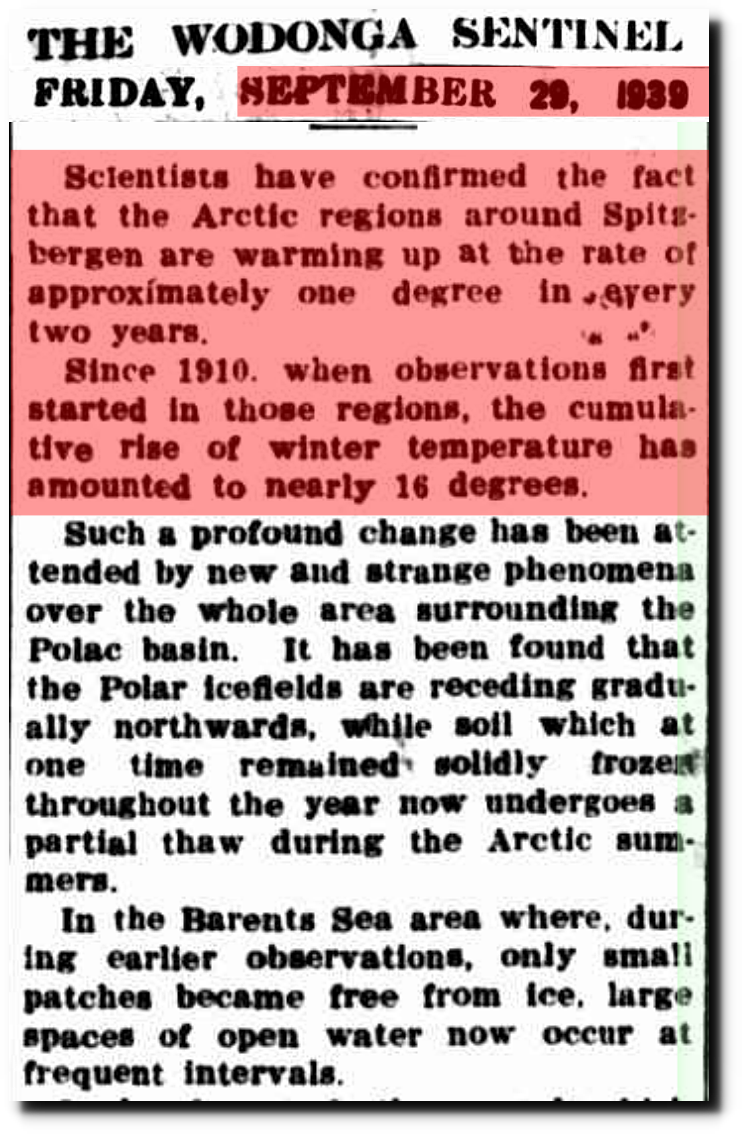
29 Sep 1939 – What is The World Coming To? – Trove
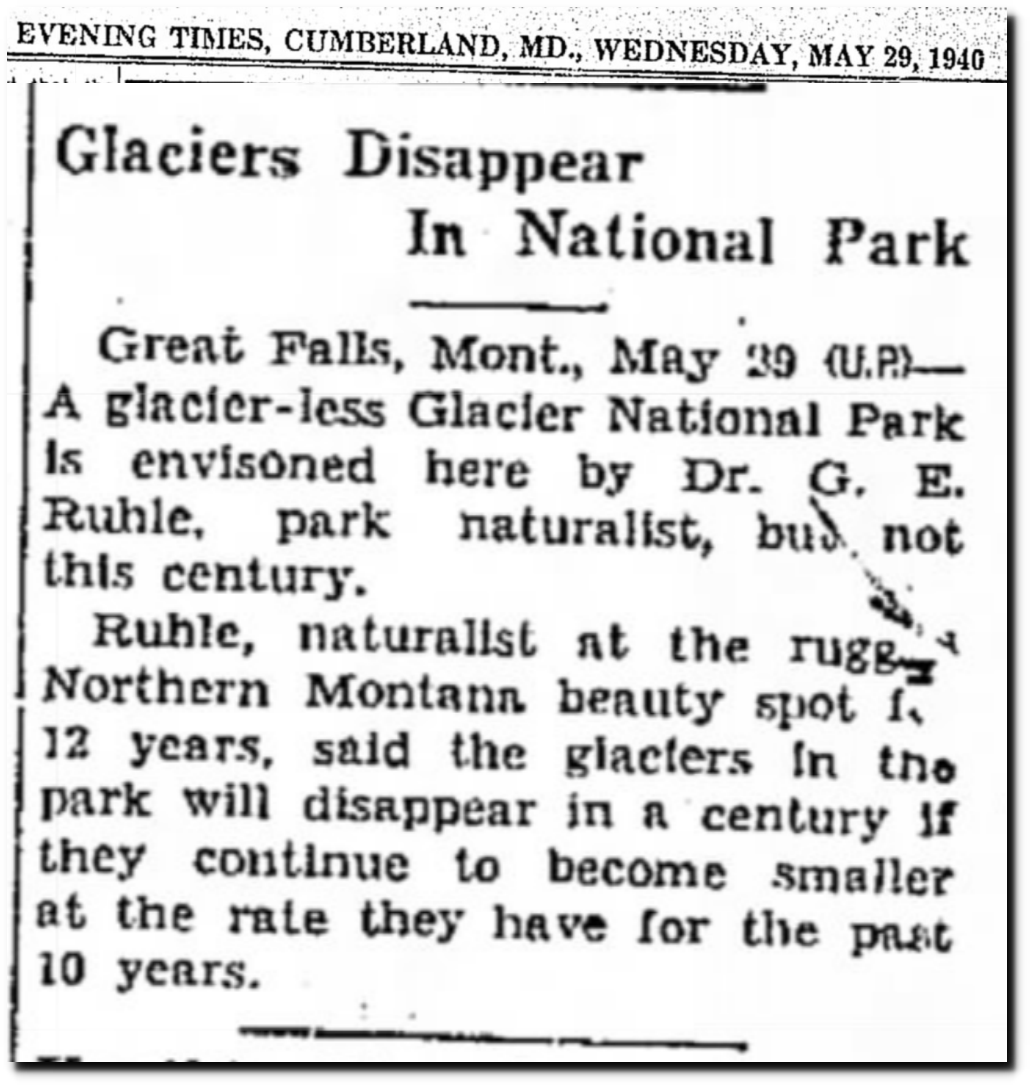
29 May 1940, Page 14 – Cumberland Evening Times at Newspapers.com
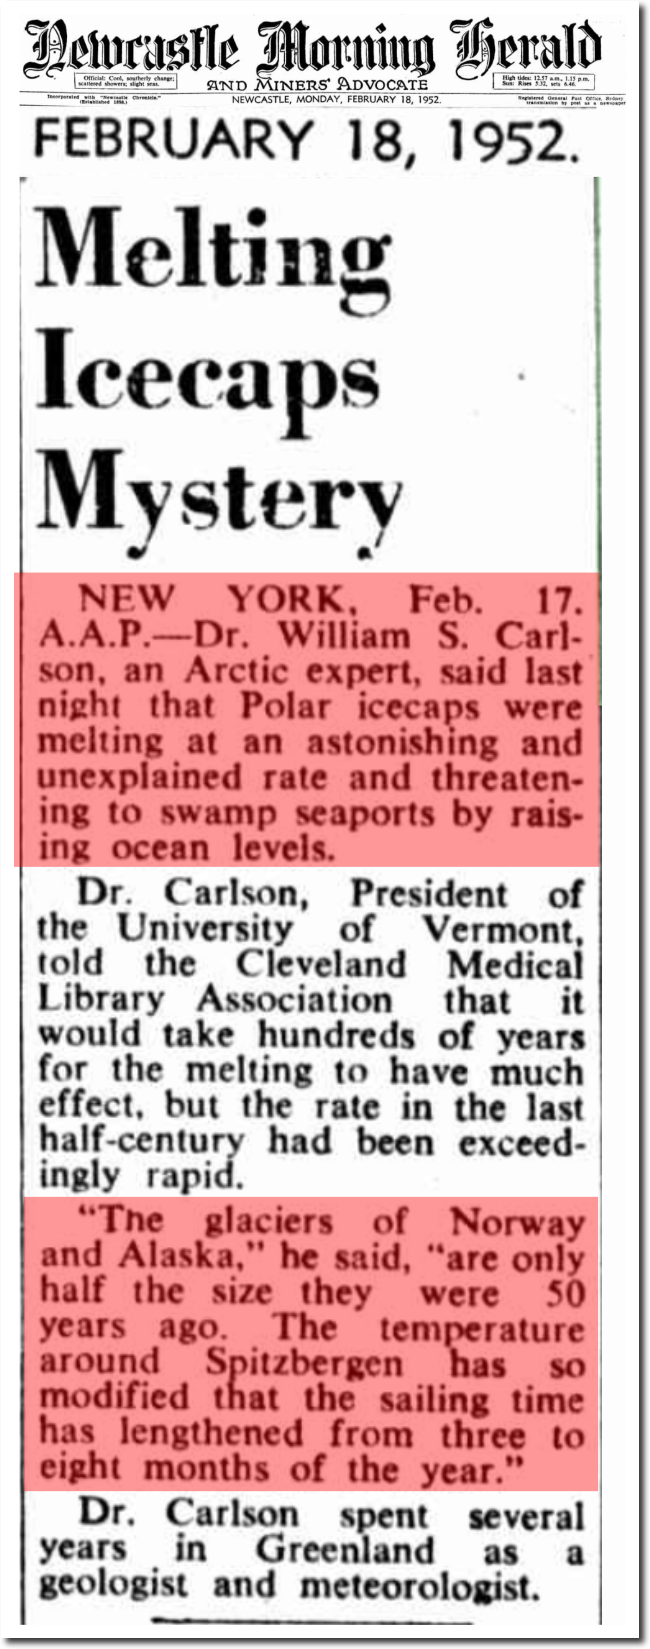
18 Feb 1952 – Melting Icecaps Mystery – Trove

31 May 1947 – MELTING ICE CAP DANGER – Trove
Why were glaciers rapidly melting and sea level rising quickly at a time when NASA claims temperatures were very cold?
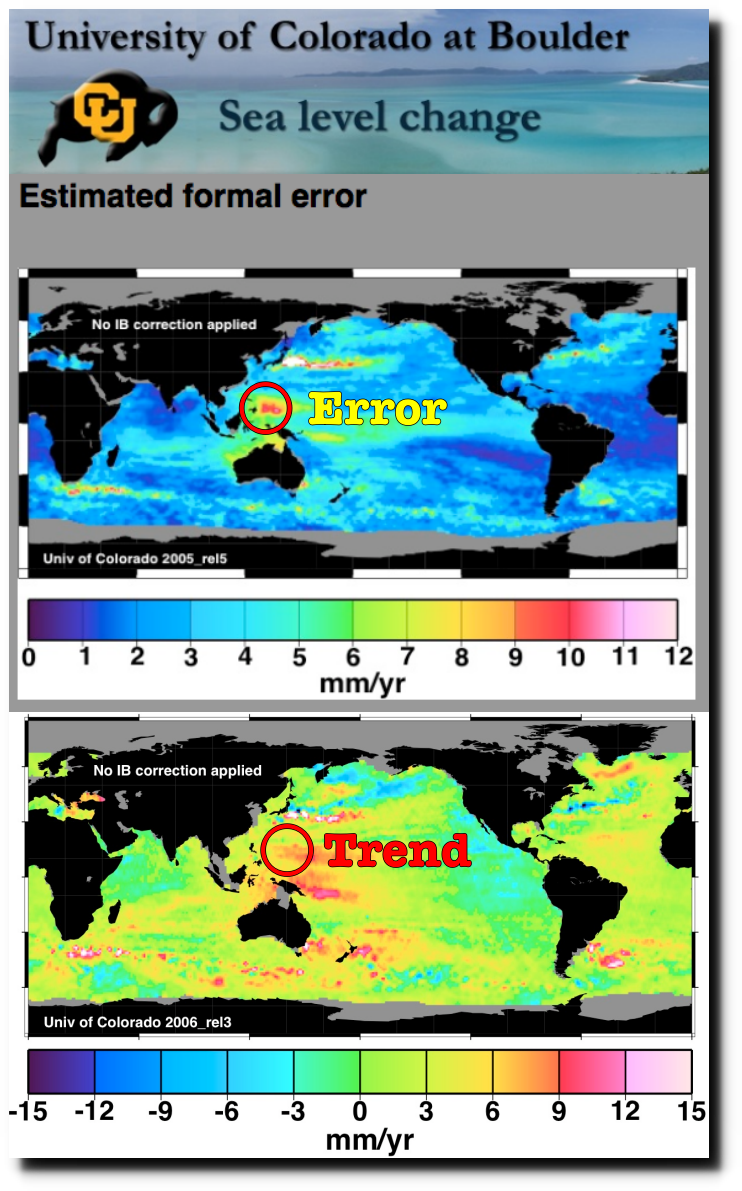
The sea level data has been altered by the Harris administration to make it look like rise rates quadrupled right when satellites started being used. But satellite data is equally as useless. The ocean surface is very rough, satellite orbits decay, and satellite measurements frequently have an error nearly as large as the trend.
Even worse, they add in 0.3 mm/year for a global isostatic adjustment (GIA) to the satellite record. This is done because the sea floor is sinking in response to glacial rebound after the end of the last ice age.
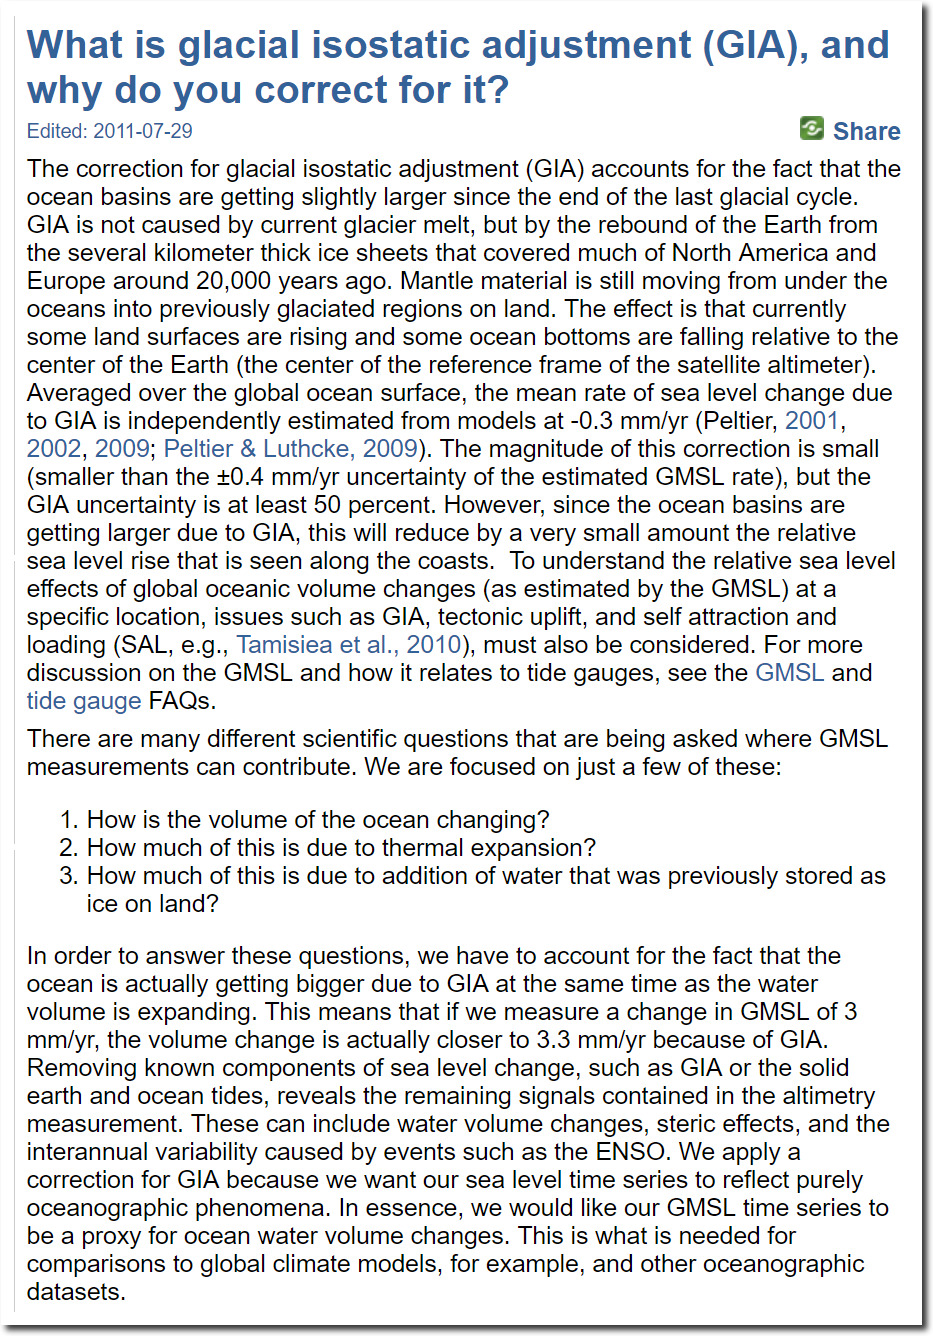
GIA would be relevant if you were calculating properties like ocean depth or ocean volume which can’t be directly measured, but it has no validity for sea level – which is directly measured and is essentially the distance from the center of the earth. The only justification to make any adjustment to sea level would be to account for measurement error – and GIA has nothing to do with measurement error. A sinking ocean floor lowers sea level, not raises it. And if they are going to use GIA, they would need to add it to the tide gauge data too.
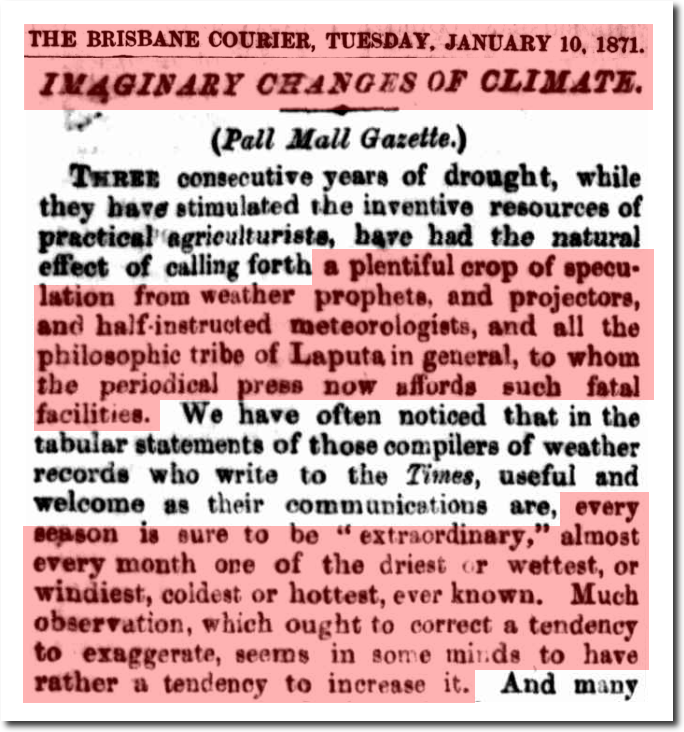
There is nothing new about this fraud.
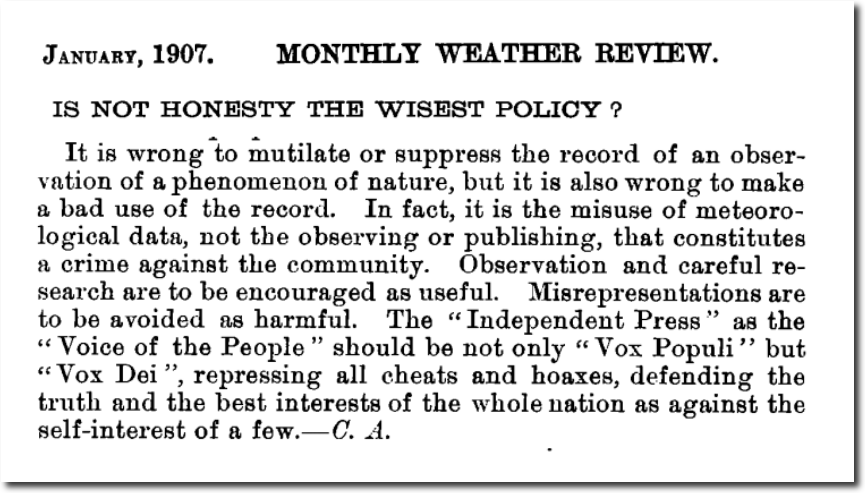
IS NOT HONESTY THE WISEST POLICY
It is wrong to mutilate or suppress the record of an observation of a phenomenon of nature, but it is also wrong to make a bad use of the record. In fact, it is the misuse of meteorological data, not the observing or publishing, that constitutes a crime against the community. Observation and careful research are to be encouraged as useful. Misrepresentations are to be avoided as harmful.
The “Independent Press” as the “Voice of the People” should be not only “Vox Populi” but “Vox Dei “, repressing all cheats and hoaxes, defending the truth and the best interests of the whole nation as against the self-interest of a few.
