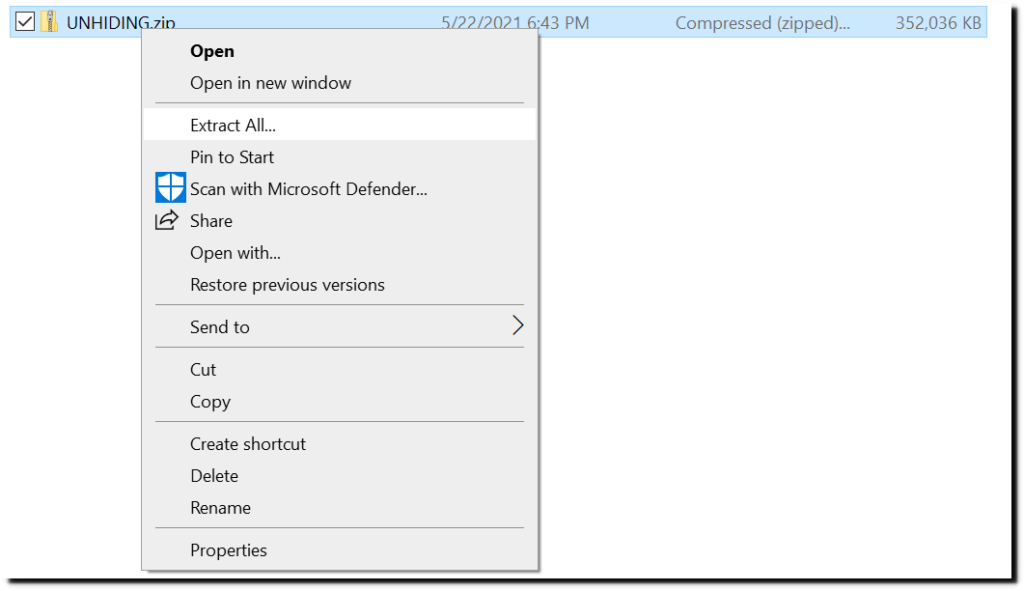
I have released a new version of the Unhiding The Decline climate graphing software. Download UNHIDING.zip from this link and unzip it. This will create a directory structure UNHIDING\UNHIDING\ghcnd_hcn\output
Open up a command prompt window in the UNHIDING directory which the unzip created, and enter these commands.
cd UNHIDING\ghcnd_hcn .\ghcn.exe US.list months=05
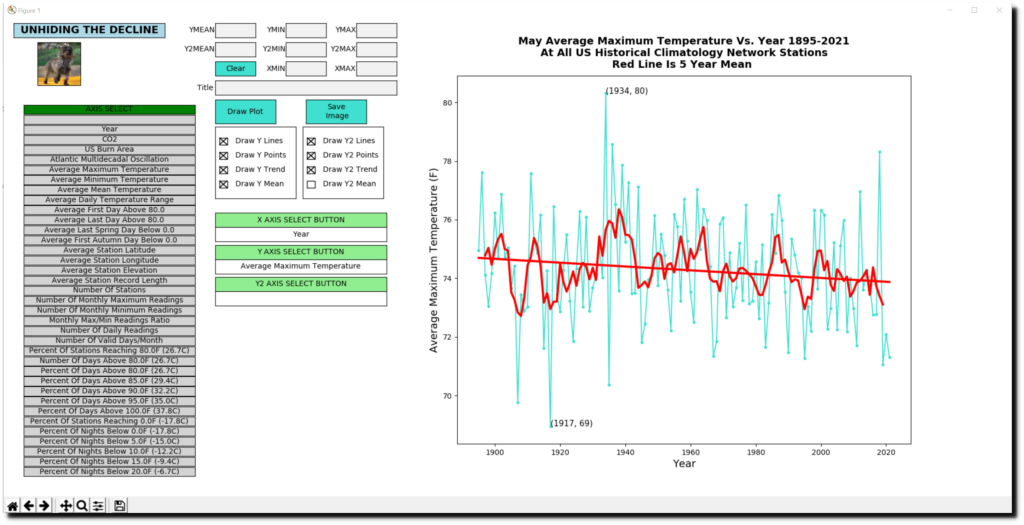
Wait a few minutes and if things are working correctly, this window will pop up.
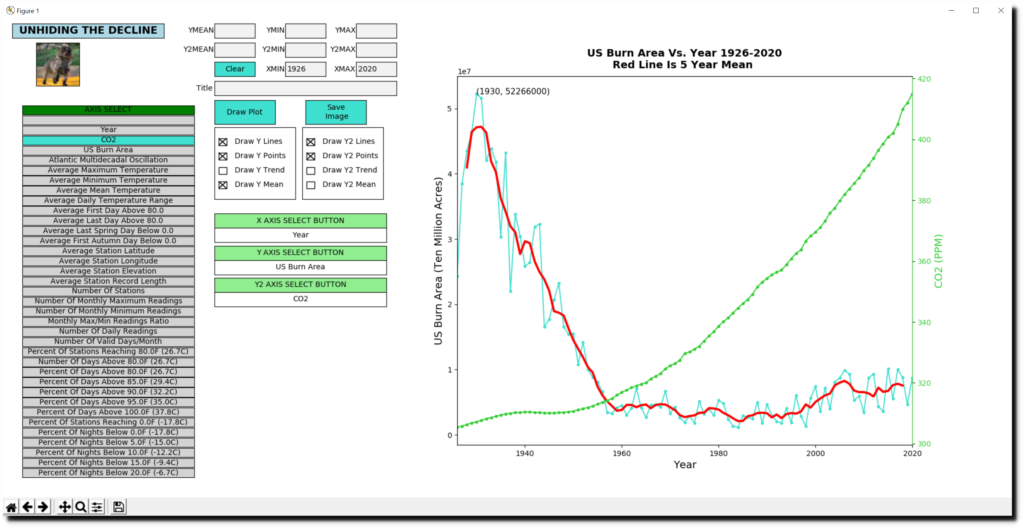
If you have used my earlier version, you will notice that the UI has changed. You can now plot two different graphs, Y and Y2. The graph below plots US Burn Area on Y, and atmospheric CO2 on Y2.
To create the graph above :
- Click on the Y AXIS SELECT button
- Click on US Burn Area in the grey box at left
- Click on the Y2 AXIS Select Button
- Click on CO2 in the grey box at left
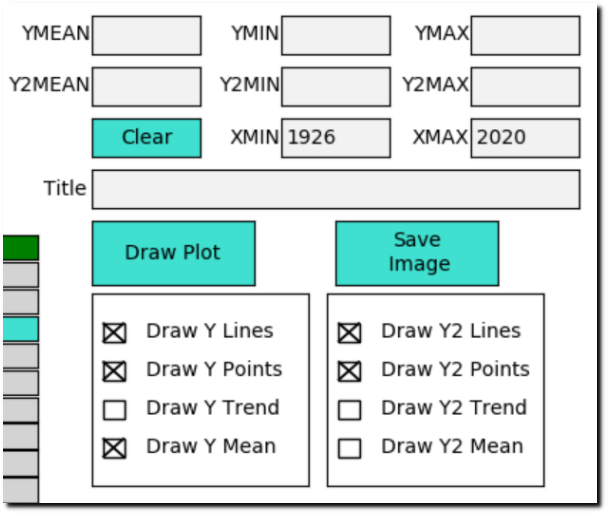
Enter a start year of 1926, and end year of 2020 as shown below.
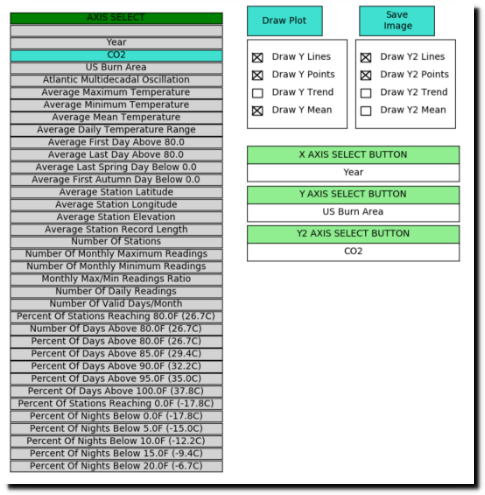
Set the checkboxes as shown below.
Press the Draw Plot button – that will create the graph.
To save an image of the graph, press the Save Image button. That will save the graph image as a .png file in the UNHIDING\ghcnd_hcn\output directory.
The new code can also be run by experienced Mac and Linux users as a python script.
python3 ghcn.py US.list months=05
People with UNIX like environments can update the temperature data from NOAA with these commands:
cd .. ./get cd ghcnd_hcn
The new code has a large amount of features which I haven’t documented here. Feel free to look at the python script ghcn.py and figure them out. Everything is contained in that file.
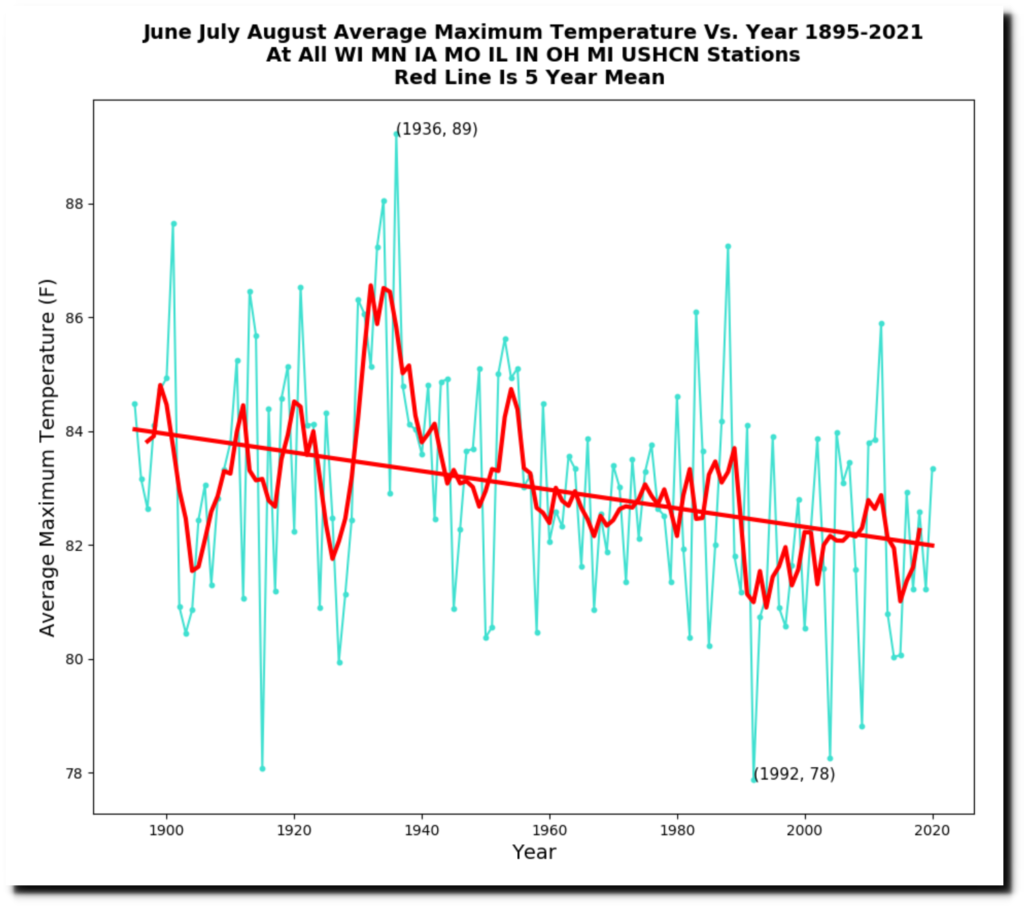
I will leave you with one more usage example for Upper Midwest summer temperatures.
.\ghcn.exe US.list months=060708 states=WIMNIAMOILINOHMI
I plan to make a video showing usage in more detail.
Thanks for the update, and thanks for giving us Y2! “Plugh!”
https://www.urbandictionary.com/define.php?term=plugh
I feel like I’m in a maze of twisty passages.. all different
Excellent!
Works beautifully on my Kubuntu 20.04 distro.
I have Spyder5 installed and plan to examine the code in that editor. I also have Jupyter Notebook installed, which I used to check plots of daily new cases vs daily new deaths against Benford’s Law. (The daily new cases failed). Since I already had installed the modules you used I am going to see if I can convert your py script to a Jupyter Notebook, ipynb.
Let me know
Most excellent, thank you very much.
Thankyou Tony, if anyone installs it on a Mac and is willing to walk me through installation, I’ll be much obliged and don’t mind paying the equivalent of an overpriced cup of coffee (£3) via Paypal.
Thank you Tony Tiger! Woo Hoo!
why do I get the error message after entering the command at the prompt of “The system can not find the path specified.
Why when entering the extracted files in the UNHIDING Directory and after opening the command prompt and enter specified commands I get the error message “The system cannot find the patch specified.”
Did you put the .\ at the beginning of the command?
Welcome back. I guess I should download this and have it on my computer just in case you disappear again.
I don’t have access to a UNIX machine to run the Get script. Has anybody created a Windows equivalent?
Hey Tony,
I’ve been trying random commands in an attempt to find out if its possible to analyze cities and specific stations. I don’t have a copy of the open source software so I have nothing to reference for commands. If it’s possible to run the *.exe like his then I’m keen to know how. If it’s not currently possible, then I’m keen to know when it likely will be.
Cheers