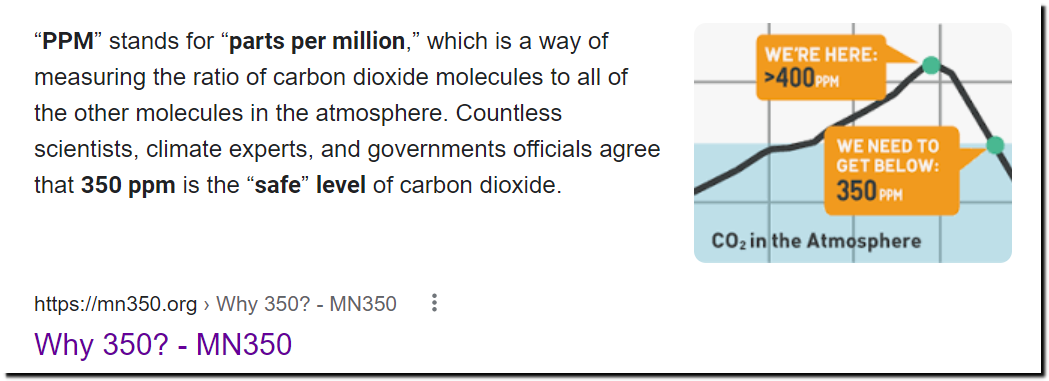
“Countless scientists, climate experts, and governments officials agree that 350 ppm is the “safe” level of carbon dioxide.”
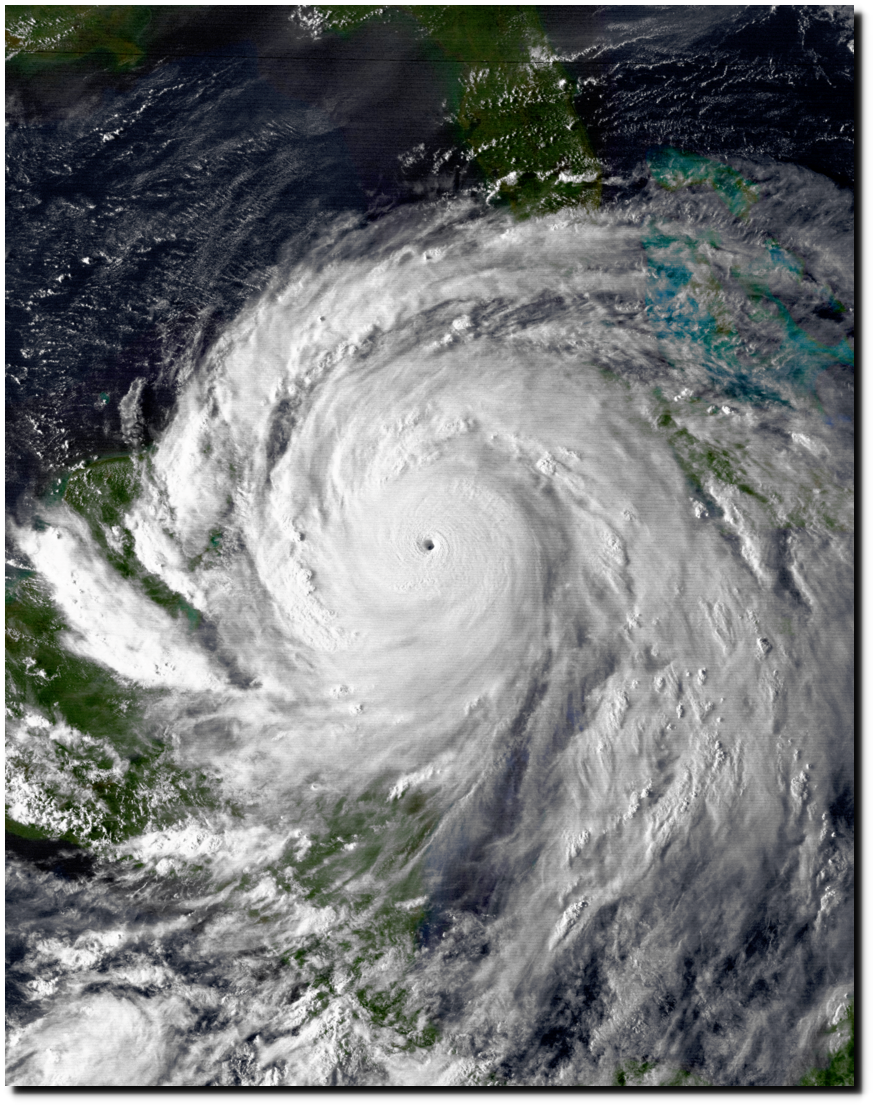
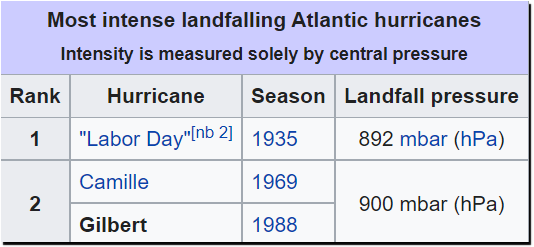
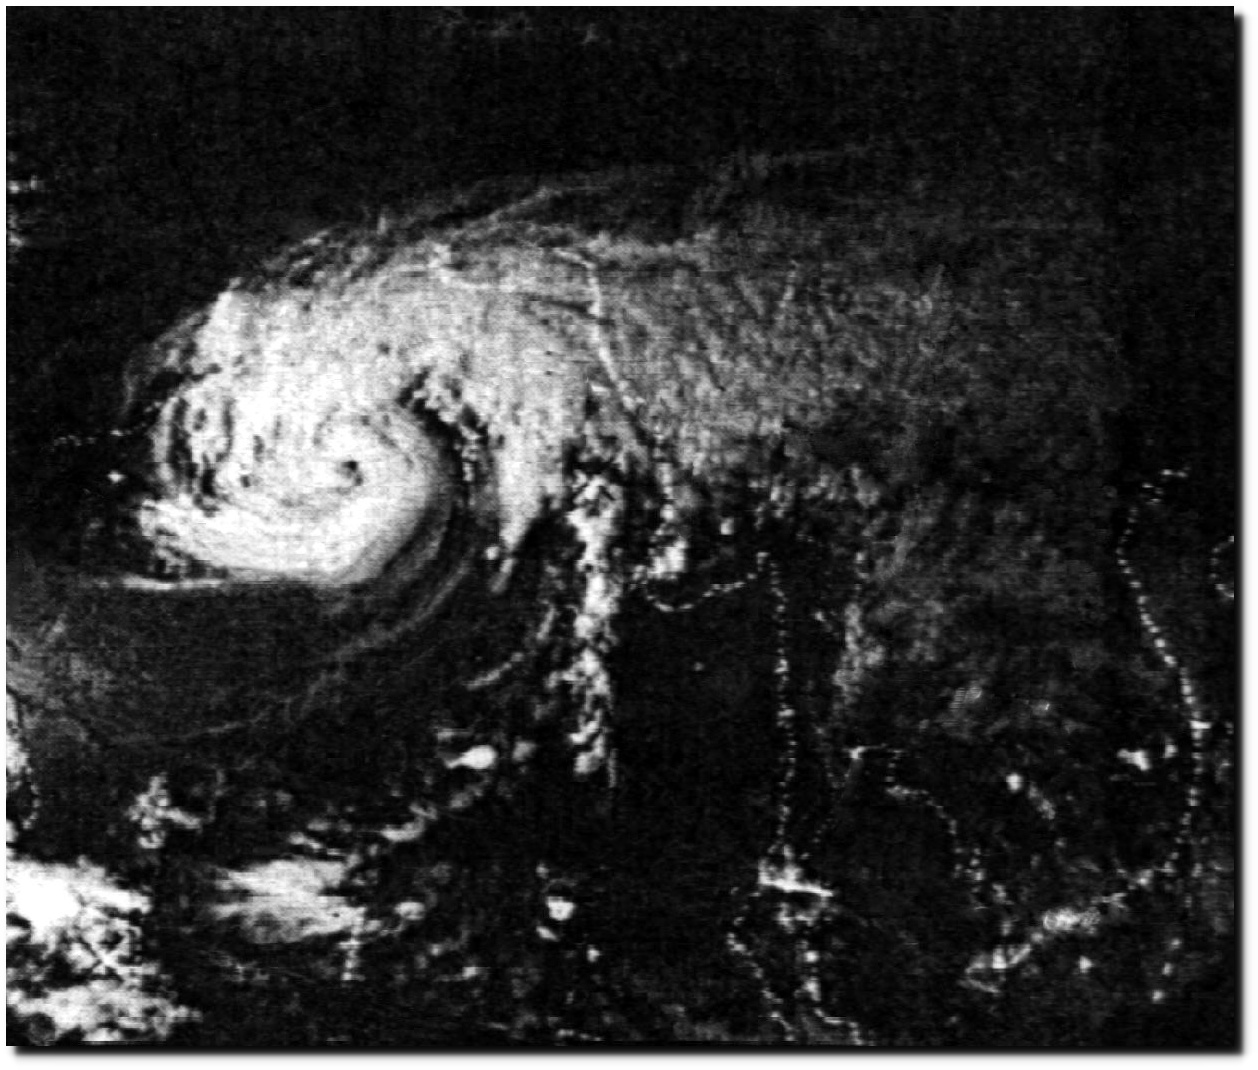
The last time CO2 was at the safe level of 350 PPM was 1988, when Yellowstone burned, the Mississippi River almost dried up, and Cancun was largely destroyed by the second most intense Atlantic Hurricane on record.
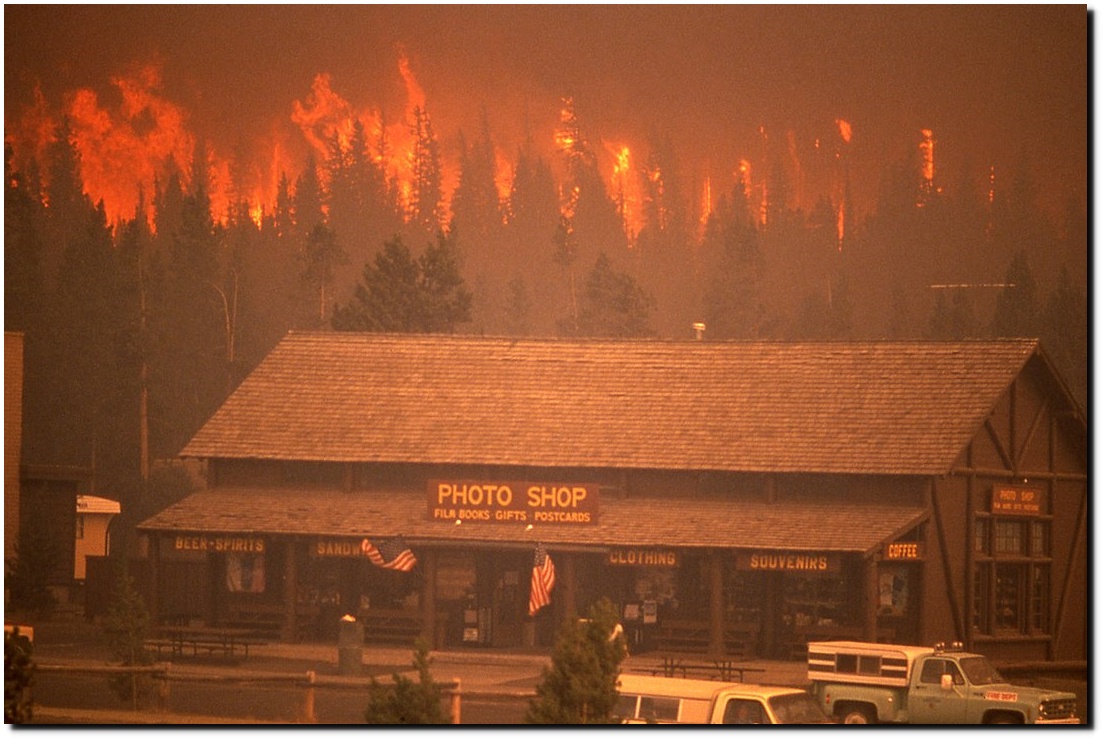
Yellowstone fires of 1988 – Wikipedia
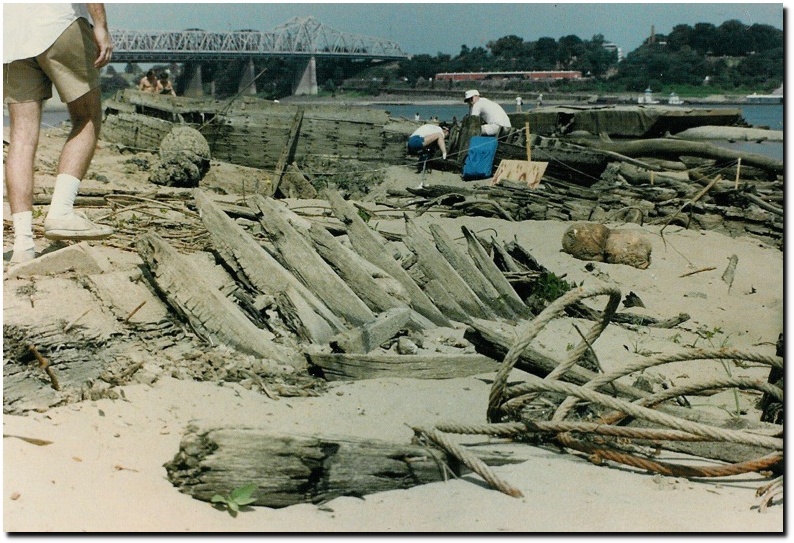
1988–89 North American drought – Wikipedia
“Hurricane Gilbert, the mightiest storm to hit the Western Hemisphere in this century, concentrates so much of its destructive energy into a narrow core that meteorologists say the storm resembles a monster tornado.”
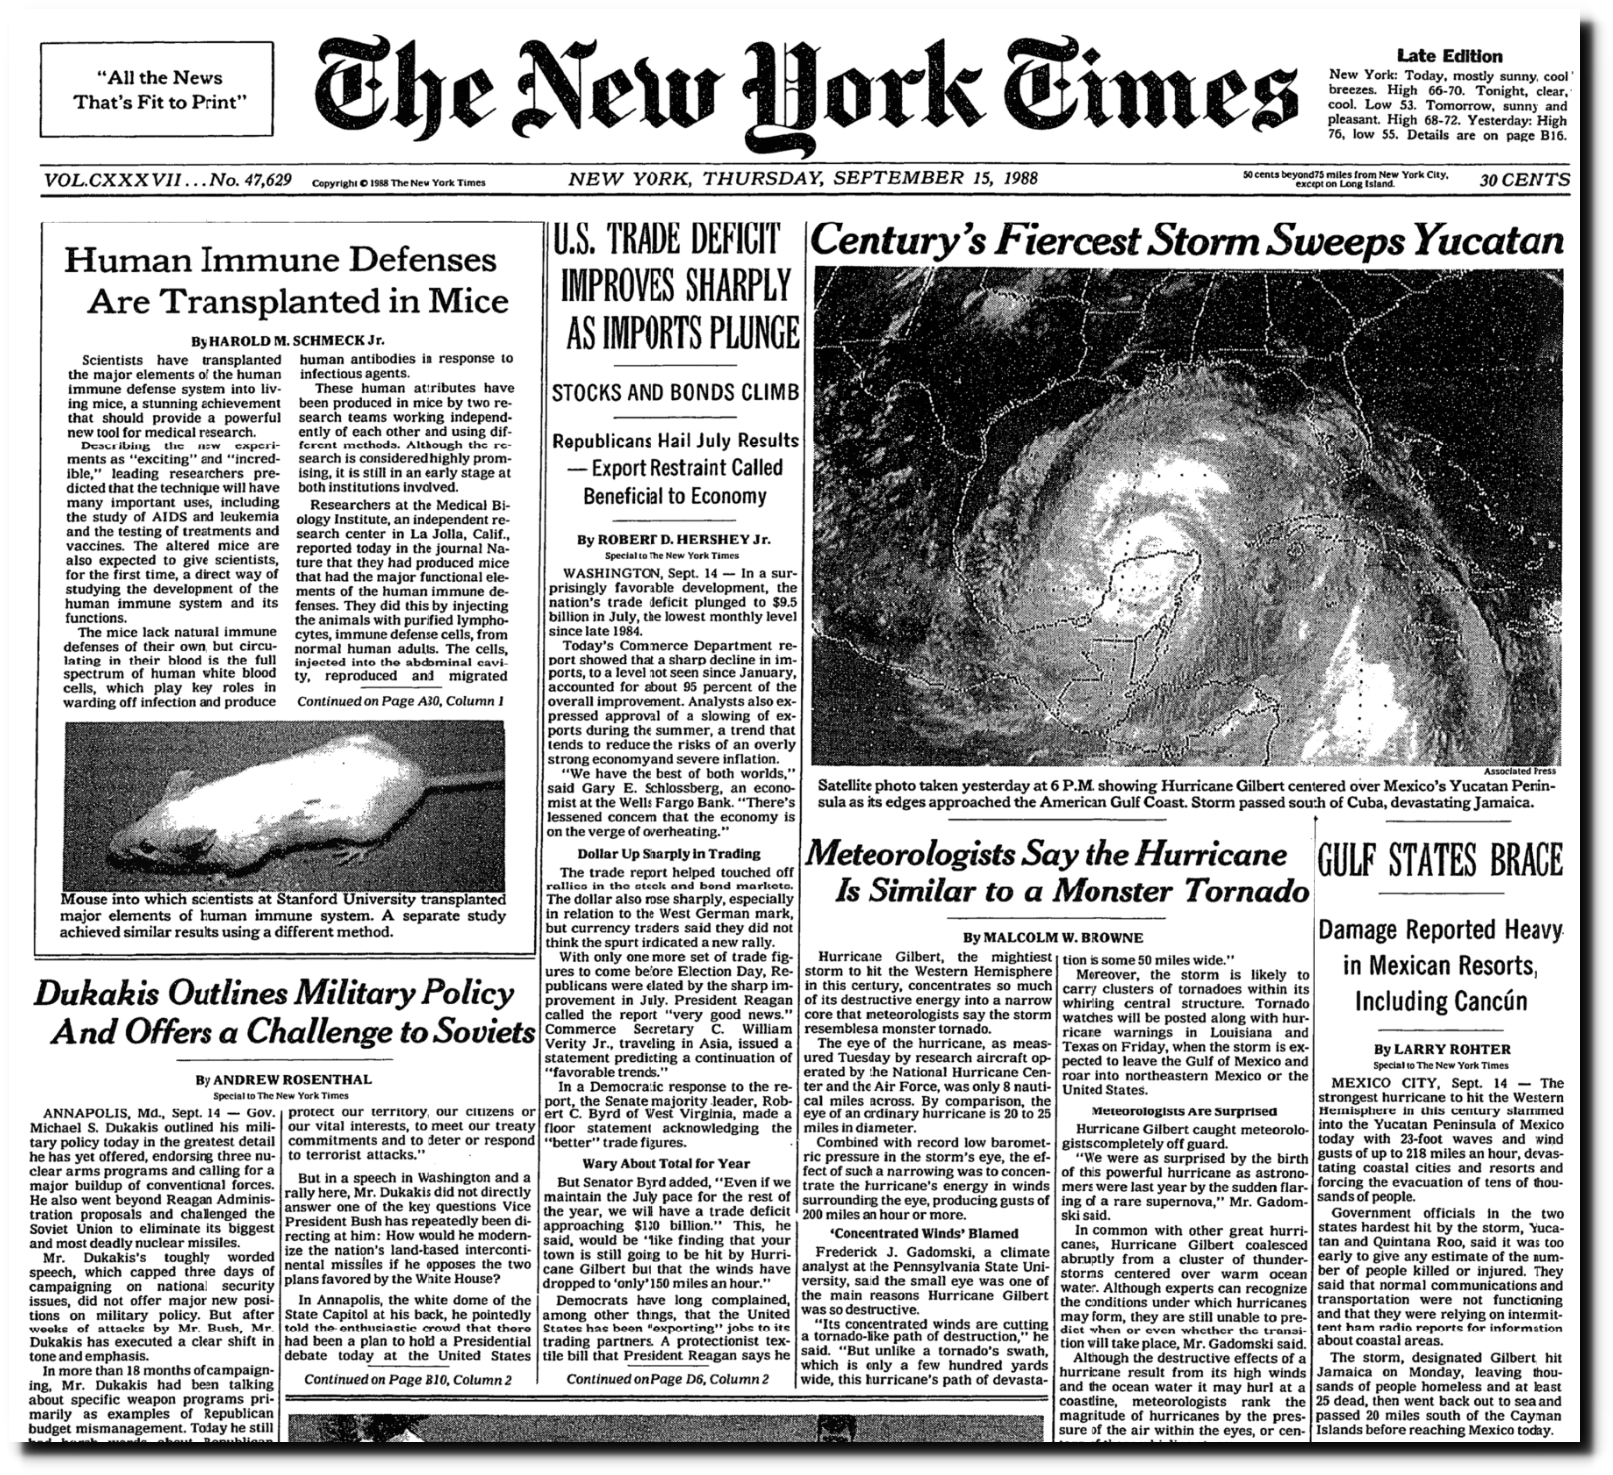
Meteorologists Say the Hurricane Is Similar to a Monster Tornado – The New York Times
Perhaps 350 PPM isn’t quite right? Maybe we need to get down to 320 PPM, which occurred in 1970.
“The 1970 Bhola cyclone was a devastating tropical cyclone that struck East Pakistan (present-day Bangladesh) and India’s West Bengal on November 11, 1970. It remains the deadliest tropical cyclone ever recorded and one of the world’s deadliest natural disasters. At least 500,000 people lost their lives in the storm”
1970 Bhola cyclone – Wikipedia
In 1974, fifteen percent of Australia burned.
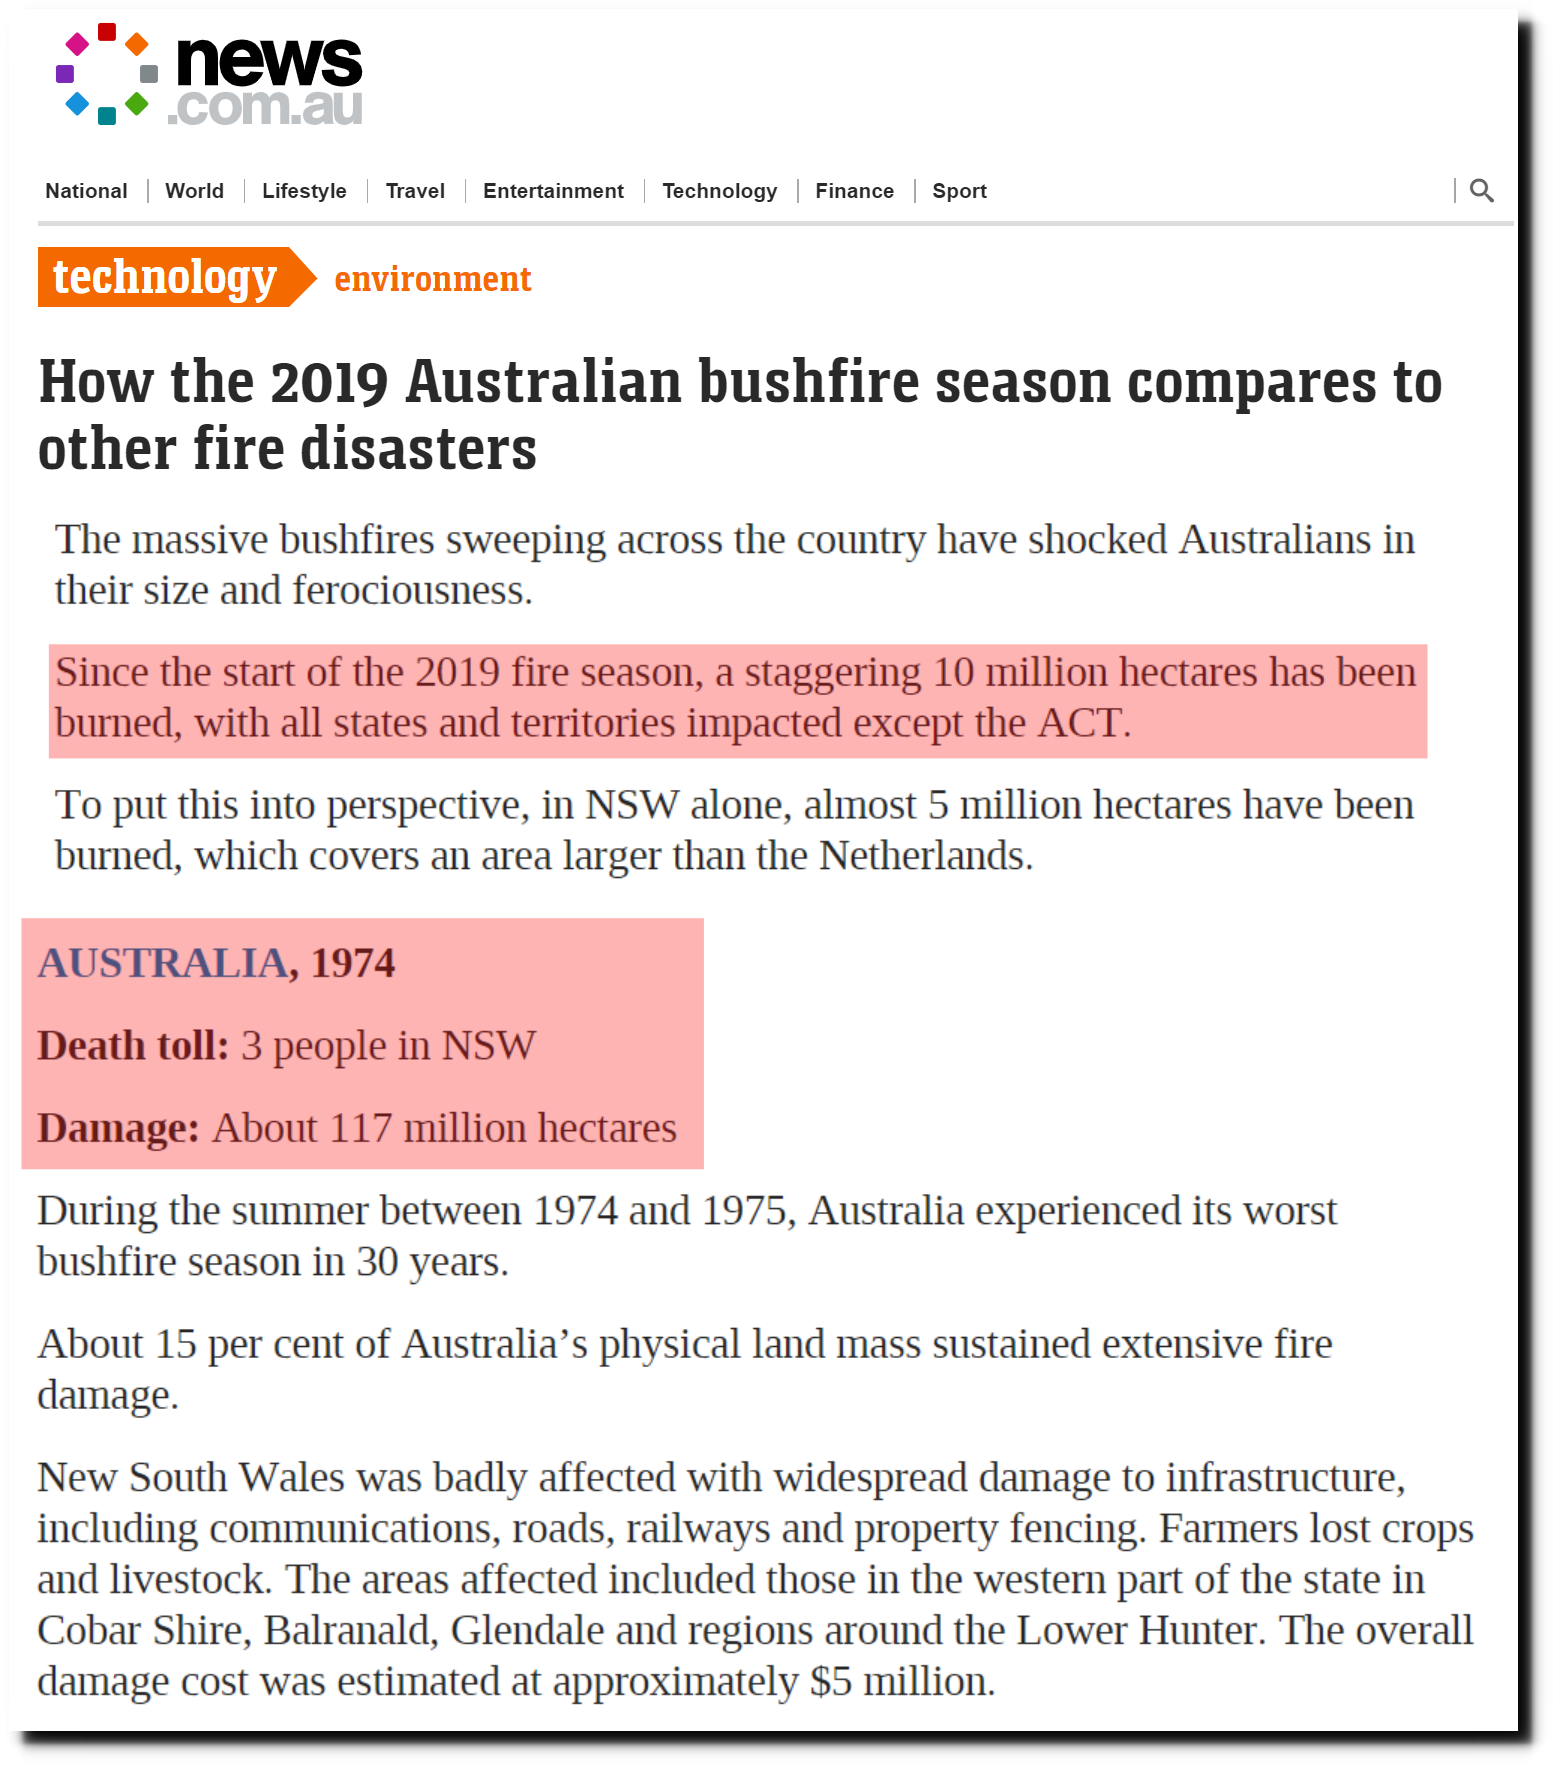
Australian bushfires: Why 2019 fire season is different from others
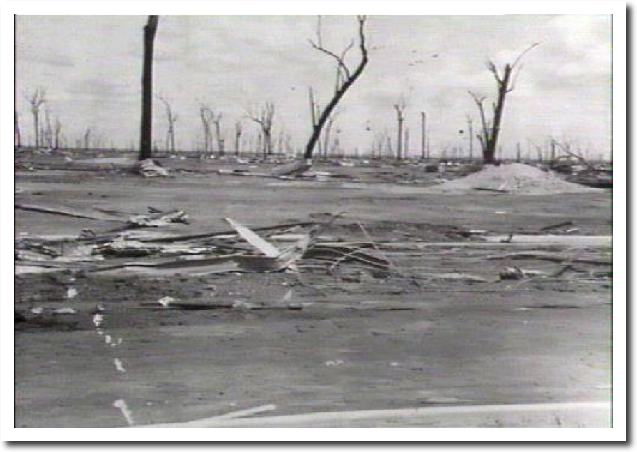
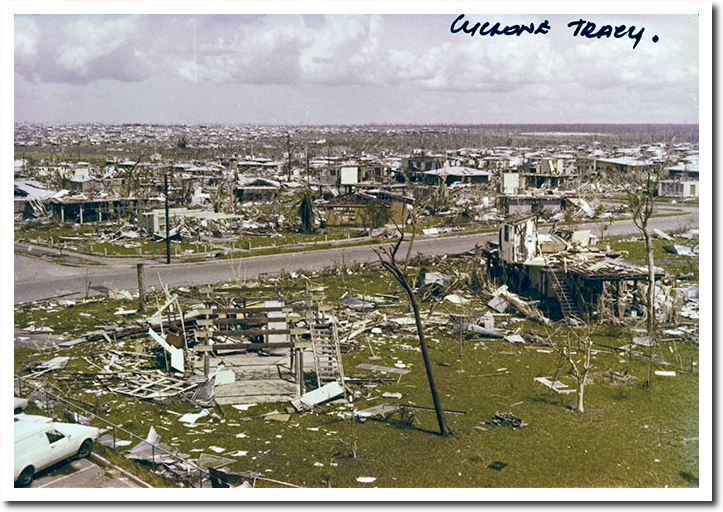
Darwin was destroyed by Cyclone Tracy on Christmas Day 1974.
Northeast Australia turned into an inland sea due to record rainfall and flooding.
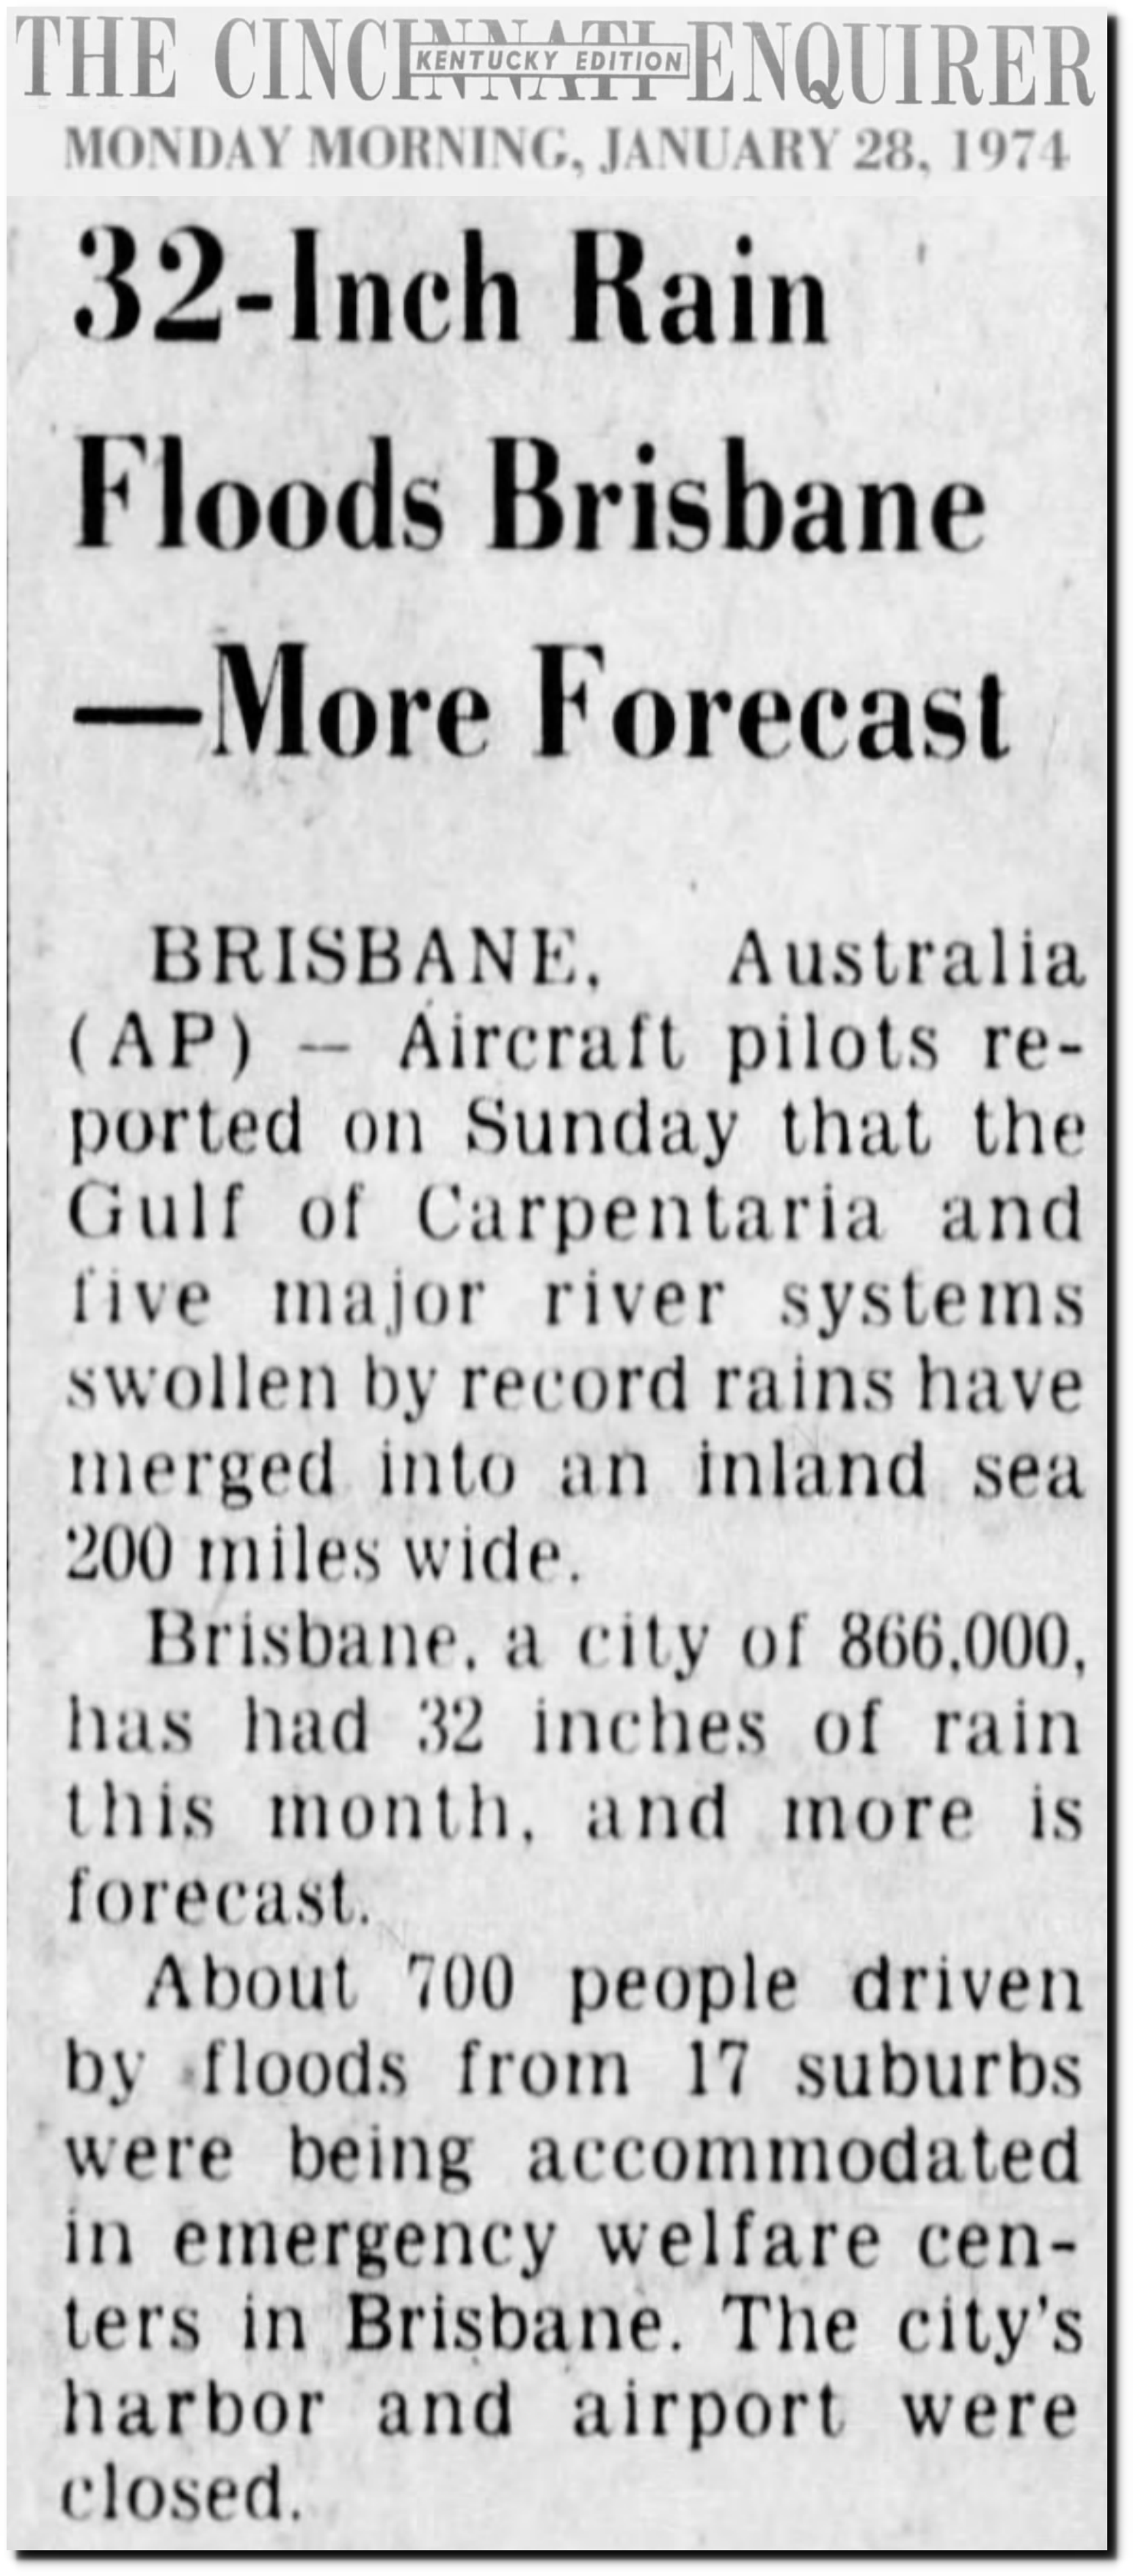
28 Jan 1974, Page 12 – The Cincinnati Enquirer at Newspapers.com
The US had its worst tornado outbreak on record.
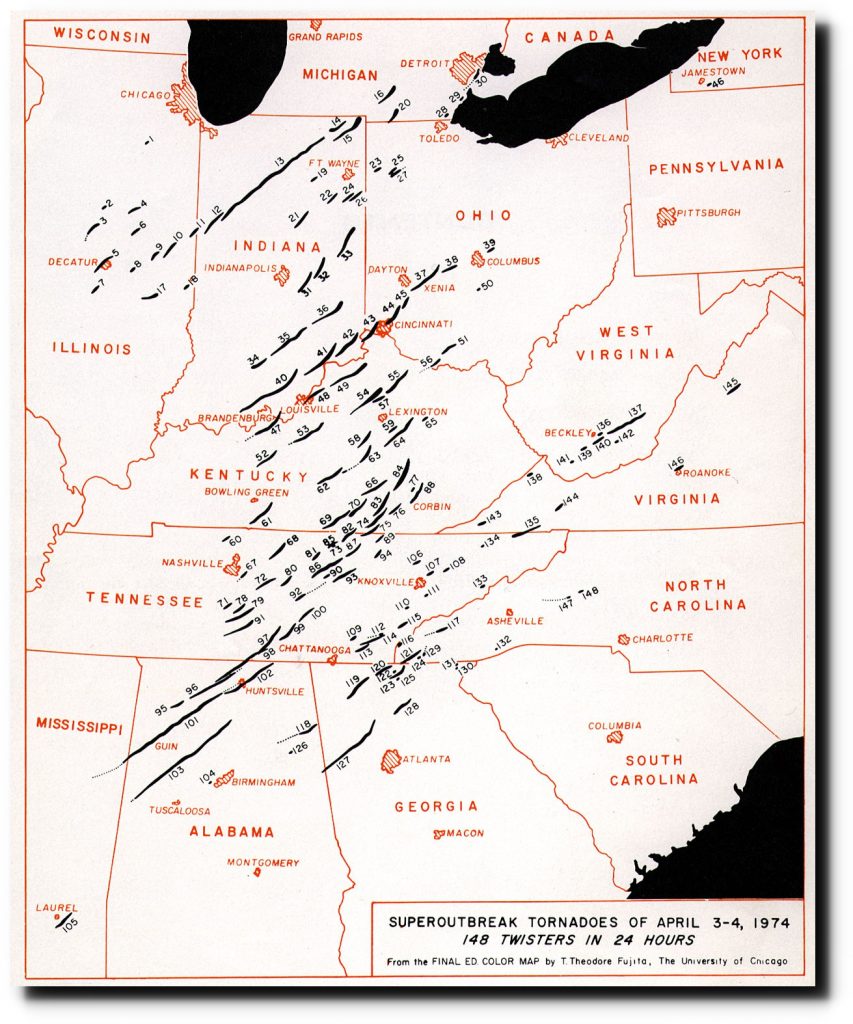
List of tornadoes in the 1974 Super Outbreak – Wikipedia
Phoenix had their worst heatwave.
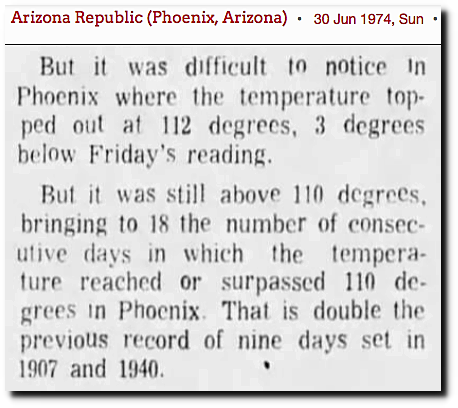
30 Jun 1974, Page 31 – Arizona Republic at Newspapers.com
And experts said we were headed into another ice age.
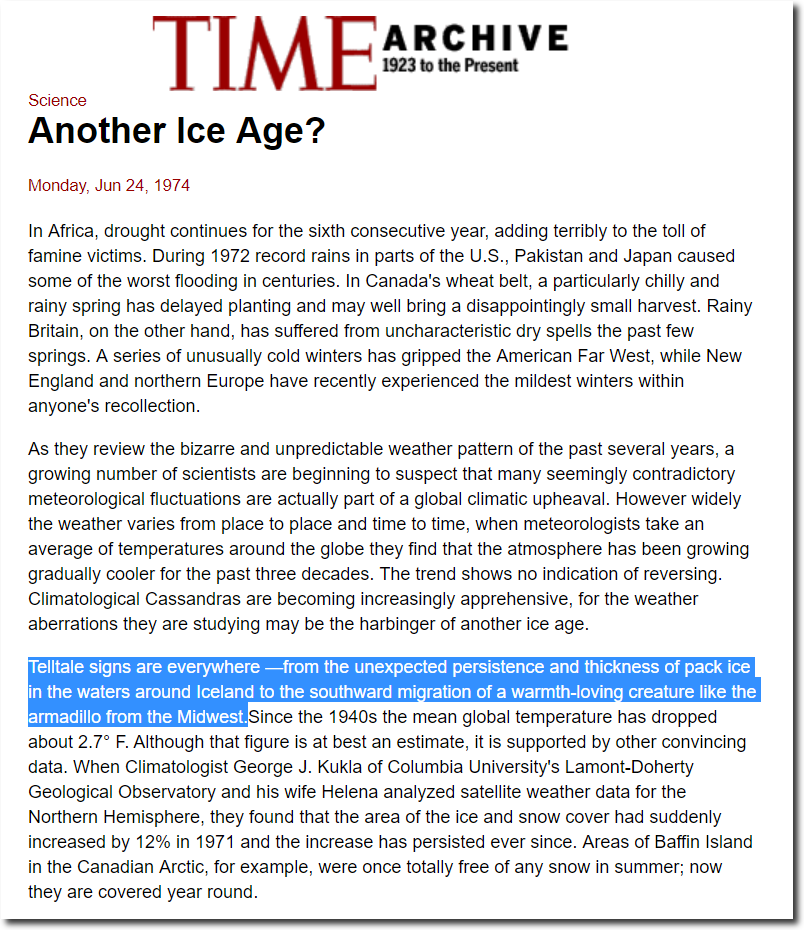
TIME Magazine Archive Article — Another Ice Age? — Jun. 24, 1974
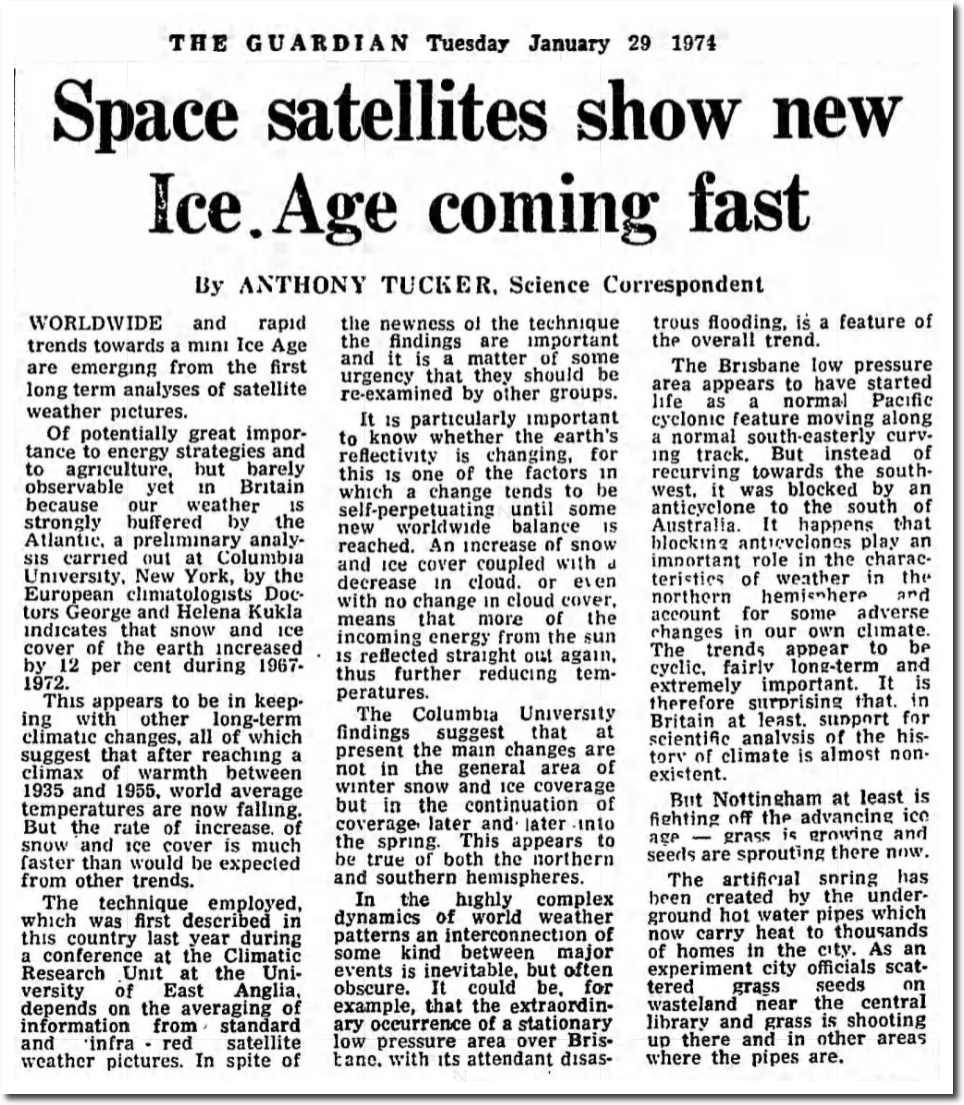
29 Jan 1974, 5 – The Guardian at Newspapers.com
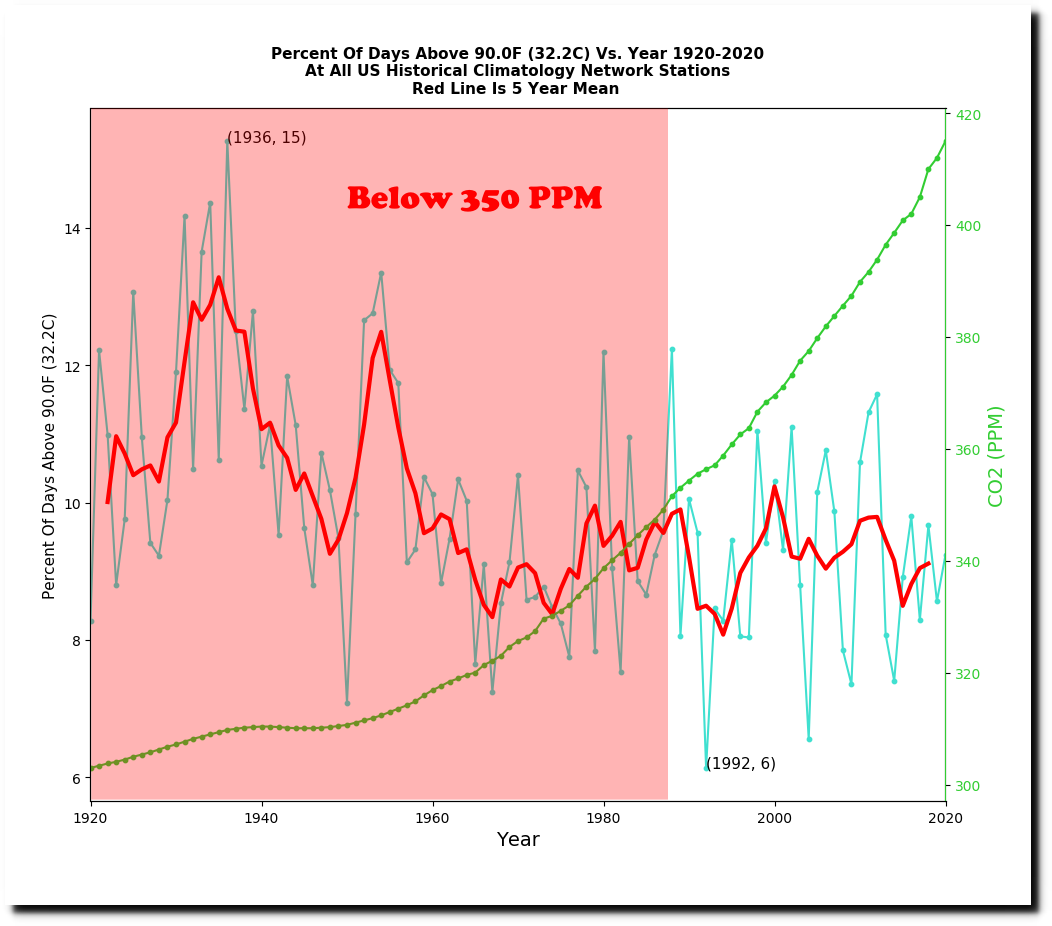
Hot weather was much more common when CO2 was below 350 PPM. But I lack the qualifications to dispute “Countless scientists, climate experts, and government officials”