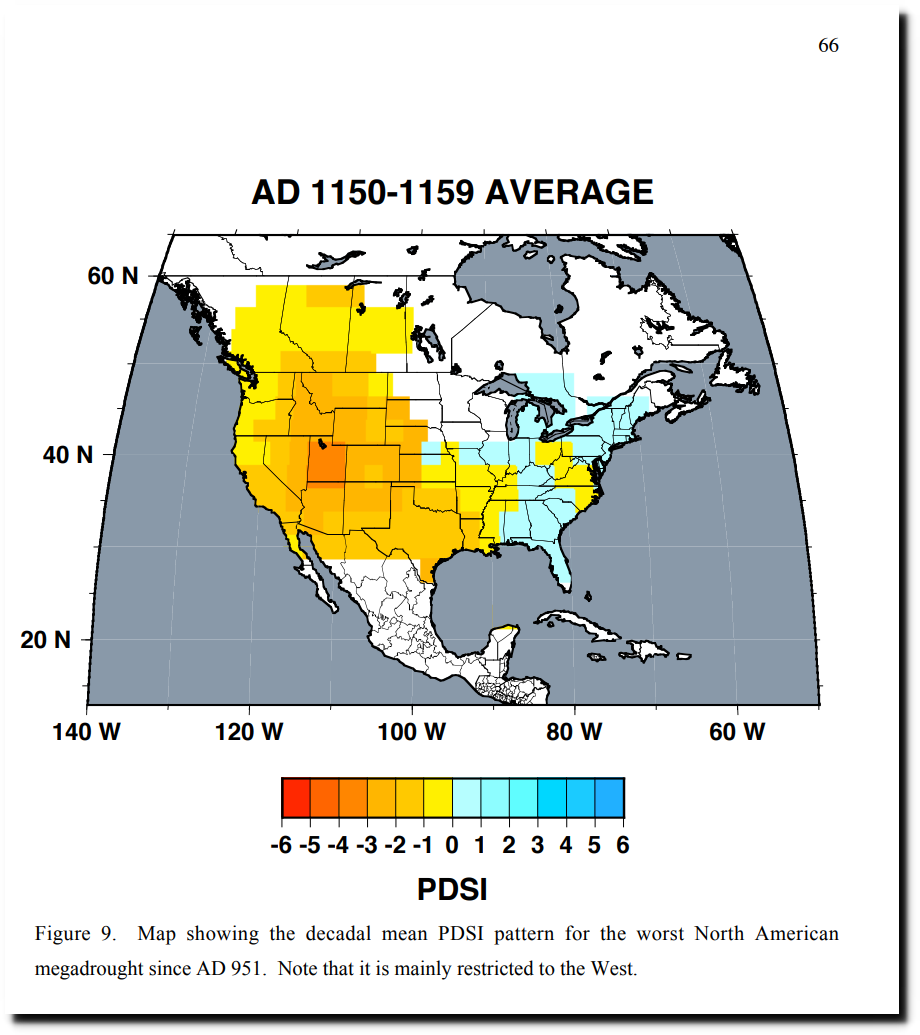
The worst megadrought in North America occurred between the years 1150 and 1159.
Disrupting the Borg is expensive and time consuming! Please help with a gift by clicking the button below.
-
Recent Posts
Recent Comments
- arn on Abiogenic Oil?
- arn on “It Is Possible”
- Jimmy Haigh on “It Is Possible”
- John B on The Safe Climate Of 1931
- Gordon Vigurs on Abiogenic Oil?
Archives
- February 2023
- January 2023
- December 2022
- November 2022
- October 2022
- September 2022
- August 2022
- July 2022
- June 2022
- May 2022
- April 2022
- March 2022
- February 2022
- January 2022
- December 2021
- November 2021
- October 2021
- September 2021
- August 2021
- July 2021
- June 2021
- May 2021
- April 2021
- March 2021
- February 2021
- January 2021
- December 2020
- November 2020
- October 2020
- September 2020
- August 2020
- July 2020
- June 2020
- May 2020
- April 2020
- March 2020
- February 2020
- January 2020
- December 2019
- November 2019
- October 2019
- September 2019
- August 2019
- July 2019
- June 2019
- May 2019
- April 2019
- March 2019
- February 2019
- January 2019
- December 2018
- November 2018
- October 2018
- September 2018
- August 2018
- July 2018
- June 2018
- May 2018
- April 2018
- March 2018
- February 2018
- January 2018
- December 2017
- November 2017
- October 2017
- September 2017
- August 2017
- July 2017
- June 2017
- May 2017
- April 2017
- March 2017
- February 2017
- January 2017
- December 2016
- November 2016
- October 2016
- September 2016
- August 2016
- July 2016
- June 2016
- May 2016
- April 2016
- March 2016
- February 2016
- January 2016
- December 2015
- November 2015
- October 2015
- September 2015
- August 2015
- July 2015
- June 2015
- May 2015
- March 2015
- January 2015
Meanwhile I’ve discovered more corrupted temperature data in my area.
I live in west Tn, between Memphis and Jackson. The official temp at Memphis International, one of the, if not the busiest airports in the world thanks to freight is running 7 to 10 degrees warmer this morning (typical) than the surrounding area, including highly populated areas inside the city of Memphis, including the National Weather Service office in east Memphis. Meanwhile the station at Jackson airport is apparently down, again typical in the cool early morning. Rather than put “missing” on the current area temperature hourly round up, it automatically fills in the same as Memphis which is typically 8 to 10 deg F warmer this time (sunrise).
I had the opportunity to once again view the station at Memphis International yesterday, and there was considerable construction going with a few yards of the recording equipment (adding more concrete)
It’s bad enough the station is literally a few yards away from one of the largest chunks of concrete in the country, the massive runway system with hundreds of large planes full of freight taking off just feet away.
The “official” reading at memphis is 2 to 3 degrees corrupt in the daytime, and 7 to 10 degrees corrupt on a clear calm night.
The more construction done at Memphis International, the more insanely false temperature data that goes into the record books.
In 1960, the airport was surrounded by cotton fields. So naturally the temperature keeps going up.
The micro climate at Memphis International does not reflect the temperature in the city where people live, and certainly not in the less urban suburbs and countryside where I live a few miles away.
If anything the corrupt concrete airport readings should be given little weight to the overall climate, because the heat islands only make up 1 to 2 percent of the total land area. They are doing it exactly backwards, by assuming missing data same as the warmer micro climate created at busy airports
Update, they’ve done the same this hour. Jackson Tn airport is assumed the same temp as Memphis international. Same exact readings, wind, dew point, and temp.
There’s several stations, including long standing ones in the area that are 8 to 10 cooler this hour, including the one in by backyard
This is FRAUD
Here in KY we found thermo readings being taken on top of BLACK roofs next to AC units!!!
Another was on BLACK asphalt next to HUGE transformers right next to the building South wall…AND just across the street was a wooded area that was perfect for that thermometer to be placed.
The multi centennial graph ” Long Term Aridity Changes In The West ” displays three turning point or marker dates that closely correlate with notable events in the Vance et al eastern Australian paleo drought reconstruction : aside from the 1150 – 59 megadrought , 1253 CE and 1321 CE .
Read this passage from Vance et al ” Interdecadal Pacific Variability and Eastern Australian Mega -Droughts Over the Last Millennium [ 2014 ] American Geophysical Union ” https://doi:10.1002/2014GL062447
When the previously published LD summer sea salt rainfall proxy and the new IPO reconstructions are combined , the three major epochs [ two dry – AD 1000 -1260, AD 1920 -2009 and one wet AD 1260 – 1860 ] previously identified in Vance et al [2013 ] are confirmed . Eight IPO positive phase mega -droughts are observed ,five during the first dry epoch [ Fig. 4e ] ,and six prior to AD 1320. The longest mega drought of 39 y duration [AD 1174 – 1212 ] .occurred at the end of a century of pronounced IPO positive drought conditions , with 80 of the 111 y period AD 1102 – 1212 in drought ”
Spanning the Pacific , the eastern side of the Australian continent and the western half of North America were stricken by the most severe droughts of the past millennium in the same Medieval Optimum century – the 1100’s . The North American aridity phase starts in the 1140’s peaking to extreme PDSI conditions in the 1150’s followed by an interlude then another drought in the 1250’s . 1320 CE in the Australian chronology and 1321 in the American series are conspicuous as cooler , wetter period watershed dates [ a wet nadir in the American chart ] . So too circa 1260 CE ..What was so unusual or unique about those two dates in history and paleo-climatology ? ..Well the biggest upper VEI scale volcanic eruption of the last 10 000 years was Samalas near the equator in 1257 CE which must have sent massive volumes of sulfate aerosols , water vapor and particulates into the atmosphere , dramatically altering the worlds climate .
Northern hemisphere and southern hemisphere tree ring chronologies [ Fennoscandia pines ; New Zealand cedars ] exhibit 1319 – 21 as the starting narrow ring dates of temperature troughs lasting until the 1340’s . A Tasmanian Huon Pine study in the Cook et al paper ” Tree Rings and Climatic Reconstruction in Tasmania ” categorizes the years 1318 and 1321 as narrow width years and 1319 as a frost damage year . The reconstructed North Atlantic temperature series shows plummeting temperatures and ‘altered character ‘ circa 1320 which coincides with the heavy rains freezing cold conditions and failed harvests of the 1315 -22 CE ‘Great Famine’ years across Europe . So it turned wetter and colder around 1320 and continuing for many years afterward, in the regions of western Europe , western North America and Australasia . If one examines the Hannon 2021 ‘ Greenland and Antarctic Co2 Trends graph focusing on the Law Dome Spline series, the 14th century ‘bump’ in carbon dioxide is immediately visible. This CO2 surge amounts to an estimated rise of 45 GT between 1330 – 1350 CE at a time of deepening cold [ now isn’t that awkward ?] suspected to be marine carbon emitted from an ‘ocean turnover event possibly coupled with biomass burning
Understand there is no large volcanic signal evident between 1300 – 1343 CE.
The radiocarbon calibration curve changes from enrichment to depletion in the timeframe 1325 – 1335 CE – a phenomenon that is now best explained by an enormous injection of old carbon from the oceans into the atmosphere [ Several medieval European chroniclers mention mass fish die offs and dead marine animals at this very time of interest ] discernible in the Law Dome ice core and the Siple and D47 D57 CO2 study . The only question is : what caused the climatic upheaval of the 1320’s ? I know the answer https://andymaypetrophysicist.com/2021/07/01/greenland-ice-core-co2-during-the-past-1000-years/