The vast majority of the world’s high quality historical temperature data comes from the United States. NOAA has no long term daily temperature from most of the earth’s surface.
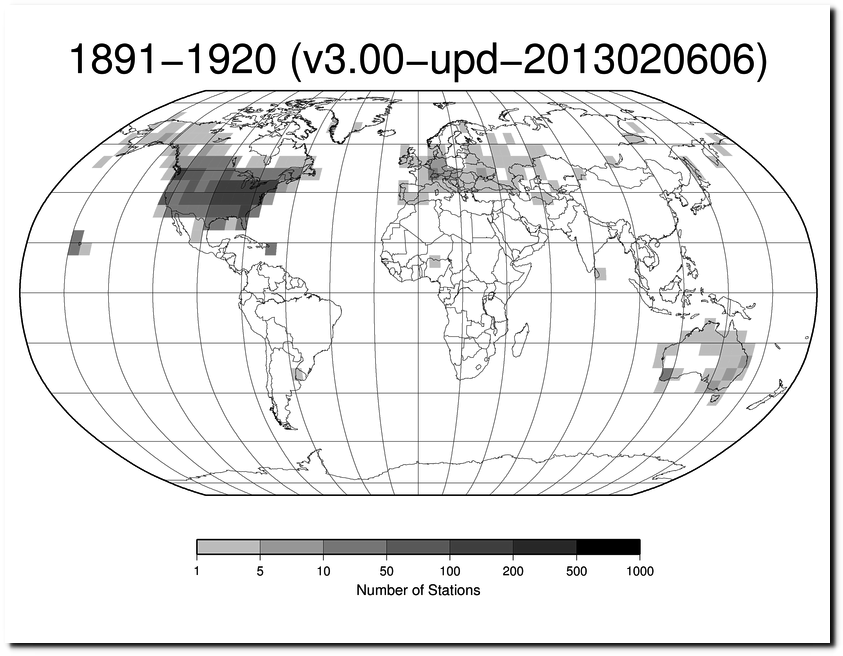
ftp://ftp.ncdc.noaa.gov/pub/data/ghcn/daily/figures/station-counts-1891-1920-temp.png
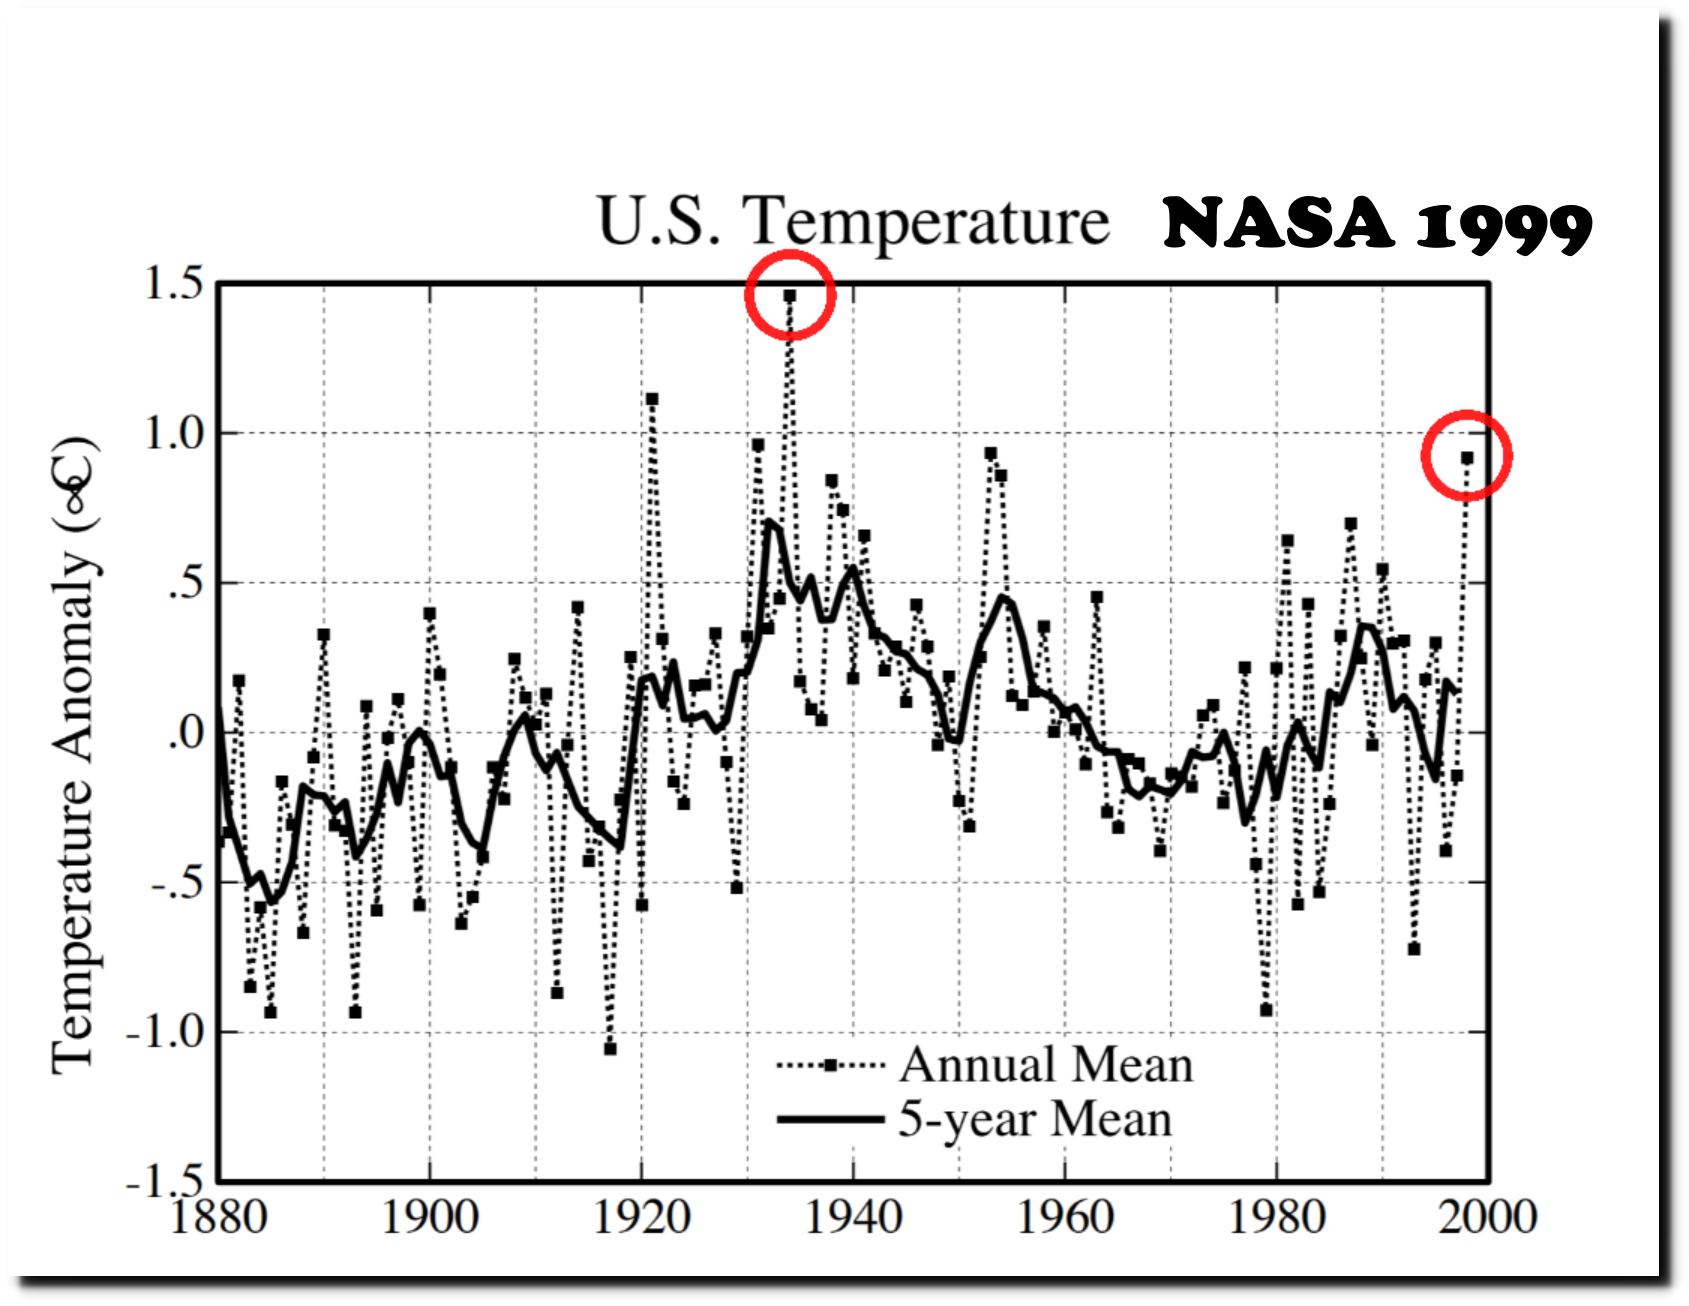
In 1999, NASA’s James Hansen was upset that the US temperature trend didn’t match the imaginary warming trend he had created for the rest of the world.
“in the U.S. there has been little temperature change in the past 50 years, the time of rapidly increasing greenhouse gases — in fact, there was a slight cooling throughout much of the country ….. climate trends have been fundamentally different in the U.S. than in the world as a whole.”
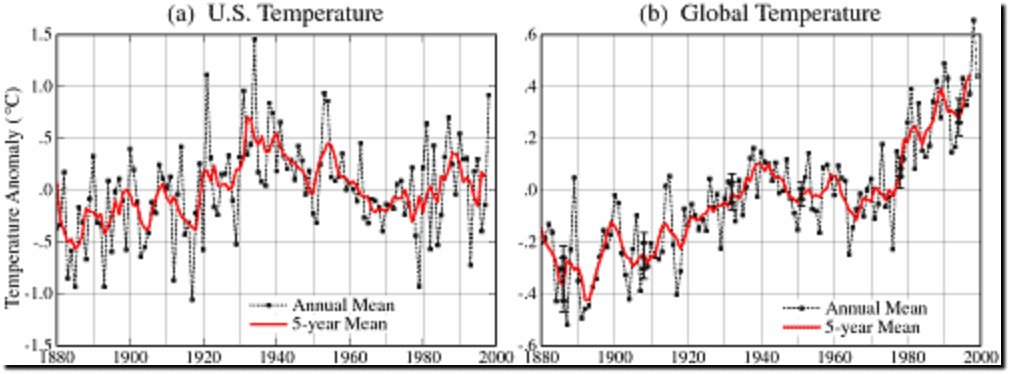
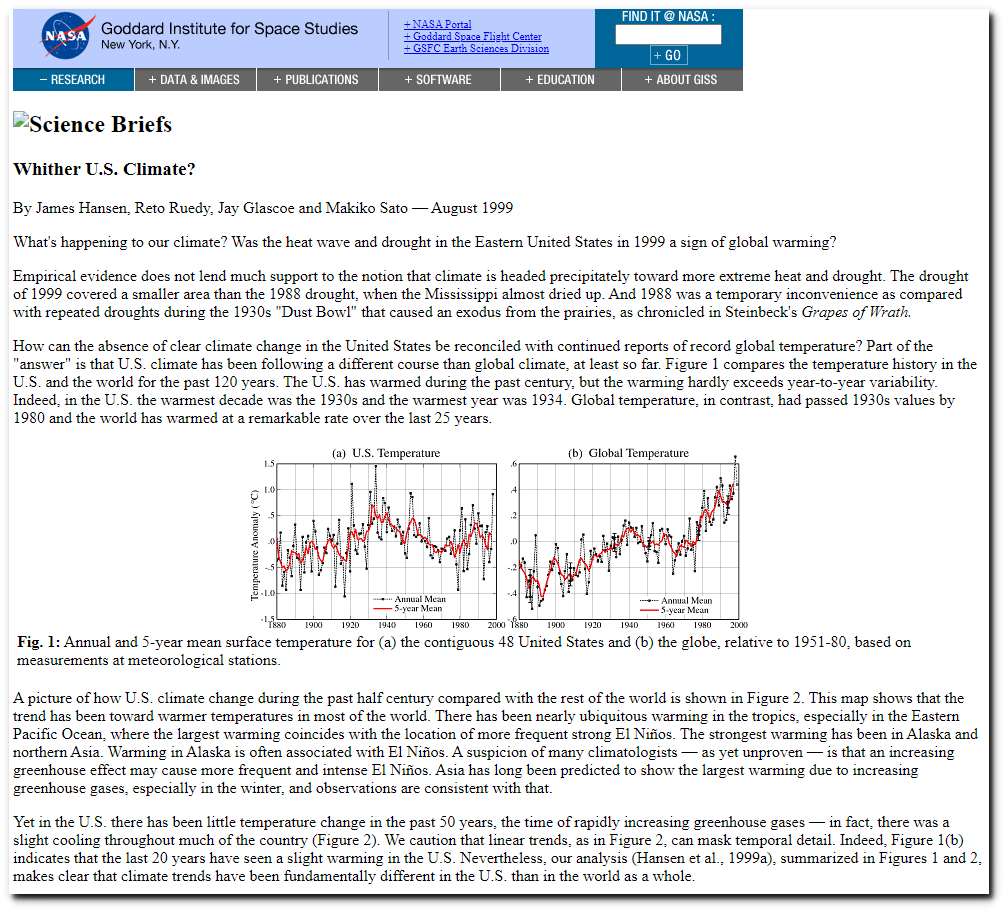
NASA GISS: Science Briefs: Whither U.S. Climate?
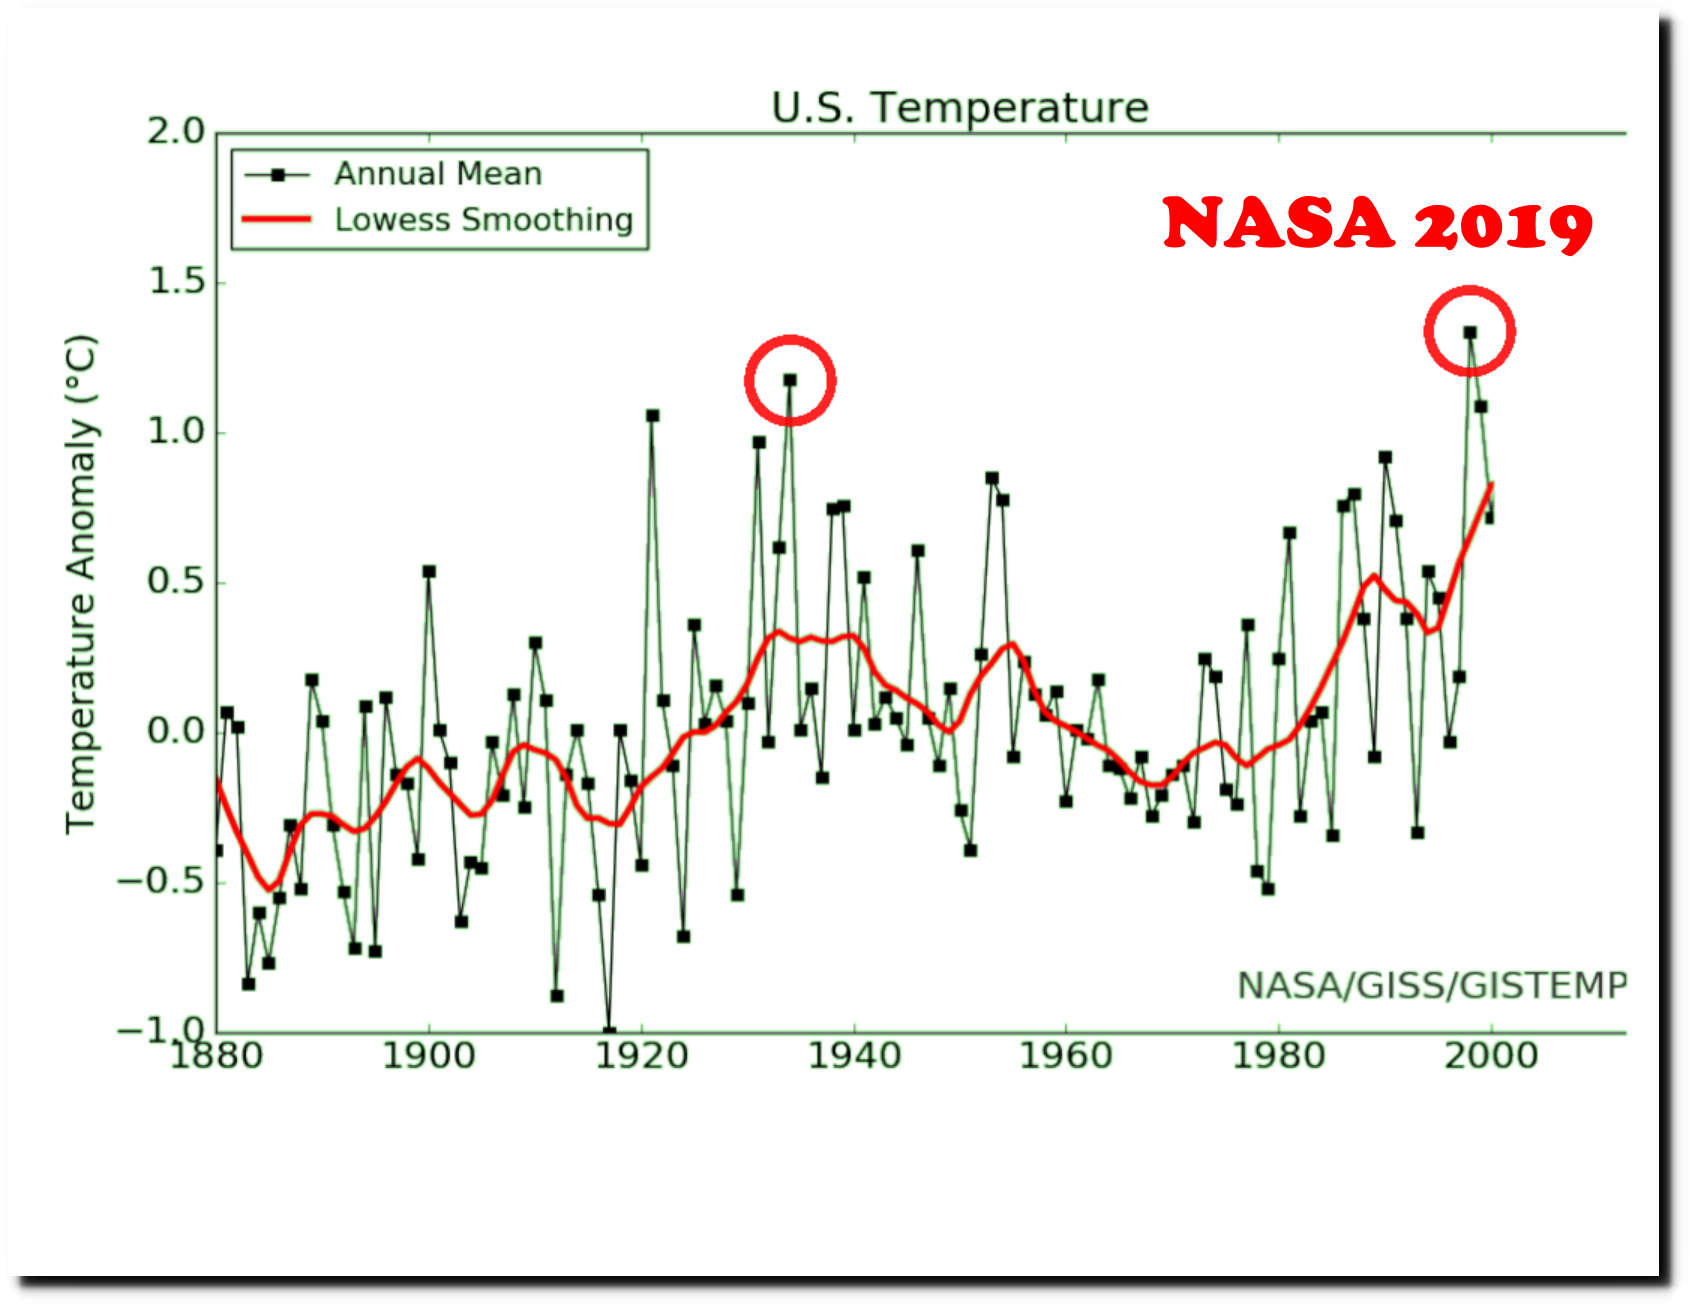
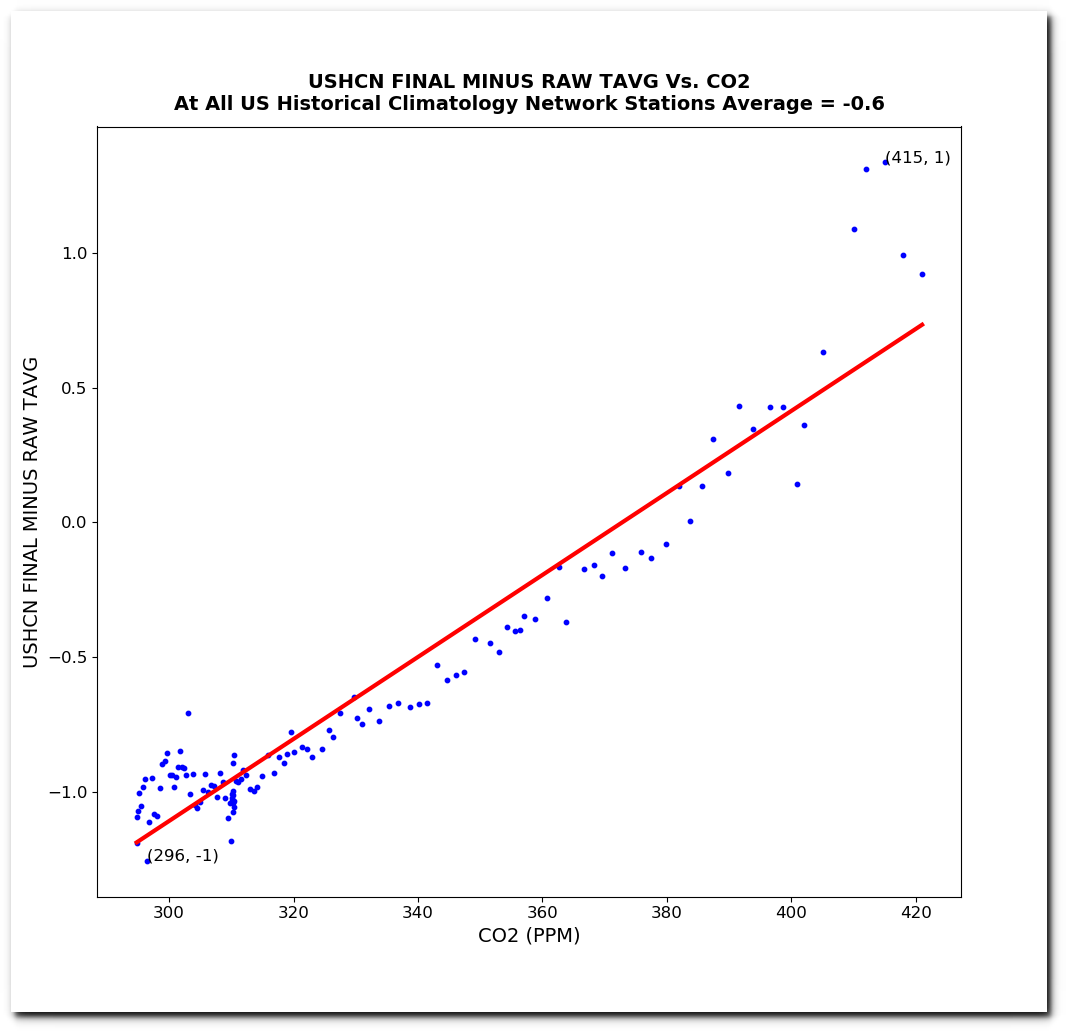
So NASA and NOAA did just what would expect them to, they altered the US temperature data to match the fake global temperature.
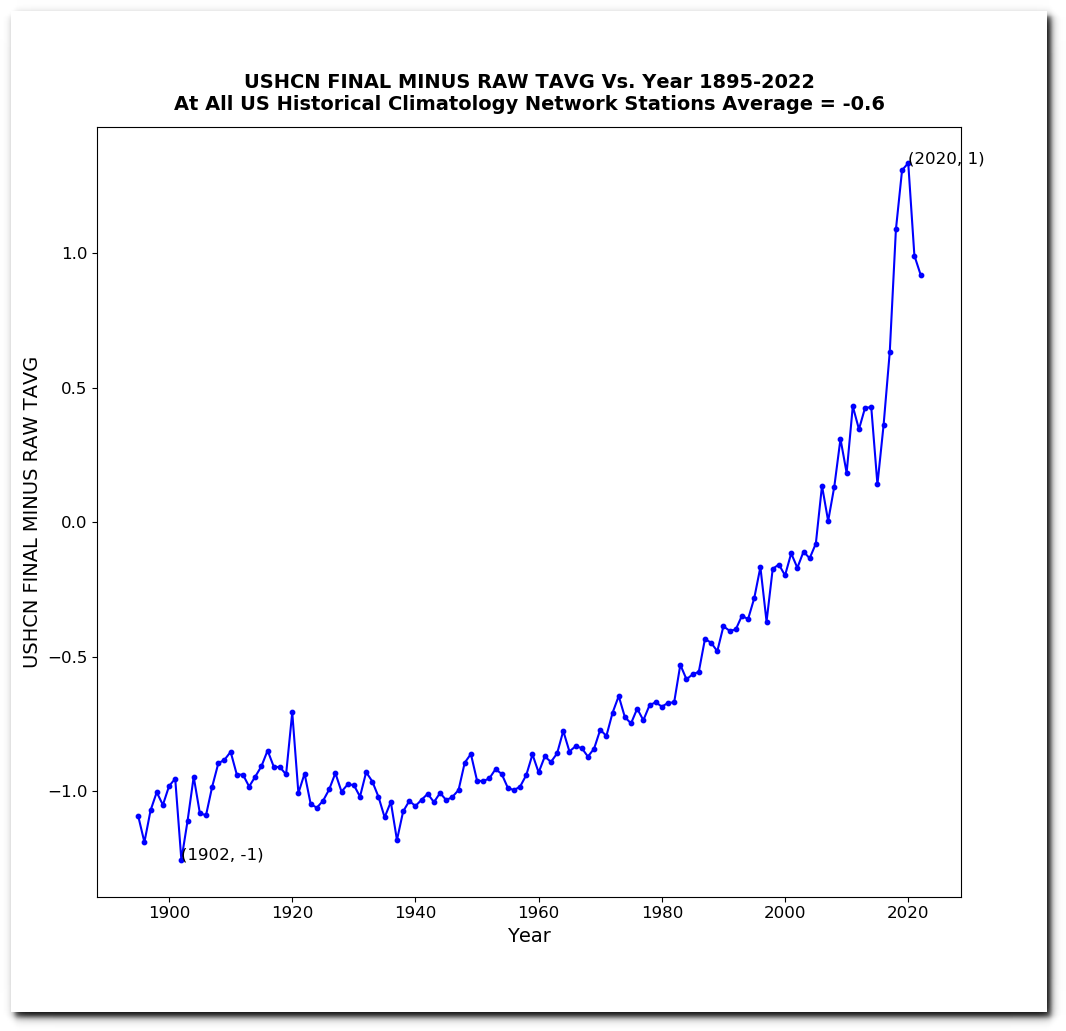
In 2005 the adjustments totaled 0.5F and tailed off after 1990.
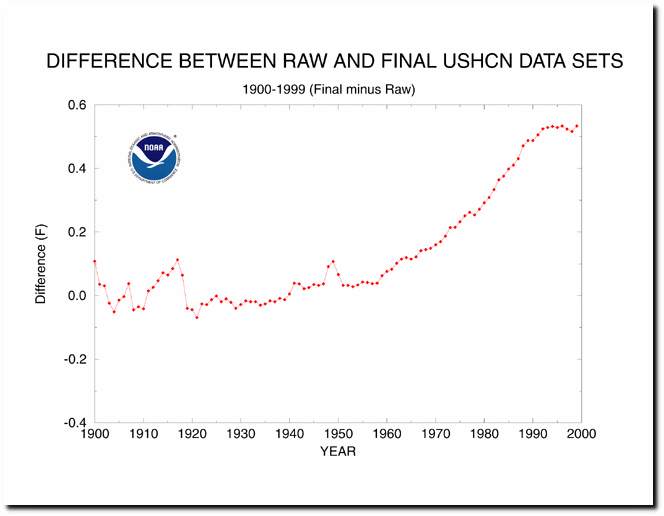
The Time of Observation Bias adjustment totaled 0.3F and tailed off after 1995.
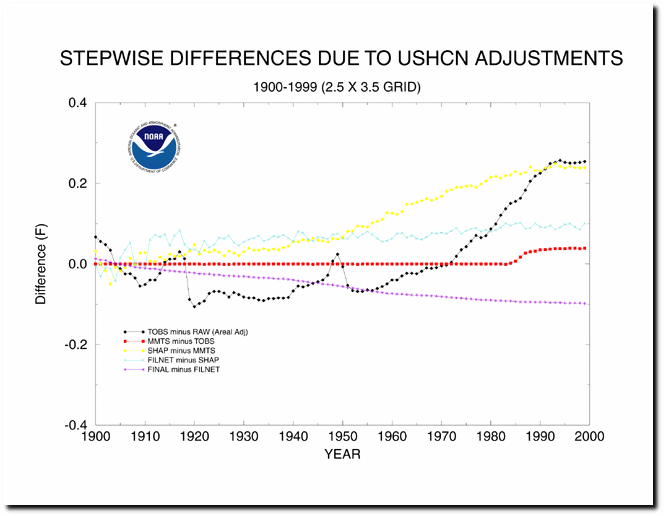
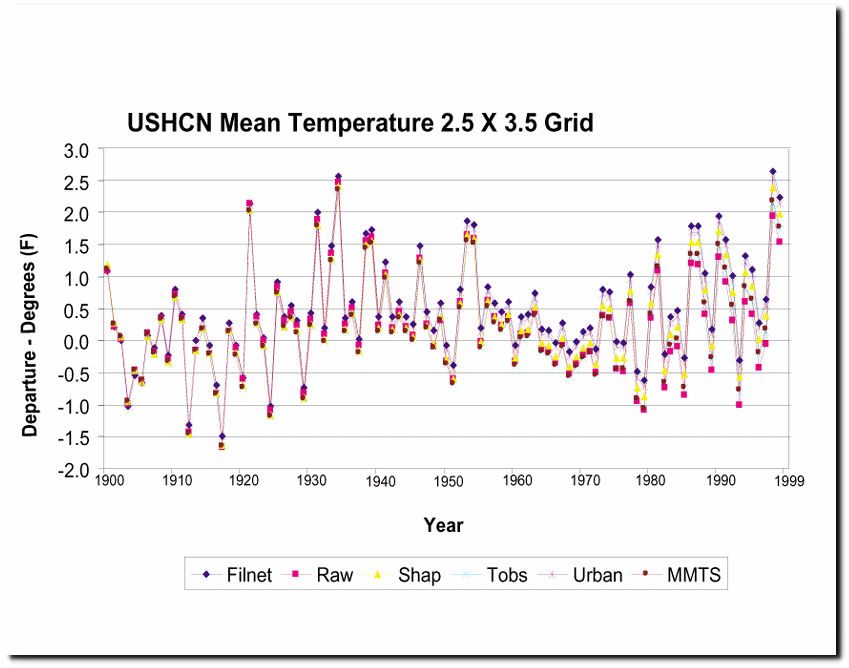
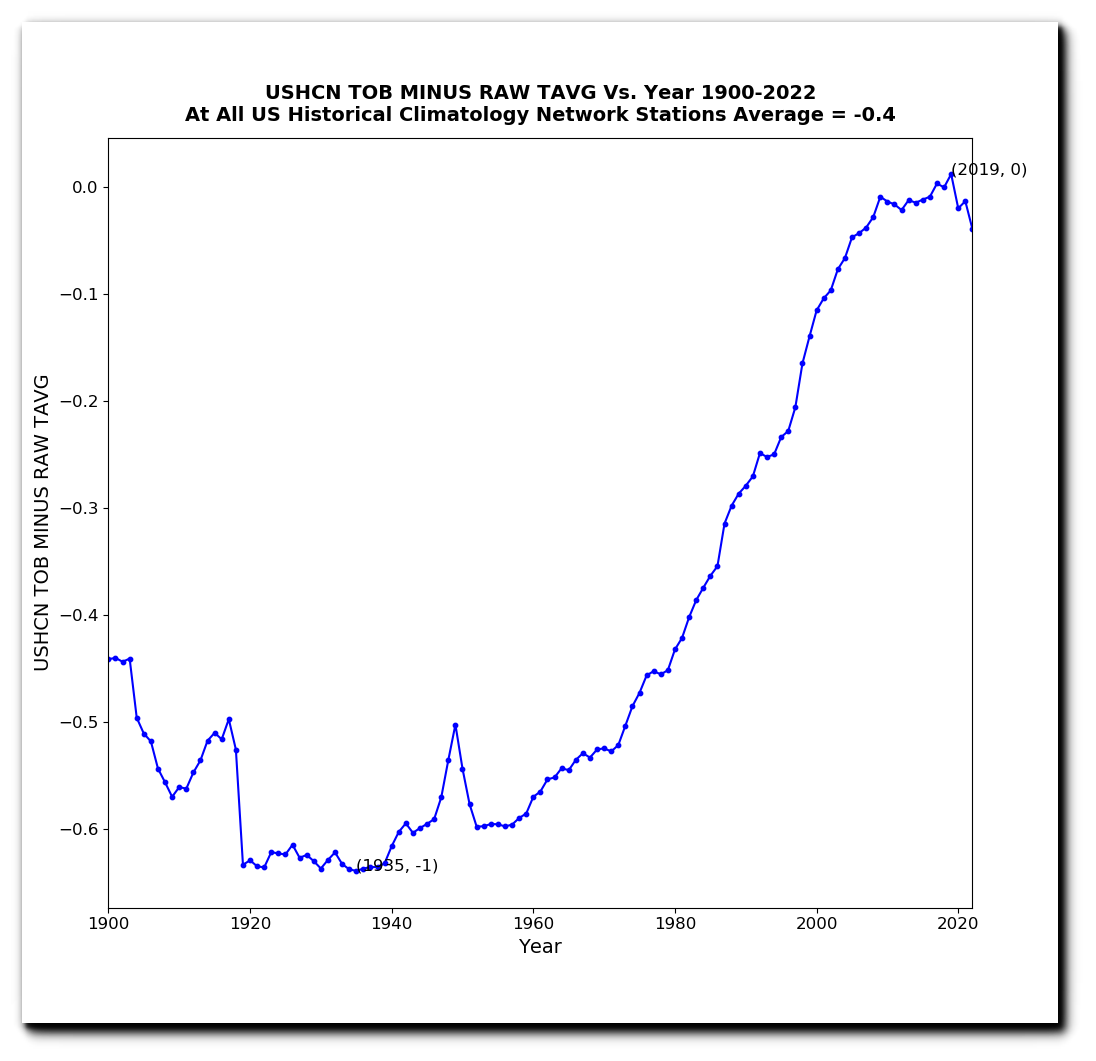
Now the adjustments are much larger.
The TOB adjustment has doubled in size and no longer tails off after 1990.
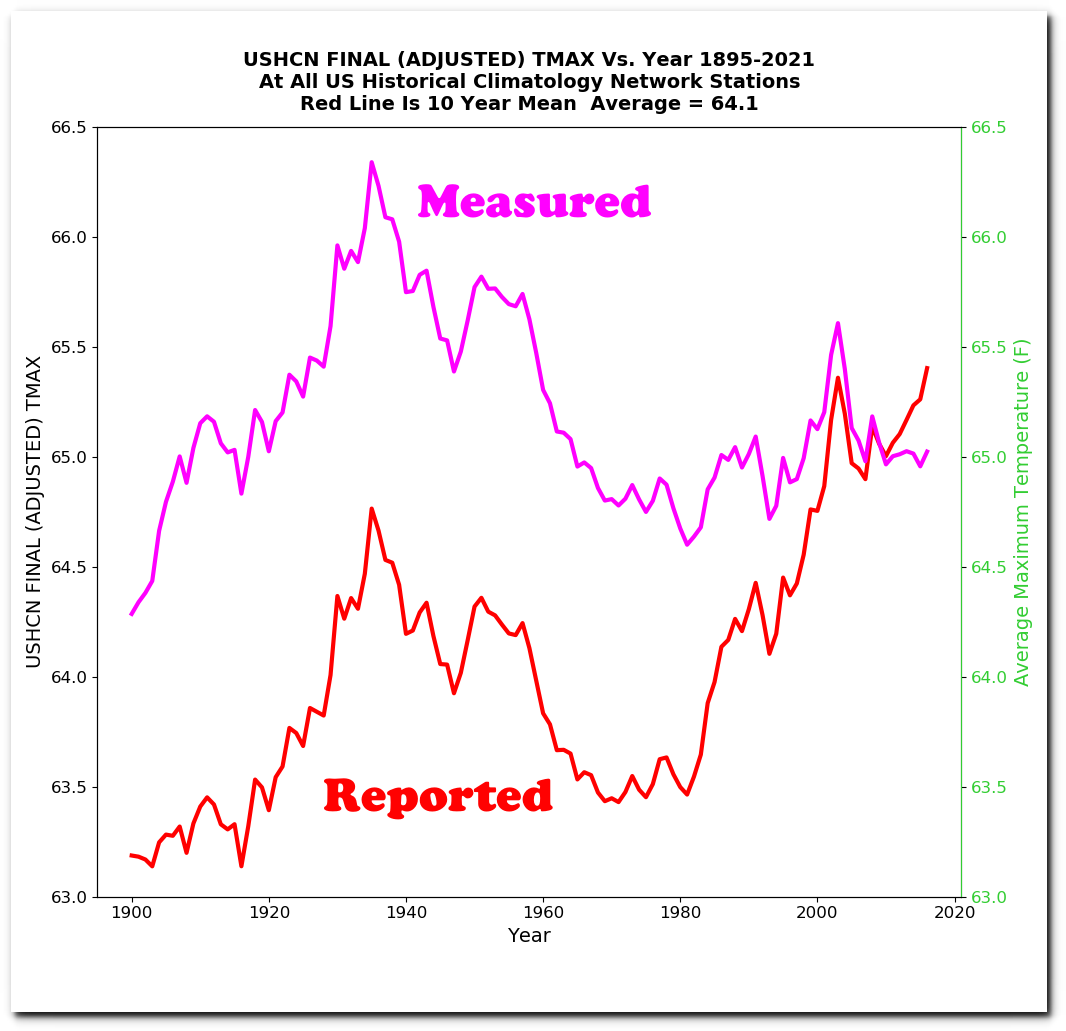
Here are the specifics of the current adjustments for maximum temperature.
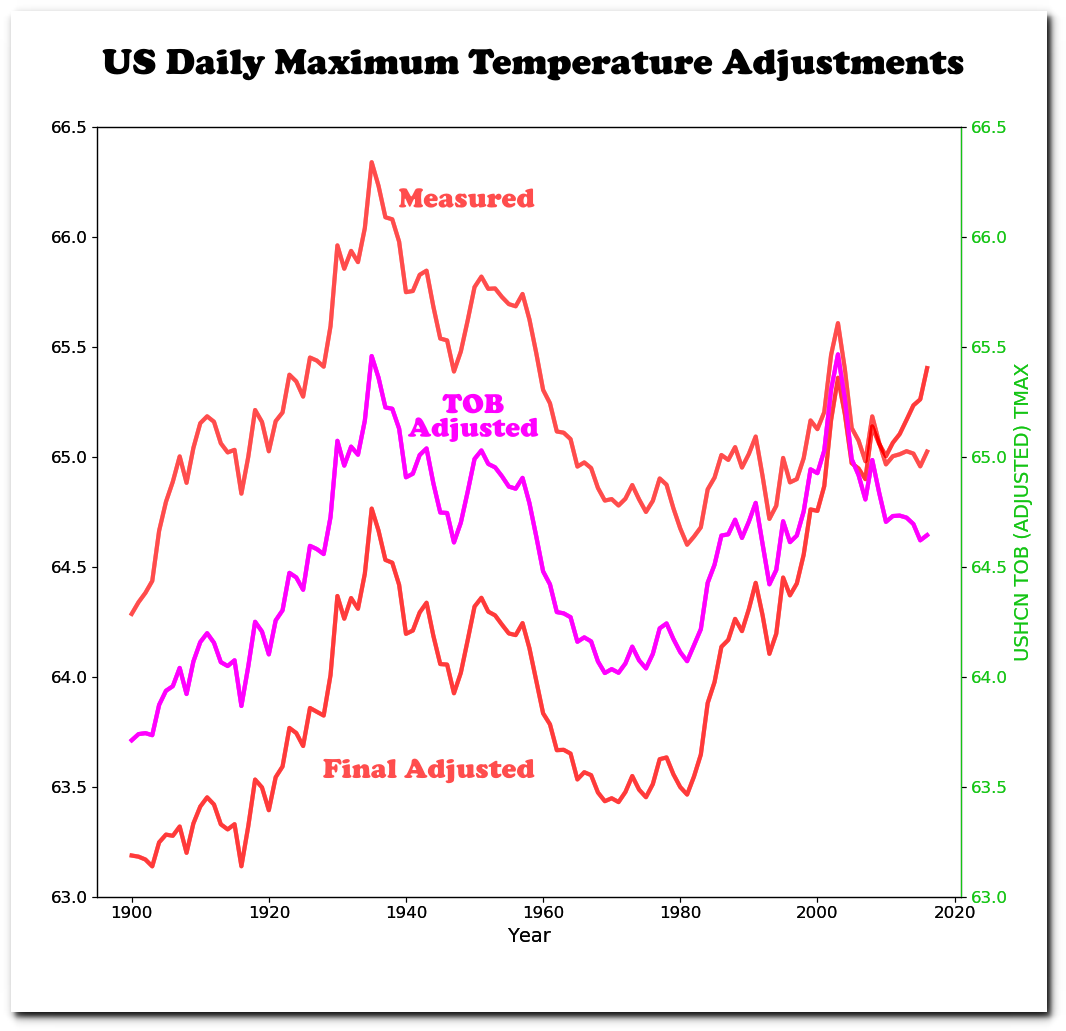
ftp://ftp.ncdc.noaa.gov/pub/data/ushcn/v2.5/ushcn.tmax.latest.FLs.52j.tar.gz
ftp://ftp.ncdc.noaa.gov/pub/data/ushcn/v2.5/ushcn.tmax.latest.tob.tar.gz
ftp://ftp.ncdc.noaa.gov/pub/data/ushcn/v2.5/ushcn.tmax.latest.raw.tar.gz
I used a simple average of the data per year to generate these graphs. People have complained that the data needs to be gridded because of uneven distribution of stations, but the data doesn’t support that idea, NOAA temperature graphs are almost identical to the average of the final adjusted data set.
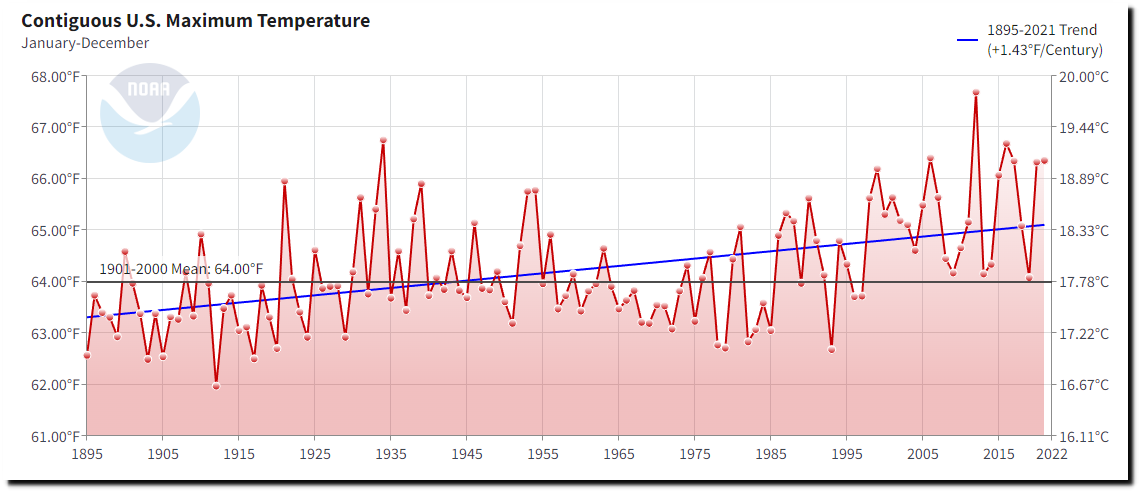

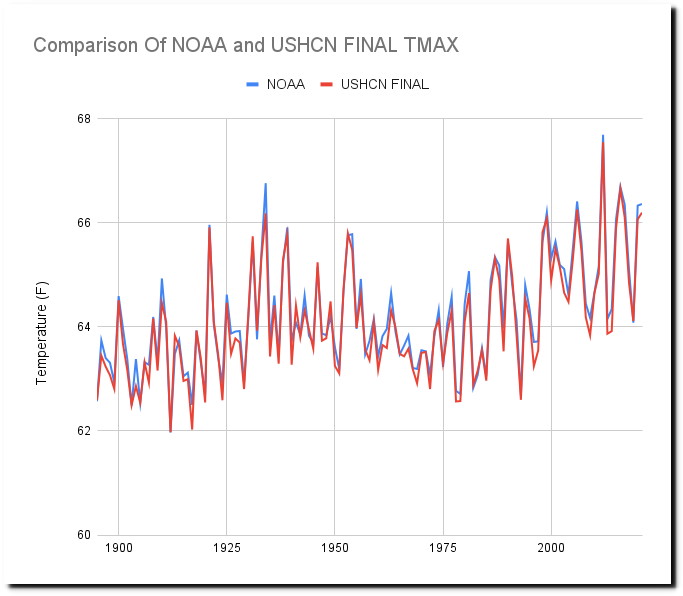
National Time Series | Climate at a Glance | National Centers for Environmental Information (NCEI)
ftp://ftp.ncdc.noaa.gov/pub/data/ghcn/daily/ghcnd_hcn.tar.gz

