Steve do you know of any data similar to this for the Canadian prairie. I know they are haveing trouble getting crops in due to rain and cold. Alao 3 days ago there was a widespread creeze in Alberta and Manitoba.
Anecdotal only, but, sure seems like the coldest year to-date. Cut off the air conditioning today as early morning temps were 65 deg in the Dallas Tx area this morning. Had the air on b/c of the high humidities the past week or so. Have not seen this kind of year that I can recall in Texas (something over 35 years now) … Sure hope this weather pattern continues through the weekend because of outside events: Hamcom-convention and Field day. ‘Field days’ (a ‘ham’ radio thing) are notoriously HOT (and sticky) in Texas …
Also consider that it snow in Cairo this winter first time in over a hundred years yet somehow we are in the warmest decade ever, that may be true for the data the have manipulated in their computers but I don’t think it is true for the real world, I just wonder if the Thames freeze over again will that be written up as local weather and will the warming be found once again in Siberia.
A Cold Wave Kills 6 Million Fish in Eastern Bolivia province of Santa Cruz . http://www.laht.com/article.asp?ArticleId=361753&CategoryId=14919 “The cold wave that gripped the Southern Cone of South America last month caused a severe drop in temperatures in southern and eastern Bolivia, even falling below 0 C (32 F) in areas where the thermometer is usually above 20 C (68 F).”
That’s a nice graph, but I have a challenge for you: Can you tell me the “average temperature” for every year in that graph? Lets lock it down, so next time you guys “adjust” something, and I ask you, you get to tell me that 1950 is .2 degrees colder than the last time you told me. So Zeke: what are the “average temperatures” for the years in that graph you link to?
It doesn’t matter because it’s completely meaningless unless there is an actual “average temperature”. It’s an anomaly. An anomaly from…. something. It’s an anomaly from an “average temperature” over a “period of years”. Pick a different period, and magically it’s a different number. Anomalies are bogus UNLESS the actual “average temperature” for that year is included. Because then we can see just how the “average temperature” is being changed every time they change the “adjustments”. Then you can look at different “periods of years” and have something to hold on to. It’s why no one will ever answer my simple question: what was the “average temperature”? Because the anomaly allows them to change the “average temperature” and have no consequences.
Ah yes, and most of south florida should also be under water, as is most of eastern seaboard and all other coastal areas. Funny how Ft. Pickens, built on the beach 3′ above sealevel 200 years ago is still at 3′ above sea level.
Interesting question. According to NOAA, the freezing temperature in NC this winter went up several degrees (according to Gail Combs who reports massive snow accumulations with the temperatures approaching 40 according to the weather service). So that is why there was so much ice. Now they have changed the freezing point of water.
They musta had an enormous amount of extra sodium chloride laying around, as thats the only substance I know that lowers the actual freezing point of water…by 50 degrees F btw.
Shorter Zeke: I don’t know shit about science, but here’s a Science™ I think is right. You guys with your measuring stuff confuse me, why can’t you just accept a Science™!?
CHAOS and FEAR that Earth might be converted into a star by uncontrolled release of nuclear energy in late August 1945 convinced world leaders to “save the world from nuclear annihilation” by:
1. Uniting all nations under the UN on October 23, 1945
2. Forbidding public knowledge of energy (E) stored as mass (m) in cores of
_ a.) Heavy atoms like Uranium
_ b.) Some planets like Jupiter
_ c.) Ordinary stars like the Sun
_ d.) Galaxies like the Milky Way
_ e.) The expanding Universe
Can we all work toward peaceful reconciliation and healing of bruised egos by acknowledging that world leaders had legitimate reason to believe in August 1945 that Earth might be destroyed in the manner that Aston described in the last paragraph of his Nobel Prize Lecture on 12 December 1922?
Whats interesting to me is that the Seattle area is having a very warm year compared to every other year I’ve been here, we had weather pushing the 80’s in late april, which is normally reserved for our August “heat wave”. My garden is doing great this year, probably 2 months ahead of previous years.
The last 7 years or so have all been well below average temperature and its nice to finally get some of that “global warming” love.
Is it only a matter of time before global cooling is the rage again? 🙂
BTW I validated/replicated your 40% estimation result for 2014 data, and posted my code, see here. Pretty trivial, I got 43% so maybe we did something a little different, or you rounded.
What a load of crap… NOAA… what lame explanation do they give for lopping off data from ANY Station? Seems they just keep rounding up… now we have “Climate Change” based on a model, not reality nor actual data. Seems this latest warm point since the 70’s is no different or out of the norm than the 30’s warm decade…
So what? Progressives want us to change our entire lifestlye based on this?? Tax more?? Complete garbage..
I assume in those cases the data is just missing. Presumably the latest dates have the most holes, as data trickles in late.
Really I’m astounded how primitive this data handling is. Tens of billions per year in climate change science funding, and this is how they publish their data? Really? I mean come on, publish in a format that wasn’t obsolete before I was born.
Well, Californians are whining if it is cool and rainy with mudslides, or hot and dry with wildfires. How easy it is to forget the earthquakes. Oh, the good ol’ days.
They have the best overall climate in the 48 states, and yes they love to whine! I did not hear them whining it was too cold when the rest of us were shivering to death. But they were whining about the rain. 😉
The first half of December was quite cold, with many areas reporting a freeze. The remainder of the month was seasonable, and while this year has been on the dry side, the weather otherwise was and still is pretty decent.
For those not aware; NOAA uses the Tom Peterson study on UHI to justify not making any UHI adjustments to it’s temperature record. Years ago Steve McIntyre did an audit of this paper and showed how flawed this study was. Go to http://climateaudit.org/2007/08/04/1859/ to see what Steve McIntyre did to show how totally wrong this paper is in evaluating the effects of UHI. What is very obvious from Steve’s work is how much effect UHI does have and just using rural records shows no CAGW or even AGW. As obvious as the conclusions that Steve Mc made; NOAA chooses to make no adjustment for UHI. This tells me that NOAA is only interested in continuing the CAGW meme and not in climate truth.


Those good old days.
http://i.imgur.com/CMHiMjl.png
You mean the gold ol’ days when they claimed someone’s age as being different to what it actually is? Oh, wait; that still happens.
She doesn’t turn 50 for another 9 years.
Steve do you know of any data similar to this for the Canadian prairie. I know they are haveing trouble getting crops in due to rain and cold. Alao 3 days ago there was a widespread creeze in Alberta and Manitoba.
Creeze: Definition 1-Style, Swag, makin’ it your own.
Examples: ‘Check out our creeze.’
‘It’s all about my creeze.’
‘She’s creezy.’
Widespread style alert! It’s worse than we thought. 😉
“Pedant check, aisle one …”
Attention associates, cleanup is needed in the humorless aisle! 😉
I applied humor, a very very dry humor!
No, its not the coldest year to-date. You are just doing it wrong.
http://www.ncdc.noaa.gov/temp-and-precip/national-temperature-index/time-series?datasets%5B%5D=uscrn&datasets%5B%5D=cmbushcn¶meter=anom-tavg&time_scale=ytd&begyear=1900&endyear=2014&month=4
Anecdotal only, but, sure seems like the coldest year to-date. Cut off the air conditioning today as early morning temps were 65 deg in the Dallas Tx area this morning. Had the air on b/c of the high humidities the past week or so. Have not seen this kind of year that I can recall in Texas (something over 35 years now) … Sure hope this weather pattern continues through the weekend because of outside events: Hamcom-convention and Field day. ‘Field days’ (a ‘ham’ radio thing) are notoriously HOT (and sticky) in Texas …
Thermometers are anecdotal. Adjustments are Good Science™.
Good point, I forgot to fabricate 40% of the data, and fail to properly adjust for UHI like NOAA does.
I did that ridiculous thing of actually averaging the thermometer data, and reporting the average.
And please, please don’t forget to submit fabrication to NCDC…..for the chilruns’
Studies show modern alarm clocks have steadily decreased their standard snooze times, leading to spurious cooling that must be adjusted for.
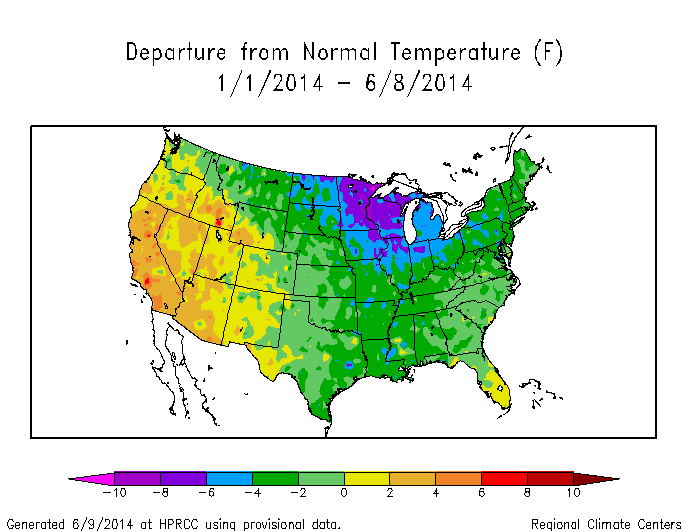
Using a simple average of absolute temperatures results in the cold year being the one where the Great Lakes froze over.
Using anomaly analysis with fill in values and adjustments results in the Great Lakes freezing over in what would otherwise be quite a normal year.
Also consider that it snow in Cairo this winter first time in over a hundred years yet somehow we are in the warmest decade ever, that may be true for the data the have manipulated in their computers but I don’t think it is true for the real world, I just wonder if the Thames freeze over again will that be written up as local weather and will the warming be found once again in Siberia.
Not to mention European Alpine Ski Resorts have been cooling for some years:
https://tallbloke.wordpress.com/2014/05/27/european-alpine-ski-resort-been-cooling-for-some-years/
And the Black Sea froze
http://englishrussia.com/2012/02/02/the-black-sea-got-frozen/
A Cold Wave Kills 6 Million Fish in Eastern Bolivia province of Santa Cruz .
http://www.laht.com/article.asp?ArticleId=361753&CategoryId=14919
“The cold wave that gripped the Southern Cone of South America last month caused a severe drop in temperatures in southern and eastern Bolivia, even falling below 0 C (32 F) in areas where the thermometer is usually above 20 C (68 F).”
The First Time Occured, Snow Storm Hits West Sumatra
http://4myindonesia.wordpress.com/2012/03/29/the-first-time-occured-snow-storm-hits-west-sumatra/
That’s a nice graph, but I have a challenge for you: Can you tell me the “average temperature” for every year in that graph? Lets lock it down, so next time you guys “adjust” something, and I ask you, you get to tell me that 1950 is .2 degrees colder than the last time you told me. So Zeke: what are the “average temperatures” for the years in that graph you link to?
Zeke, is that adjusted data or actual readings?
It doesn’t matter because it’s completely meaningless unless there is an actual “average temperature”. It’s an anomaly. An anomaly from…. something. It’s an anomaly from an “average temperature” over a “period of years”. Pick a different period, and magically it’s a different number. Anomalies are bogus UNLESS the actual “average temperature” for that year is included. Because then we can see just how the “average temperature” is being changed every time they change the “adjustments”. Then you can look at different “periods of years” and have something to hold on to. It’s why no one will ever answer my simple question: what was the “average temperature”? Because the anomaly allows them to change the “average temperature” and have no consequences.
According to the same organization … your house was supposed to be under water since 2008 …
How are you able to live underwater like that?
Ah yes, and most of south florida should also be under water, as is most of eastern seaboard and all other coastal areas. Funny how Ft. Pickens, built on the beach 3′ above sealevel 200 years ago is still at 3′ above sea level.
If this year was just slightly colder than normal, why was there so much ice on the great lakes? Was the water freezing at the wrong temperature?
Interesting question. According to NOAA, the freezing temperature in NC this winter went up several degrees (according to Gail Combs who reports massive snow accumulations with the temperatures approaching 40 according to the weather service). So that is why there was so much ice. Now they have changed the freezing point of water.
They musta had an enormous amount of extra sodium chloride laying around, as thats the only substance I know that lowers the actual freezing point of water…by 50 degrees F btw.
They did not lower it, they raised it.
The Great Lakes were officially “Ice Free” as of June 7. http://www.dailymail.co.uk/sciencetech/article-2653519/Winter-Forecasters-reveal-Great-Lakes-FINALLY-ice-free-record-breaking-seven-months-frozen.html
For some reason that didn’t make the news…..
{puzzled look}
Shorter Zeke: I don’t know shit about science, but here’s a Science™ I think is right. You guys with your measuring stuff confuse me, why can’t you just accept a Science™!?
Science is to obeyed, never questioned.
I appreciate your insight, Steven.
CHAOS and FEAR that Earth might be converted into a star by uncontrolled release of nuclear energy in late August 1945 convinced world leaders to “save the world from nuclear annihilation” by:
1. Uniting all nations under the UN on October 23, 1945
2. Forbidding public knowledge of energy (E) stored as mass (m) in cores of
_ a.) Heavy atoms like Uranium
_ b.) Some planets like Jupiter
_ c.) Ordinary stars like the Sun
_ d.) Galaxies like the Milky Way
_ e.) The expanding Universe
Can we all work toward peaceful reconciliation and healing of bruised egos by acknowledging that world leaders had legitimate reason to believe in August 1945 that Earth might be destroyed in the manner that Aston described in the last paragraph of his Nobel Prize Lecture on 12 December 1922?
http://tgrule.com/2014/06/10/1984-has-arrived-the-witch-hunt-against-independent-research-and-analysis/
Whats interesting to me is that the Seattle area is having a very warm year compared to every other year I’ve been here, we had weather pushing the 80’s in late april, which is normally reserved for our August “heat wave”. My garden is doing great this year, probably 2 months ahead of previous years.
The last 7 years or so have all been well below average temperature and its nice to finally get some of that “global warming” love.
Probably as a result of all the hot air being spewed by the ppl there.
Not even close! But please do not change it! We have had a wonderful spring (although a friend in California is whining). 😉
Is it only a matter of time before global cooling is the rage again? 🙂
BTW I validated/replicated your 40% estimation result for 2014 data, and posted my code, see here. Pretty trivial, I got 43% so maybe we did something a little different, or you rounded.
http://stevengoddard.wordpress.com/2014/06/07/noaa-is-losing-colder-station-data/#comment-366082
What a load of crap… NOAA… what lame explanation do they give for lopping off data from ANY Station? Seems they just keep rounding up… now we have “Climate Change” based on a model, not reality nor actual data. Seems this latest warm point since the 70’s is no different or out of the norm than the 30’s warm decade…
So what? Progressives want us to change our entire lifestlye based on this?? Tax more?? Complete garbage..
I assume in those cases the data is just missing. Presumably the latest dates have the most holes, as data trickles in late.
Really I’m astounded how primitive this data handling is. Tens of billions per year in climate change science funding, and this is how they publish their data? Really? I mean come on, publish in a format that wasn’t obsolete before I was born.
NOOA admitted this year to fudging the numbers to make it appear to be warming.
Well, Californians are whining if it is cool and rainy with mudslides, or hot and dry with wildfires. How easy it is to forget the earthquakes. Oh, the good ol’ days.
They have the best overall climate in the 48 states, and yes they love to whine! I did not hear them whining it was too cold when the rest of us were shivering to death. But they were whining about the rain. 😉
The first half of December was quite cold, with many areas reporting a freeze. The remainder of the month was seasonable, and while this year has been on the dry side, the weather otherwise was and still is pretty decent.
For those not aware; NOAA uses the Tom Peterson study on UHI to justify not making any UHI adjustments to it’s temperature record. Years ago Steve McIntyre did an audit of this paper and showed how flawed this study was. Go to http://climateaudit.org/2007/08/04/1859/ to see what Steve McIntyre did to show how totally wrong this paper is in evaluating the effects of UHI. What is very obvious from Steve’s work is how much effect UHI does have and just using rural records shows no CAGW or even AGW. As obvious as the conclusions that Steve Mc made; NOAA chooses to make no adjustment for UHI. This tells me that NOAA is only interested in continuing the CAGW meme and not in climate truth.
Thanks for sharing!