Gavin quietly says that there is a 62% chance that 2014 was not the warmest year on record, but he had to give his boss a talking point for the State of the Union address this week.
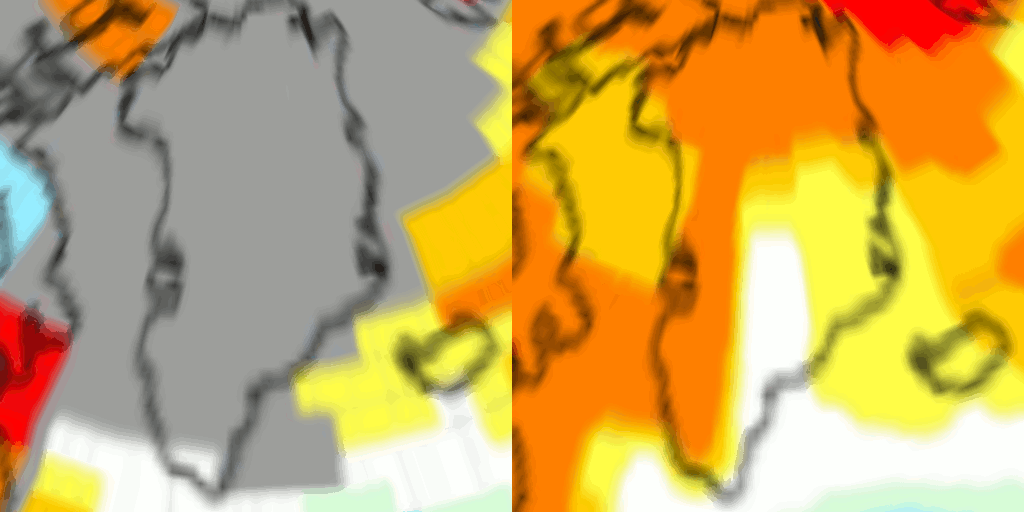
So Gavin simply fabricated warm temperatures across huge areas like Greenland, where he had no actual thermometer data in December.
Gavin showed much of western Greenland 1-2C above normal, when it was actually 2C below normal. It doesn’t take a lot of that sort of cheating to get temperatures up 0.02 globally.
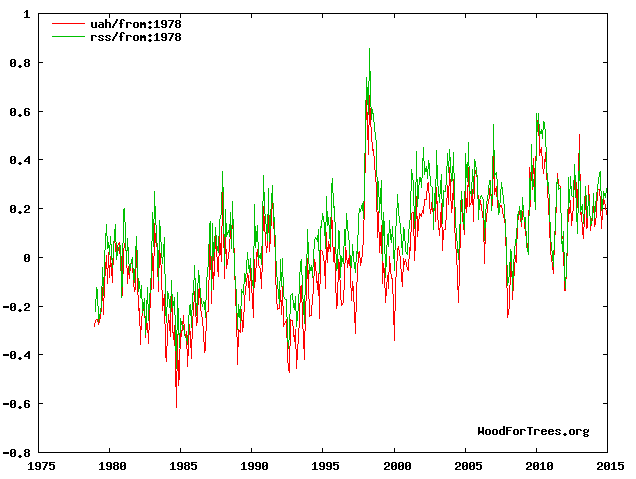
There is only one chance in 27 million that there is a smidgen of truth to the hottest year ever claim.


We spent centuries building a global network, just to have these lunatics tear down virtually the entire thing in a couple of decades. Gavin and the Fourth Reich are mass rapists of data, and mass murderers of stations.
https://www.youtube.com/watch?v=58mDaK9bH5o
And their beloved 0.002º hike is ridiculous. Talk about insane. Oooh…a heat wave indeed!
I was in Congo and Malawi last year for 2 weeks and my iPhone weather app consistently had the temp at least 4 degrees higher than what it actually was. Made me wonder where these apps get there data from.
You may be a Global Warming Denier if you don’t demand that the human population be reduced from over seven billion to under a quarter million by 20 January 2001–when the tipping point has been reached and all hope is lost…
Don’t forget, the surviving quarter million will be 1% ruling elite, 4% “overseers” and 95% “persons without rights, only privileges.” What these privileges will be is to be determined after the 1% redistribute all the money (will money have meaning in such a devastated world?)
OBama is merely getting what he paid for. It has noting to do with science or facts.
If there was no thermometer data for the area, how do you know it was 2 degrees cooler?
Twilight zone music playing in the background
Ever hear of something called a ‘Satellite”?
“In the context of spaceflight, a satellite is an artificial object which has been intentionally placed into orbit. Such objects are sometimes called artificial satellites to distinguish them from natural satellites such as the Moon.
The world’s first artificial satellite, the Sputnik 1, was launched by the Soviet Union in 1957. Since then, thousands of satellites have been launched into orbit around the Earth. Some satellites, notably space stations, have been launched in parts and assembled in orbit. Artificial satellites originate from more than 40 countries and have used the satellite launching capabilities of ten nations. A few hundred satellites are currently operational, whereas thousands of unused satellites and satellite fragments orbit the Earth as space debris. A few space probes have been placed into orbit around other bodies and become artificial satellites to the Moon, Mercury, Venus, Mars, Jupiter, Saturn, Vesta, Eros, and the Sun.
Satellites are used for a large number of purposes. Common types include military and civilian Earth observation satellites, communications satellites, navigation satellites, weather satellites, and research satellites. Space stations and human spacecraft in orbit are also satellites. Satellite orbits vary greatly, depending on the purpose of the satellite, and are classified in a number of ways. Well-known (overlapping) classes include low Earth orbit, polar orbit, and geostationary orbit.”
http://en.wikipedia.org/wiki/Satellite
It is too bad you feel the need to attack with sarcasm.
It is too bad you do not think before commenting. Also too bad you are incapable of laughing at yourself, it is unhealthy.
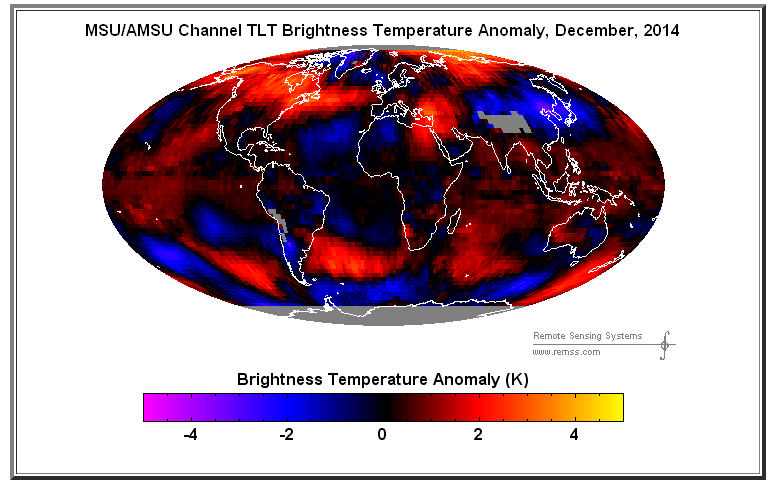
If you had bothered to go to the remss website you would have found out how they got the data. I was sure it was satellite data but not 100% sure so I checked out the home page to make sure.
He answered your question. It was not an attack unless you think knowledge is attacking your ignorance.
Are you the same P Geyer who posted this question earlier?
P Geyer says: “If there was no thermometer data for the area, how do you know it was 2 degrees cooler?”
WHO says there was no DATA?
For those interested Verity Jones used some of the work done by E.M. Smith.
Links to a couple of the many many articles written by E.M.
The Station count vs dT graph (modified) comes from:
https://chiefio.wordpress.com/2010/03/16/north-america-flat-canada-not-so-much/
Frozen North, Dominated by Canada and Russia:
A lot of information of the fudging including a link to the paper from the Russians protesting the fudging of their data to show warming.
https://chiefio.wordpress.com/2009/10/27/ghcn-up-north-blame-canada-comrade/
GIStemp GHCN Selection Bias Measured 0.6 C
https://chiefio.wordpress.com/2009/11/07/gistemp-ghcn-selection-bias-measured-0-6-c/
This deals mostly with the station selection in California where E.M. Lives.
My white clover agrees with E.M.’s tomatoes. I have lived in mid NC for over twenty years. 2013 and 2014 are the first two years my clover has been green and blooming all though the summer instead of brown and dead/dormant. The lack of tomatoes setting fruit has been observed and discussed by skeptics throughout the world in the last few years. (Go look up Köppen climate classification)
Don’t worry, it’s only a temperature sausage from GIStemp
http://en.wikipedia.org/wiki/File:Sausage_making-H-1.jpg
OH, and speaking of data overlooked by the ClimAstrologists one should also mention Frank Lansner et al. and The Original Temperature Project
Frank’s Website.
Australia and New Zealand also have people exposing“The Goat Ate my Data” Russia and China have already called the global temperature record bogus, India has tossed Greenpeace agitators out on their ear, the Russians jailed Greenpeace and the Peruvians are out for their blood.
How many of the old Russian Stations are no longer operating?
What about the phantom stations in the USA.
“If there was no thermometer data for the area, how do you know it was 2 degrees cooler?”
And how did Gavin know it was 2C warmer?
FFS PG, think before you make silly comments !!
Try to understand that blue and red pictre as well..
Good point. If there are no thermometers and that means no temperature readings, there should be a lot of blank areas, which Gavin did not mention either. (Yes, I know there are satellites, but your point about no one being able to know was very good.)
Satellite data and ice cover makes it obvious. Plus the fact that all of Eastern North America is also record cold.
Coincidence that the area with by far the most gauges per square mile showed mostly cooling in 2014 (USA), while vast swaths with no gauges almost universally showed heat spikes? Only if you’re naive beyond belief.
Why is the baseline 1951 -1980 on the NASA map? This goes against all standard climatology.
And will obviously jack up the temperature Ananimoly.
For example if the baseline period was 1980-2010 which should be the standard 30 year period everything will be MUCH cooler ?
That is a valid point, but as it turns out it makes almost no difference
http://data.giss.nasa.gov/tmp/gistemp/NMAPS/tmp_GHCN_GISS_ERSST_1200km_Anom12_2014_2014_1980_2000_CE/nmaps.gif
Actually, it does. RSS has a base period of 1981-2010, not 2000 as in your plot.
I hope Gavin Schmidt will be doing a lot of time, just like Michael Mann. I can’t wait to hear that news.
A start would be for this new Rep controlled Congress to cut GISS funding. You on board Senator Inhofe?
okay, dummy question here:
What I am looking at? Are these the differences in measuring the altitude?
Vs.
1200km high in the atmosphere!? No. That would be the smoothing radius.
Thanks.
Don’t you know you can’t trust a satellite to show what is actually happening with the OLR?
In other words, it was the hottest year, but I’m probably wrong. Even if right, who cares? Amazing how people get all worked up over a hundreth of a degree even if one could actually believe such accuracy is possible. Its all so surreal.
So they only used data from 3000 stations to arrive at a world temp. Out of how many and where? Why only 3000? Pick a different set and there would be cooling. Its an obvious deception when the uncertainity is not made public. Even the current uncertain rates would only produce 1 degree by 2100, far below predictions and no catastrophe. “What fools these mortals be.”
Amazing to watch some defend the “experts” who themselves aren’t sure.
http://www.dailymail.co.uk/news/article-2915061/Nasa-climate-scientists-said-2014-warmest-year-record-38-sure-right.html
@Steve It actually makes quite a significant difference…. relatively speaking.
Look in the top right hand corner of the map. Based on 1980-2000 its just 0.45.
Based on 1951-1980 its 0.73
The hottest year “Ever” claims are based on the figure of 0.73 which is 0.02 Higher than 2005 or whatever.
But if you shift the 30 year base line, this figure drops massively, and blowing a huge hole in the claims.
It would seem that using the 1980 to 2010 average would make the anomaly smaller, since the temperatures have flattened out for at least half that period. Also, the average should be higher (by a fraction of a degree, probably) and the anomaly smaller. What am I missing here?
Reblogged this on Globalcooler's Weblog.
I’m rooting for global warming. Buy real estate in Greenland and Northern Canada now and make a bundle later.
Gavin will be in Durham, NC this Friday. Is anyone here planning to attend? If so, please contact me.
http://nicholas.duke.edu/upcoming-events/eos-seminar-gavin-schmidt-nasa-giss