Disrupting the Borg is expensive and time consuming!
Google Search
-
Recent Posts
- Gaslighting 1924
- “Why Do You Resist?”
- Climate Attribution Model
- Fact Checking NASA
- Fact Checking Grok
- Fact Checking The New York Times
- New Visitech Features
- Ice-Free Arctic By 2014
- Debt-Free US Treasury Forecast
- Analyzing Big City Crime (Part 2)
- Analyzing Big City Crime
- UK Migration Caused By Global Warming
- Climate Attribution In Greece
- “Brown: ’50 days to save world'”
- The Catastrophic Influence of Bovine Methane Emissions on Extraterrestrial Climate Patterns
- Posting On X
- Seventeen Years Of Fun
- The Importance Of Good Tools
- Temperature Shifts At Blue Hill, MA
- CO2²
- Time Of Observation Bias
- Climate Scamming For Profit
- Climate Scamming For Profit
- Back To The Future
- “records going back to 1961”
Recent Comments
- Bob G on Gaslighting 1924
- conrad ziefle on Gaslighting 1924
- Bob G on Gaslighting 1924
- Bob G on Gaslighting 1924
- arn on Gaslighting 1924
- conrad ziefle on Gaslighting 1924
- Gordon Vigurs on Gaslighting 1924
- conrad ziefle on Gaslighting 1924
- Robertvd on Gaslighting 1924
- conrad ziefle on Gaslighting 1924
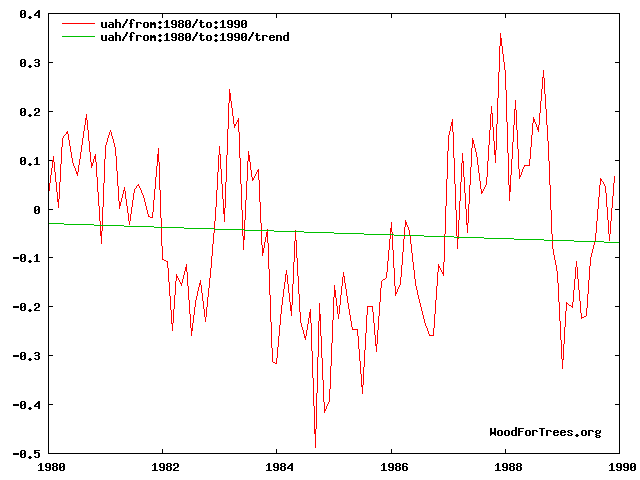
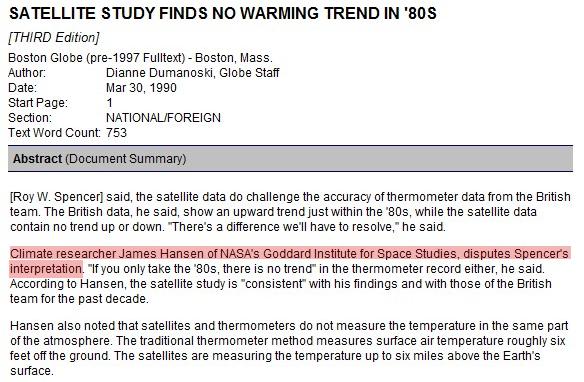
1990 : “SATELLITE STUDY FINDS NO WARMING TREND IN ’80S”
This entry was posted in Uncategorized. Bookmark the permalink.


Steve can you whip up a current giss graph and highlight the 1980-90 section. Lets see if Jimmy has been playing with his numbers.
In fact i just did it at woodfor, GISS shows a rise of 0.05Deg
The Al-Gore-rhythm they use for the models that provide the latest extrapolated surface temperatures results makes historic temperatures flexible rather than consistent as would be seen in world measurements. It is not only GISS as the pracitce goes back to the GHCN and USHCN from which other groups get their starting data to be interpreted by each groups “Independent” Method!
Considering all these datasets require some type of “homogenization” before the results are shown, I figured there was manipulation from the start. The raw data somehow isn’t accurate because it shows there was no warming? Amazing, the duplicity.
Now if only NASA will work on that pesky DJIA graph and hide those declines. Save us Jimmy!!!