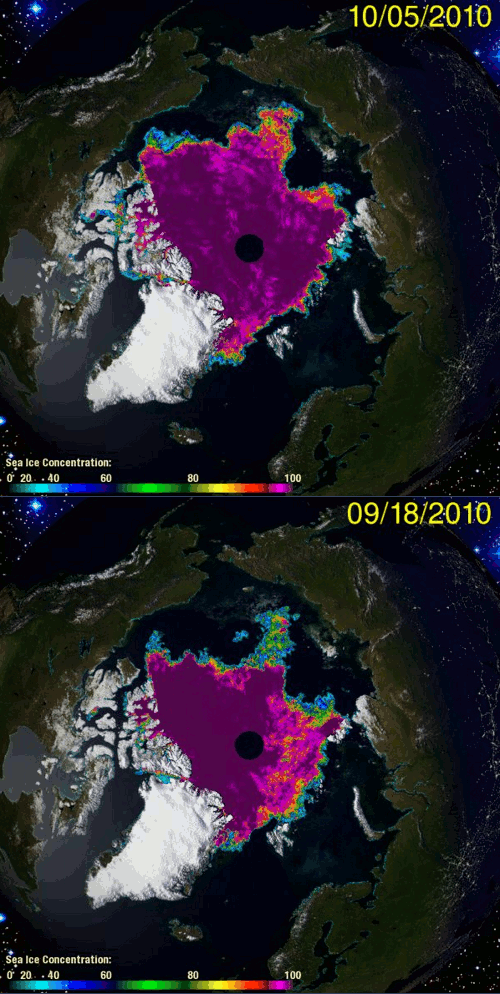
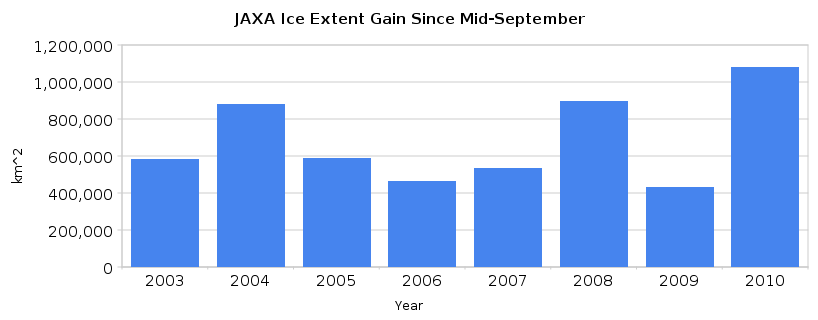
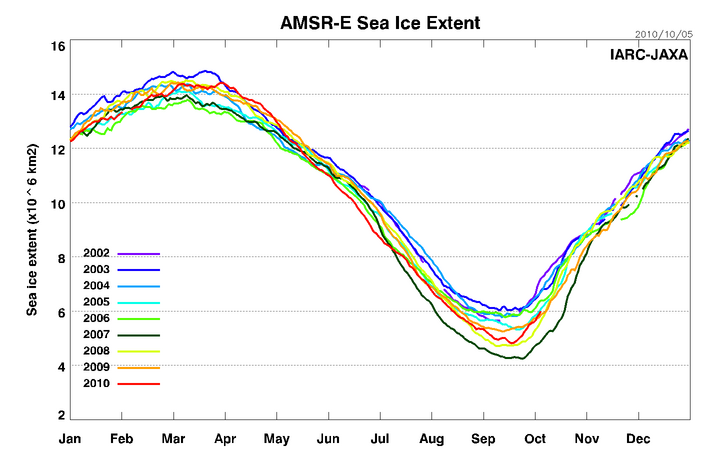
Since mid-September, JAXA ice extent has gained more than one million km² That is more than 18,000 Manhattans, or one new Manhattan of ice forming every minute and a half. This is the fastest gain for the period in the JAXA record.
Ice extent is now almost back to 2005 levels.
http://www.ijis.iarc.uaf.edu/seaice/extent/AMSRE_Sea_Ice_Extent.png
We are told that the ice is the thinnest on record and this is the hottest year on record, and now NSIDC tells us that the majority of the multi-year ice near the pole disappeared during sub-freezing weather since the end of July.

I checked temperatures since the end of July at the PAWS North pole buoy. Only 10% of the readings have been above freezing, with the warmest being 1.2C. The coldest was -20.4C. They have only had two readings (out of 520) since the end of July above 1C.
Additionally, UIUC maps show that the pole started gaining ice by the first week in September.


Hi Steve,
While the blink comparion shows massive growth can you explain the comparison (thanks to Anthony Watts Sea Ice Page) shown in this link
( http://home.comcast.net/~ewerme/wuwt/cryo_compare.jpg ) with the gray areas in northern Canada and northern Russia? I assume these areas (2007 image) are land snow cover? Since it is so cold up north why dont we see the same or larger land snow cover areas?
Thanks in advance!
Mike,
UIUC used to put snow cover on their maps. I don’t know if they are doing that any more.
I’m curious how this multi-year ice dissappearance could even occur. If some of it remained, it is still multi-year ice, no? Even if it thinned. How do you a tell multi year ice chunk from a two year chunk… from orbit? How does the (presumably thicker) multi year chunk melt out whilst surrounded by thinner younger ice which remains? It defies the imagination. This appears to be a case of man’s effect on the arctic……via software algorithm (or arbitrary adjustment)
Antarctic sea ice extent still on the up as well!
http://nsidc.org/data/seaice_index/images/daily_images/S_timeseries.png
How do they determine how old arctic ice is?One piece of ice would look very much like any other I would think.
And now, and 20 years ago in the Arctic?
http://igloo.atmos.uiuc.edu/cgi-bin/test/print.sh?fm=10&fd=04&fy=1990&sm=10&sd=04&sy=2010
Not that much difference?
Note that 2002 had its JAXA minimum (minus the blackout Sept 12-21) on Sept 9 at 5646875 km^2 and on Oct 5 sat at 7194844 km^2, for an increase of 1547969 km^2…easily the largest in the JAXA record. Thus, I consider this year to be the second fastest extent gain in the JAXA record, though it is the largest in the JAXA record of full years.
A lot of people say these large extent gains are from dispersion, but it’s easy to put them in their place using the area figures. Since the CT area minimum, they show a gain of 1221379 km^2, which as of today is the largest in the last 10 years (and should stay that way for several days, as 2001, its closest competitor, had two poor days Oct 6 & 7 (though good days Oct 8-10).
-Scott
It was -42 C at the National Science Foundation’s Summit Observatory, 11,000 feet atop the Greenland ice sheet last night.
See AURORAS AND LASERS OVER GREENLAND:
http://spaceweather.com/
Just for 5 October, ice extent increased by approx 109,000 km², an area equal to the state of Tennessee. Or an area greater than 27 Rhode Islands (which is really not an island). [Just damn tired of hearing about that fleck of dust (Manhattan) that GISS infects.]
And CT area growth was 155794 km^2 for that single day. Likely due to increasing the concentration in lower concentration areas through refreezing (instead of compaction).
The JAXA extent/CT area ratio is currently 1.40, and it was 1.45 on the day of the extent minimum. Dang, all that dispersion is causing the skeptics to claim a rapid refreeze when there really isn’t one. 😉
-Scott
Remember that Manhattan went underwater in 2008!
So we have lots of disagreement on ice … the global warming faction first telling us that all the ice is melting, then saying that the ice growth in certain areas is due in fact to global warming. Read another article on ice growth in higher elevations of Greenland while ice lost at lower elevations. Clearly ice situation is odd with lots of disagreement same for Antarctic where you see articles on ice shelf metldown as well as Antarctic Ice Growing? I know some of this no doubt to which ice is being discussed as sea ice and land ice having 2 different values in the climate. And which ones included in which report. But funny stuff going on in the currents of the Great Ocean Conveyor as well. Back in July there was some sort of partial shutdown in Gulf stream I read. Far as I can see in imaging it has not recovered…Now we have EU in coldest winter in who knows how long. Some places having 100 yr low temps etc. Read water in Thames so cold they are worried all the pipes will start bursting ??? I have started a group called Abrupt Climate Change to explore the possibilities of an abrupt climate change occurrence. Plse join if you are truly interested and have something to contribute. Here is the link:
http://tech.groups.yahoo.com/group/abruptclimatechange/
And if you think the situation is new and limited to EU only…do a little searching and see last summer’s weather info for South America, Africa (esp. South) and Australia…all having record low temps and bitter cold, higher than normal deaths due to that as well. Over past few days say an article where sea life was washing up on Carolina coast in US said to be frozen to death, fish and starfish; this is where the Gulf Current is so how can this be? Has the cold current shifted as well…? If you have info plse join and post so we can all explore it.