[youtube=http://www.youtube.com/watch?v=ZvxbZTP6-ak]
Disrupting the Borg is expensive and time consuming!
Google Search
-
Recent Posts
- Gaslighting 1924
- “Why Do You Resist?”
- Climate Attribution Model
- Fact Checking NASA
- Fact Checking Grok
- Fact Checking The New York Times
- New Visitech Features
- Ice-Free Arctic By 2014
- Debt-Free US Treasury Forecast
- Analyzing Big City Crime (Part 2)
- Analyzing Big City Crime
- UK Migration Caused By Global Warming
- Climate Attribution In Greece
- “Brown: ’50 days to save world'”
- The Catastrophic Influence of Bovine Methane Emissions on Extraterrestrial Climate Patterns
- Posting On X
- Seventeen Years Of Fun
- The Importance Of Good Tools
- Temperature Shifts At Blue Hill, MA
- CO2²
- Time Of Observation Bias
- Climate Scamming For Profit
- Climate Scamming For Profit
- Back To The Future
- “records going back to 1961”
Recent Comments
- John Francis on “Why Do You Resist?”
- conrad ziefle on Gaslighting 1924
- Bob G on Gaslighting 1924
- Bob G on Gaslighting 1924
- Bob G on Gaslighting 1924
- conrad ziefle on Gaslighting 1924
- Bob G on Gaslighting 1924
- Bob G on Gaslighting 1924
- arn on Gaslighting 1924
- conrad ziefle on Gaslighting 1924


How can we be sure the satellites aren’t just mistaking poley bear carcasses for ice?
Area is also tracking in the same direction.
Steve has done a great job this summer, handling all the alarmist true believers that have doubted him every step of the way.
I hope you don’t mean me in one of those alarmists. I would rather not think of Steve handling me, it conjurs up images of airport security and my sacks being sqeezed!
😀
Andy
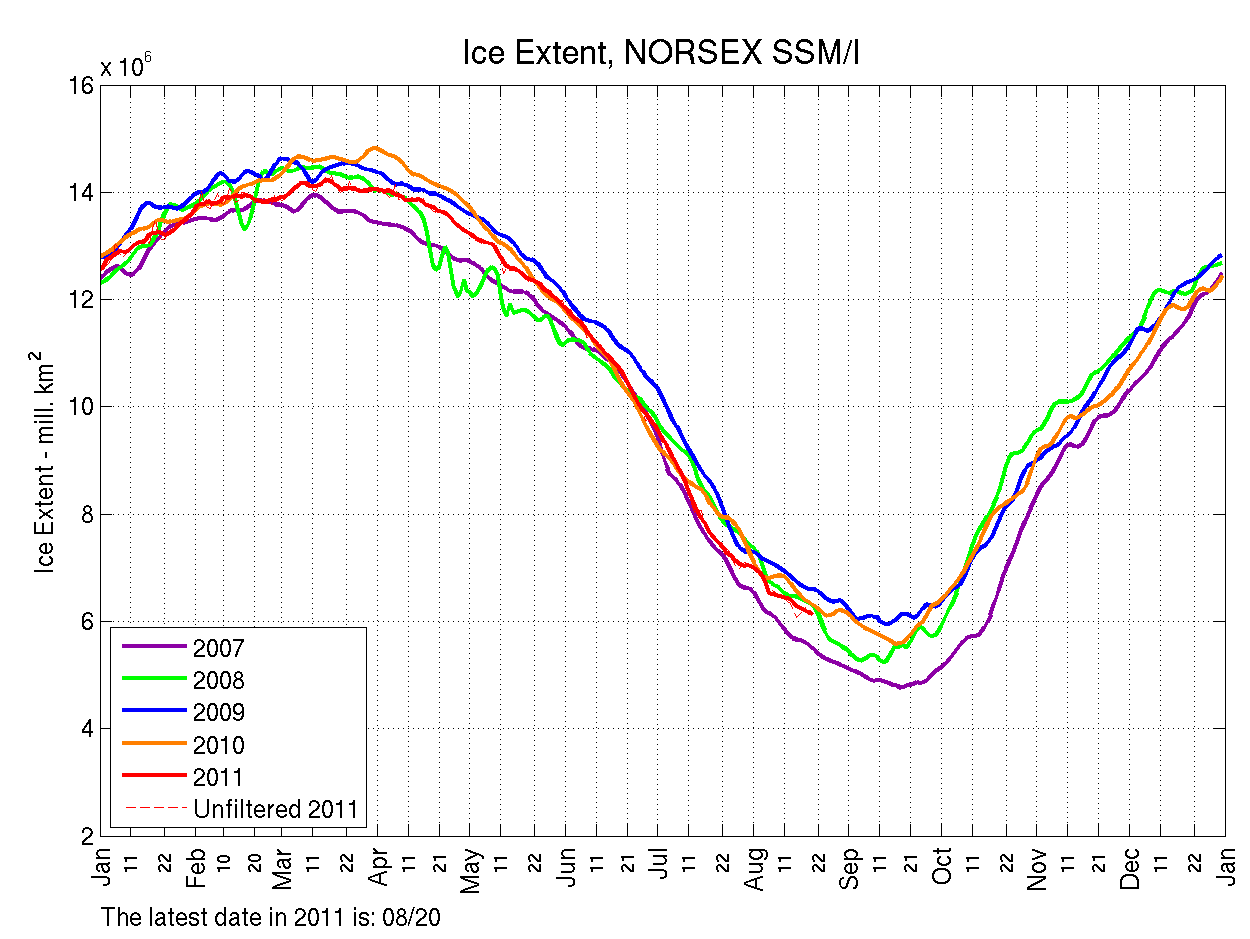
The Arctic Roos graph always puzzles me. It always seeme to give a funny value compared to all the other graphs and also if you look at 2008 above why is it so squiggly? Compare it to 2008 on these graphs
http://ocean.dmi.dk/arctic/icecover.uk.php
http://www.ijis.iarc.uaf.edu/en/home/seaice_extent.htm
2008 is pretty smooth.