What I want to know is where is my thermal expansion? After all we have just come out of the ‘hottest decade evaaaaah’ AND the missing heat went deeeeeep into the oceans.
IPCC – AR4 – 2007
Frequently Asked Question 5.1
Is Sea Level Rising?
Yes, there is strong evidence that global sea level gradually rose in the 20th century and is currently rising at an increased rate, after a period of little change between AD 0 and AD 1900. Sea level is projected to rise at an even greater rate in this century. The two major causes of global sea level rise are thermal expansion of the oceans (water expands as it warms) and the loss of land-based ice due to increased melting. http://www.ipcc.ch/publications_and_data/ar4/wg1/en/faq-5-1.html
Still waiting. 🙂
American Meteorological Society – Volume 26, Issue 13 (July 2013)
Abstract
Twentieth-Century Global-Mean Sea Level Rise: Is the Whole Greater than the Sum of the Parts?
………..The reconstructions account for the observation that the rate of GMSLR was not much larger during the last 50 years than during the twentieth century as a whole, despite the increasing anthropogenic forcing. Semiempirical methods for projecting GMSLR depend on the existence of a relationship between global climate change and the rate of GMSLR, but the implication of the authors’ closure of the budget is that such a relationship is weak or absent during the twentieth century. http://dx.doi.org/10.1175/JCLI-D-12-00319.1
Jimbo asked, ironically, “What I want to know is where is my thermal expansion?”
Thermal expansion does not substantially affect coastal sea-levels, because gravity balances mass, not volume, so expansion of the top layer of sea-water in the open ocean just causes the surface to rise in place, without affecting sea-level elsewhere. That’s why the shoreline does not move inland in the summer, and why the oceans do not flow north-to-south in April through July as the northern hemisphere warms and the southern cools, and south-to-north in October through January.
The IPCC says that thermal expansion accounts for about half of their projected sea-level rise, without mentioning that that half will not substantially affect the coasts. So all over the world, planners and regulators (who slept through high school physics?) include that component of sea-level rise in the forecasts that they use for coastal planning.
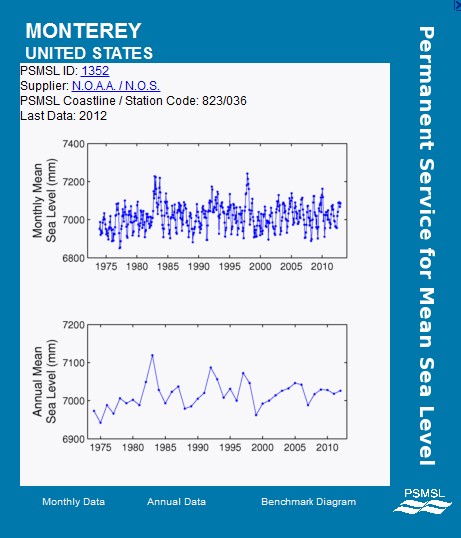
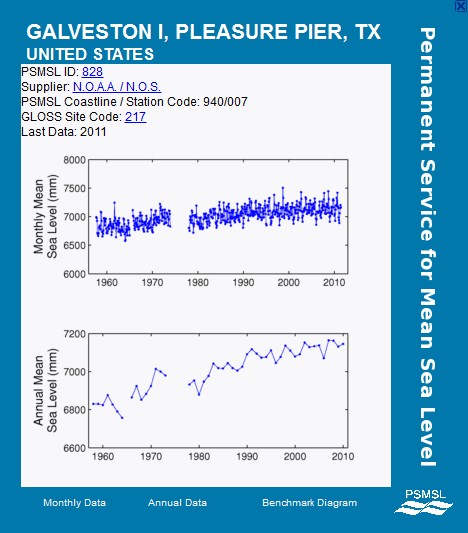
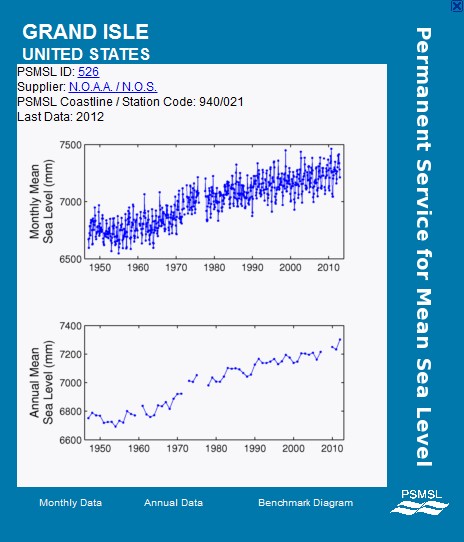
There are long-term oscillatory patterns to sea-level, some on the order of ~60 years. So over a period of a few decades you can see apparent local trends, which are balanced by similar trends in the opposite direction in other places. So, for instance, the last few decades the USA has seen a transient increase in sea-level rise on the northern part of the North Atlantic coast, but a corresponding decrease on the southern and western coasts. See: http://sealevel.info/papers.html#howlong
There’s a lot of info here, yet I will say that I had thought that the rate of sea level rise has remained the same, and this in itself is fully inconsistent with the bs spouted by the fear mongering Chicken Littles. But if the rate of sea rise is actually declining, game over for the squawking Prophets of Doom.
What fear mongering?
Al Gore, 1993: “BECAUSE OF THE RISING SEA LEVEL, DUE TO GLOBAL WARMING, IN THE NEXT FEW DECADES … UP TO 60 PERCENT OF THE PRESENT POPULATION OF FLORIDA MAY HAVE TO BE RELOCATED.”
Google executive chairman Eric Schmidt: “The thirst for information is ultimately the solution to the problems we talk about here,” he said. “You can hold back knowledge; you cannot prevent it from spreading. You can lie about the effects of climate change, but eventually you’ll be seen as a liar.”
The satellites show sea level rise better than individual stations. Maybe this reply will be posted:
“…Satellite altimeter radar measurements can be combined with precisely known spacecraft orbits to measure sea level on a global basis with unprecedented accuracy. A series of satellite missions that started with TOPEX/Poseidon (T/P) in 1992 and continued with Jason-1 (2001–present) and Jason-2 (2008–present) estimate global mean sea level every 10 days with an uncertainty of 3–4 mm. http://ibis.grdl.noaa.gov/SAT/SeaLevelRise/
Thanks for the link, Bob. The two Jasons show a pretty clear picture of the way global mean sea level continues to steadily increase regardless of local shoreline variations in relative sea level. I’ve been looking for something like this. An uncertainty of 3-4 mm is incredibly good.
The really odd thing is the anomalous dip in mean sea level in 2011. Wonder what that’s all about.
” From 1950 to 2009, measurements show an average annual rise in sea level of 1.7 ± 0.3 mm per year, with satellite data showing a rise of 3.3 ± 0.4 mm per year from 1993 to 2009,[6″
Are we in an inter-glacial or not?
Have you missed the factual history lessons and recording through the past 11,000 years, or could it be C02 has suspended the next glacial advance?
Better?
The marks left on the seawalls are a damn good indicator of ocean levels and they are recorded in over 6200 different locations throughout the past 22,000 years, throughout our planet!
Dave, I posted links for TOPEX/Poseidon, Jason-1, and Jason-2, don’t know about ‘envisat.’
Why do you think thermosteric rise won’t affect the coast? The seas are getting warmer, which expands water, and combined with grounded ice melting, causes sea level rise, except where land is rising faster (such as ice age rebound.) Thermosteric numbers here: http://www.nodc.noaa.gov/OC5/3M_HEAT_CONTENT/
Warmer? By what account?
Melted ice decreases the volume it occupies, regardless of the content, yet we hear nothing about the minimized volume as it is enveloped by its surroundings…
Chewer, envision a chunk of ice floating in a lake of liquid water. Part of the ice is above the waterline, but most is below. The volume of the ice below the waterline is exactly equal to the volume which would be occupied by the ice chunk’s mass of liquid lakewater.
Melted or frozen, the ice chunk displaces the same amount of lakewater.
The same thing is true with seawater, except that its salinity increases its density. So if you melt a freshwater iceberg, until the fresh liquid meltwater mixes with the surrounding salty seawater, there’ll be a “bump” of locally elevated waterlevel, due to the fresh water’s lower density.
Bob Maginnis, you are correct that when grounded ice melts it causes sea-level rise that affects both open-ocean and coastal sea-levels.
But thermosteric rise in the open oceans cannot affect sea-level elsewhere, at all. In particular, it does not affect the coasts. If water in the upper layer of the ocean expands, it rises in place. and displaces exactly the same amount of surrounding (cooler, denser) seawater that it displaced before it expanded.
If the upper layer of the ocean expands or contracts due to temperature changes, no net lateral flows result. The top surfaces just go up or down, with the mass of any chosen column of water unaffected. If you bring warm water into contact with cold water, you’ll end up with intermediate temperature water in the vicinity of the boundary, mostly due to fluid mixing, but also due to heat transfer. The top surface there will be of intermediate height, because the water is of intermediate temperature. But, even though there’s mixing, there’re no net horizontal flows: for every molecule of water that moves left, another moves right just as far. There’s no net horizontal movement of the water, because gravity acts upon the mass, not the volume, and changing the temperature/density of the water does not affect its mass.
Think about this: unless you live near the equator, every springtime the ocean surface water in your hemisphere warms & expands, and the water in the other hemisphere cools and contracts. Right? And those temperature changes are far, far greater in magnitude than any plausible change due to global warming. Yet those big temperature changes cause no annual springtime flow of water away from your hemisphere and into the other. None. Do you understand why that is?
If the temperature of the upper layer of the ocean changes, it will cause satellite-measured average sea-level to change due to thermally-driven density changes in the upper layer of the ocean, but those mid-ocean sea-level changes have negligible effect on coastal sea levels, as measured by tide gauges.
That might seem surprising, but it is true.
To understand how density changes in the upper ocean affect sea-level, remember Archimedes’ Principle, or consider the case of floating ice. The reason that an iceberg sticks up out of the ocean is that it has lower density than the liquid water in which it floats. The amount of water that it displaces depends only on its mass, not on its density or shape. (Note that the top surface of an iceberg is a locally elevated sea level!)
When ice melts, there is no effect* on sea-level elsewhere because gravity balances mass, not volume. The same principle holds w/r/t all density changes in the upper layer of the ocean. That’s why displacement is expressed in units of mass or weight.
Imagine an iceberg wrapped in a plastic bag (to prevent mixing, for simplicity). If it melts, its density increases, and the the exposed part that rises above the water sinks, but the volume of the iceberg below the surface does not change at all. If the iceberg in the plastic bag refreezes, it will rise up and protrude above the surface, but its displacement (the volume of seawater that it displaces) still will not change.
Because the amount of seawater that it displaces is unaffected by changes in its density, when it freezes/expands or thaws/contracts, it causes no lateral water flows. Only the local elevation of its upper surface changes. It does not affect sea-level elsewhere.
Note that it is only the density of the floating object which matters, not whether it is solid, liquid, or slush. Displacement is measured in units of mass, and it isn’t affected by changes in density or solidity or shape.
The reason for that is that gravity balances mass, not volume. The same thing happens with density changes in liquid water. The upper layer of the ocean floats like an iceberg on top of the very cold water in the ocean depths, and there’s little mixing between them. When water in the upper layer of the ocean warms and expands, it rises up in place, like a very stubby iceberg. Gravity balances mass, not volume, so the thermal expansion causes no lateral water flows.
The exception to that rule is for water at the bottom of the ocean. If it expands, it has an effect similar to raising the ocean floor, which does cause lateral flows. But, in reality, that doesn’t happen at all in the deep ocean, where temperatures are extremely stable.
Almost all thermal expansion takes place in the upper layer of the ocean. Only a small portion of the ocean is shallow enough for warming to reach the water at the bottom and cause thermal expansion there. That means only a small portion of the ocean’s thermal expansion can cause lateral water flows and affect sea-level at the shorelines.
Without substantial lateral flows of water, there can be no significant effect on the coasts. Of course, temperature changes do affect the density of water at the shore, but that doesn’t cause the shoreline to advance or retreat. When water warms it gets deeper where it warms, by a (small) percentage of its depth. A percentage of zero is zero, so at the beaches, where the depth is near zero, the rise is negligible. Were that not the case, beaches would be wider and the shoreline would be further out to sea in the winter (when the water is cold) than in the summer (when the water is warm).
In summary, it is a mistake to compare satellite-measured deep-ocean sea-level rise to tide gauge-measured coastal sea-level rise. Even if the satellite data were trustworthy (which it isn’t), and even if we had perfectly accurate numbers for PGR/GIA corrections (which we don’t), and even if we also had accurate corrections for local subsidence (due to factors like groundwater extraction, oil & gas extraction, etc.), and even if we had comprehensive tide-gauge coverage of all the world’s coasts, it would still be a mistake to compare coastal sea-levels and deep-ocean sea-levels, because they are different quantities. Comparing them is like comparing apples to oranges.
* “no effect,” that is, except an en extremely tiny & completely negligible effect on salinity, when the fresh meltwater mixes with the rest of the ocean, over a period of a few thousand years
Dave,
I would buy your argument if we were only talking about the top 10 or 100 meters of sea surface, but the Thermosteric 0-2000 meters is a significant mass of the Oceans. Check number 5 of: http://www.nodc.noaa.gov/OC5/3M_HEAT_CONTENT/
Bob, the IPCC says nearly all sea-level rise (SLR) due to thermal expansion occurs in the top 700 meters. That’s probably right.
Note that there’s no seasonal variation in water temperature below about 100 meters.
More specifically, out of 1.6 ± 0.5 mm/yr SLR that the IPCC attributes to thermal expansion over 1993–2003, they say all but 0.1 mm/yr was in the upper 700 meters. In fact, most of that is surely in the top 100 meters.
So we’re basically talking about the continental shelf (7.6% of the oceans’ surface area), and arguably a bit of the continental rise.
If you click on #6 on that NOAA page, and compare the 0-700 and 0-2000 graphs, you can see that over the 1976-2012 period (i.e., starting where both graphs are at their arbitrary zero point on their Y-axis) they estimate about 4.5mm / (2012-1976) = 0.125 mm/yr SLR due to thermal expansion below 700 meters — not very different from the IPCC.
Moreover, note what happens when you do get a bit of thermal expansion in the water at the bottom of the ocean, in the (small) portion of the ocean which is shallow enough for that to happen. It has an effect similar to raising the bottom of the ocean slightly at that location, displacing water there. But the effect on sea-level is spread over the entire ocean.
More than 90% of the ocean is too deep for its bottom waters to be even slightly affected by thermal expansion, so you can begin by dividing the effect by 10.
Then note that even on the continental shelves, the bottom water temperature is much more stable than the water near the surface, so even there most of the thermal expansion doesn’t affect the water at the bottom, and, hence, won’t affect sea-level elsewhere.
So we’re talking about less than 1/10 of a small portion of a modest effect — i.e., negligible.
Broome Australia Tidal Data Record from 1966 to 2012. http://www.bom.gov.au/ntc/IDO70000/IDO70000_62650_SLD.shtml
My charting of data shows tidal maximum and mean to be pretty well flat over 46 years.
Standard Deviation of around 2 metres since Tides are 10 metre High to 1m Low.
If anyone reckons a 200mm (over last 20 yrs) increase as alledged by the NOAA satellite data map is meaningful, then you’d be ignoring the prior 30 years data. Probably closer to 100 mm increase over full 46 years.
Nicely shows the Thermosteric change in Sea Level from winter to summer annually.
We can bin the “sky is falling” Press Release and go back to real work now.
Fremantle Mean Sea Level has increased maybe about 100-150mm over 115 years according to the BOM Tidal data set. Not the catastrophic 10mm per year that the governmental Australian Climate Commission announced earlier this year! Feel free to tell me why the official and physical data is wrong versus the two Jasons, because there are thousands of beach house owners in Perth that have no concern whatsoever. http://www.bom.gov.au/ntc/IDO70000/IDO70000_62230_SLD.shtml
That’s why Michael and McGinnis are full of crap except for one thing. Michael wrote the other day that proper scientific method tests theories as falsifiable. Tidal records show that there is no acceleration in sea levels rising and any increase is extremely small. Therefore CAGW theory is false. The data proves it is false. No amount of modelling can change what the data set shows.
There has been almost no increase in real global temperature, no catastrophic real sea level rise, no increase in real mega storms and the real polar climates are within normal ranges. Climate Models prove jack shit.
Dave, The average depth of the Oceans is 4 km and the 0 to 2 km thermosteric sea level rise about half that, and the continental shelves are a tiny fraction of the Oceans, so graph #5 is still valid, and shows a recent short term upturn. http://www.nodc.noaa.gov/OC5/3M_HEAT_CONTENT/
Mr. Oz, who is McGinnis? I am Maginnis. If you are interested in Current sea level rise, and the many factors, try: http://en.wikipedia.org/wiki/Sea_level_rise
and for warming in general:
This set of graphs show changes in climate indicators over several decades. Each of the different colored lines in each panel represents an independently analyzed set of data. The data come from many different technologies including weather stations, satellites, weather balloons, ships and buoys.[32] http://en.wikipedia.org/wiki/Effects_of_global_warming
Bob, the “0-2km” thermosteric rise is not uniformly distributed over that range of depths. Most of it is in the top 100m. Nearly all of it is in the top 700m, which you can see If you click on #6 on that NOAA page, and compare the 0-700 and 0-2000 graphs.
Think about the changing of the seasons, and how that affects water temperature. Every springtime the ocean surface water in your hemisphere warms & expands, and the water in the other hemisphere cools and contracts. Every autumn the water in your hemisphere cools and contracts, and the water in the other hemisphere warms and expands.
Yet, even though those temperature changes are much greater in magnitude than any possible change in water temperature due to global warming, they do not cause seasonal flows of water back and forth between the two hemispheres, and they do not cause seasonal advances and retreats of the coastlines.
BTW, Wikipedia is a particularly untrustworthy source for information about sea-level rise, or anything else related to climate change.
Wikipedia is useful for non-controversial topics. But for anything controversial it tends to be propaganda, rather than honest, balanced information. For anything controversial with a clear left-right political axis, Wikipedia uniformly presents the Leftist view.
Well, that’s certainly true if you average it over long enough periods, but there have at least been some fluctuations in rate.
Most recently, based on tide gauge records, the average rate of sea-level rise seems to have accelerated a bit, somewhere between 100 and 150 years ago, though that increase isn’t apparent at all tide gauges. Since then, there’s been no sustained increase in the rate of sea-level rise for at least 80 years, though it has fluctuated a bit.
Going back further in time, the Biblical city of Ephesus, on the eastern coast of the Aegean, was abandoned and rebuilt to the west of its previous locations several times, because of the retreating shoreline. The archeological site of the Biblical city from the time of Christ is now several miles from the coast. The retreat of the sea is generally attributed to silt from the Cayster River, but sea-level decline might have played a part.
Of course, all that was relatively recent compared to the retreat of the great ice sheets, about 10k years ago. That retreat certainly caused a large rise in sea-level, but most of that rise must have occurred prior to about 6k years ago.


Boy it would sure be cool to be around for the end of an interglacial 😉
couple of years left. 🙂
It’s because the hidden heat the bottom of the sea is boiling the water and transforming it into vapor… hmmmm… and when the seas dry… hmmmm…
What I want to know is where is my thermal expansion? After all we have just come out of the ‘hottest decade evaaaaah’ AND the missing heat went deeeeeep into the oceans.
Still waiting. 🙂
“What I want to know is where is my thermal expansion?”
It’s pushing the sea floor down. 😉
Jimbo asked, ironically, “What I want to know is where is my thermal expansion?”
Thermal expansion does not substantially affect coastal sea-levels, because gravity balances mass, not volume, so expansion of the top layer of sea-water in the open ocean just causes the surface to rise in place, without affecting sea-level elsewhere. That’s why the shoreline does not move inland in the summer, and why the oceans do not flow north-to-south in April through July as the northern hemisphere warms and the southern cools, and south-to-north in October through January.
The IPCC says that thermal expansion accounts for about half of their projected sea-level rise, without mentioning that that half will not substantially affect the coasts. So all over the world, planners and regulators (who slept through high school physics?) include that component of sea-level rise in the forecasts that they use for coastal planning.
Tectonic plates ebbing and flowing on Earth’s Crust. Do the manmade computer models figure those variables?
There are long-term oscillatory patterns to sea-level, some on the order of ~60 years. So over a period of a few decades you can see apparent local trends, which are balanced by similar trends in the opposite direction in other places. So, for instance, the last few decades the USA has seen a transient increase in sea-level rise on the northern part of the North Atlantic coast, but a corresponding decrease on the southern and western coasts. See:
http://sealevel.info/papers.html#howlong
There’s a lot of info here, yet I will say that I had thought that the rate of sea level rise has remained the same, and this in itself is fully inconsistent with the bs spouted by the fear mongering Chicken Littles. But if the rate of sea rise is actually declining, game over for the squawking Prophets of Doom.
Not ‘game over’, just a different game.
What fear mongering?
Al Gore, 1993: “BECAUSE OF THE RISING SEA LEVEL, DUE TO GLOBAL WARMING, IN THE NEXT FEW DECADES … UP TO 60 PERCENT OF THE PRESENT POPULATION OF FLORIDA MAY HAVE TO BE RELOCATED.”
Google executive chairman Eric Schmidt: “The thirst for information is ultimately the solution to the problems we talk about here,” he said. “You can hold back knowledge; you cannot prevent it from spreading. You can lie about the effects of climate change, but eventually you’ll be seen as a liar.”
Satellites show sea level rise:
http://ibis.grdl.noaa.gov/SAT/SeaLevelRise/slr/slr_sla_gbl_free_txj1j2_90_400.png
from
http://ibis.grdl.noaa.gov/SAT/SeaLevelRise/
The satellites show sea level rise better than individual stations. Maybe this reply will be posted:
“…Satellite altimeter radar measurements can be combined with precisely known spacecraft orbits to measure sea level on a global basis with unprecedented accuracy. A series of satellite missions that started with TOPEX/Poseidon (T/P) in 1992 and continued with Jason-1 (2001–present) and Jason-2 (2008–present) estimate global mean sea level every 10 days with an uncertainty of 3–4 mm.
http://ibis.grdl.noaa.gov/SAT/SeaLevelRise/
Thanks for the link, Bob. The two Jasons show a pretty clear picture of the way global mean sea level continues to steadily increase regardless of local shoreline variations in relative sea level. I’ve been looking for something like this. An uncertainty of 3-4 mm is incredibly good.
The really odd thing is the anomalous dip in mean sea level in 2011. Wonder what that’s all about.
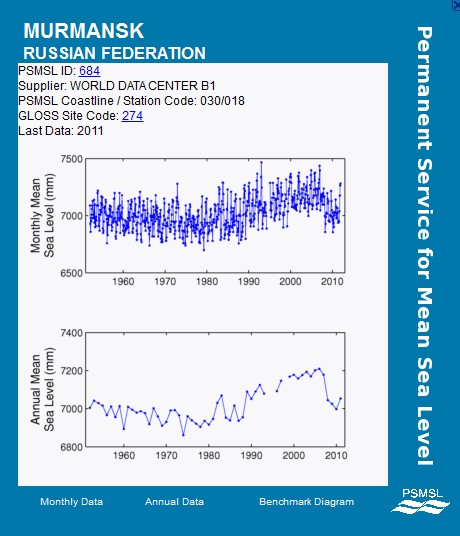
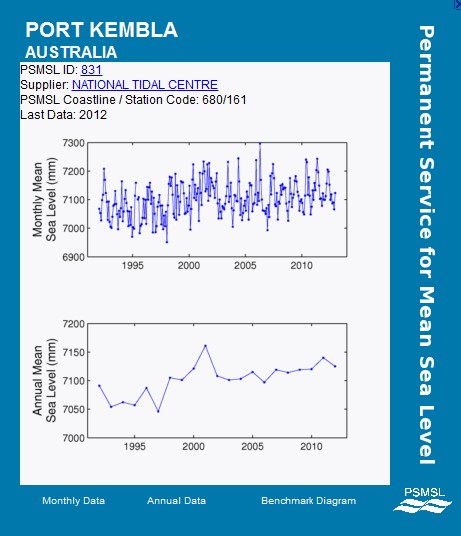
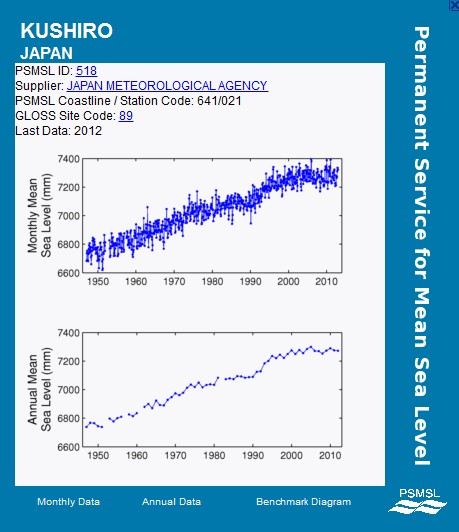
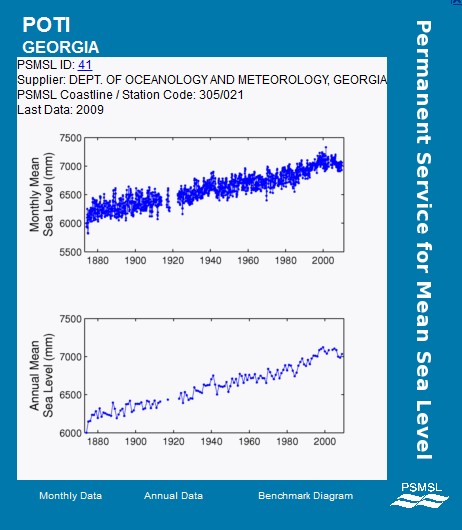
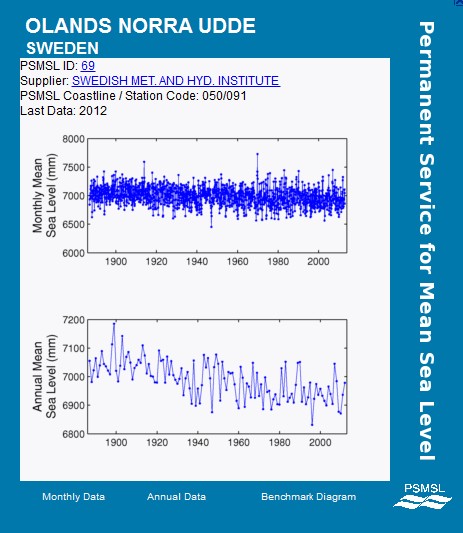
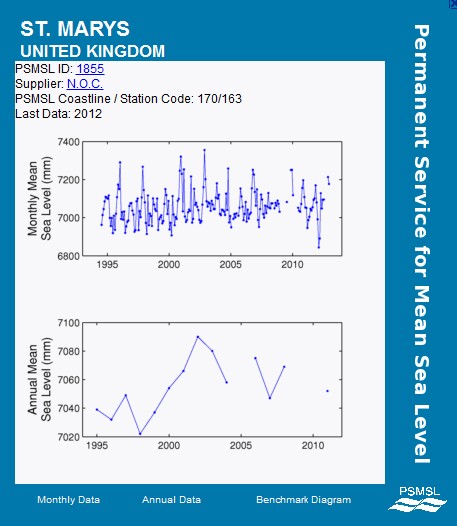
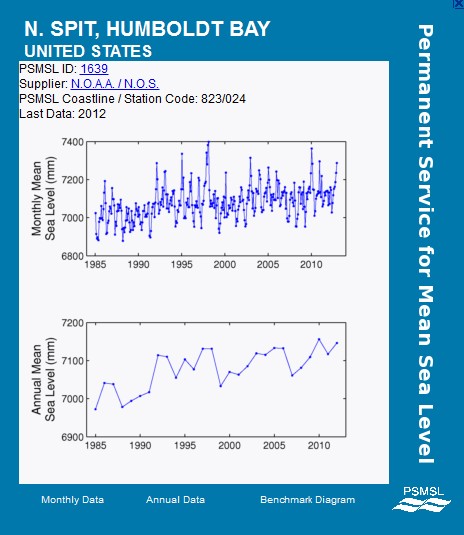
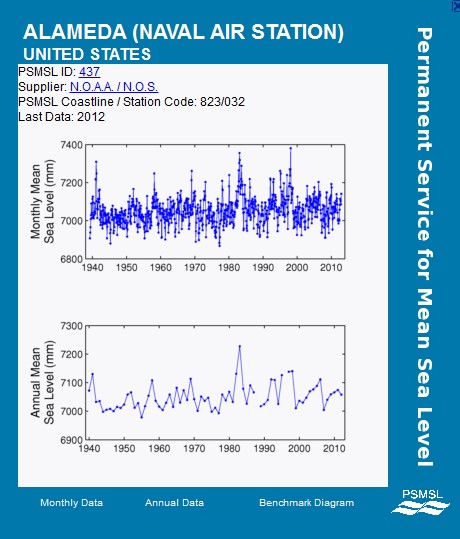
Can you geniuses explain how an increase in sea level rise rates managed to miss almost all of the Earth’s coastlines?
” From 1950 to 2009, measurements show an average annual rise in sea level of 1.7 ± 0.3 mm per year, with satellite data showing a rise of 3.3 ± 0.4 mm per year from 1993 to 2009,[6″
……..with an uncertainty of 3–4 mm.
Are we in an inter-glacial or not?
Have you missed the factual history lessons and recording through the past 11,000 years, or could it be C02 has suspended the next glacial advance?
There are two problems with the satellite sea-level data:
1. It’s not reliable: http://stevengoddard.wordpress.com/2012/04/24/was-envisat-tortured-to-death/
2. It includes thermosteric rise, which does not significantly affect the coasts.
Better?
The marks left on the seawalls are a damn good indicator of ocean levels and they are recorded in over 6200 different locations throughout the past 22,000 years, throughout our planet!
Dave, I posted links for TOPEX/Poseidon, Jason-1, and Jason-2, don’t know about ‘envisat.’
Why do you think thermosteric rise won’t affect the coast? The seas are getting warmer, which expands water, and combined with grounded ice melting, causes sea level rise, except where land is rising faster (such as ice age rebound.) Thermosteric numbers here: http://www.nodc.noaa.gov/OC5/3M_HEAT_CONTENT/
Warmer? By what account?
Melted ice decreases the volume it occupies, regardless of the content, yet we hear nothing about the minimized volume as it is enveloped by its surroundings…
Chewer, envision a chunk of ice floating in a lake of liquid water. Part of the ice is above the waterline, but most is below. The volume of the ice below the waterline is exactly equal to the volume which would be occupied by the ice chunk’s mass of liquid lakewater.
Melted or frozen, the ice chunk displaces the same amount of lakewater.
The same thing is true with seawater, except that its salinity increases its density. So if you melt a freshwater iceberg, until the fresh liquid meltwater mixes with the surrounding salty seawater, there’ll be a “bump” of locally elevated waterlevel, due to the fresh water’s lower density.
Bob Maginnis, you are correct that when grounded ice melts it causes sea-level rise that affects both open-ocean and coastal sea-levels.
But thermosteric rise in the open oceans cannot affect sea-level elsewhere, at all. In particular, it does not affect the coasts. If water in the upper layer of the ocean expands, it rises in place. and displaces exactly the same amount of surrounding (cooler, denser) seawater that it displaced before it expanded.
If the upper layer of the ocean expands or contracts due to temperature changes, no net lateral flows result. The top surfaces just go up or down, with the mass of any chosen column of water unaffected. If you bring warm water into contact with cold water, you’ll end up with intermediate temperature water in the vicinity of the boundary, mostly due to fluid mixing, but also due to heat transfer. The top surface there will be of intermediate height, because the water is of intermediate temperature. But, even though there’s mixing, there’re no net horizontal flows: for every molecule of water that moves left, another moves right just as far. There’s no net horizontal movement of the water, because gravity acts upon the mass, not the volume, and changing the temperature/density of the water does not affect its mass.
Think about this: unless you live near the equator, every springtime the ocean surface water in your hemisphere warms & expands, and the water in the other hemisphere cools and contracts. Right? And those temperature changes are far, far greater in magnitude than any plausible change due to global warming. Yet those big temperature changes cause no annual springtime flow of water away from your hemisphere and into the other. None. Do you understand why that is?
If the temperature of the upper layer of the ocean changes, it will cause satellite-measured average sea-level to change due to thermally-driven density changes in the upper layer of the ocean, but those mid-ocean sea-level changes have negligible effect on coastal sea levels, as measured by tide gauges.
That might seem surprising, but it is true.
To understand how density changes in the upper ocean affect sea-level, remember Archimedes’ Principle, or consider the case of floating ice. The reason that an iceberg sticks up out of the ocean is that it has lower density than the liquid water in which it floats. The amount of water that it displaces depends only on its mass, not on its density or shape. (Note that the top surface of an iceberg is a locally elevated sea level!)
When ice melts, there is no effect* on sea-level elsewhere because gravity balances mass, not volume. The same principle holds w/r/t all density changes in the upper layer of the ocean. That’s why displacement is expressed in units of mass or weight.
Imagine an iceberg wrapped in a plastic bag (to prevent mixing, for simplicity). If it melts, its density increases, and the the exposed part that rises above the water sinks, but the volume of the iceberg below the surface does not change at all. If the iceberg in the plastic bag refreezes, it will rise up and protrude above the surface, but its displacement (the volume of seawater that it displaces) still will not change.
Because the amount of seawater that it displaces is unaffected by changes in its density, when it freezes/expands or thaws/contracts, it causes no lateral water flows. Only the local elevation of its upper surface changes. It does not affect sea-level elsewhere.
Note that it is only the density of the floating object which matters, not whether it is solid, liquid, or slush. Displacement is measured in units of mass, and it isn’t affected by changes in density or solidity or shape.
The reason for that is that gravity balances mass, not volume. The same thing happens with density changes in liquid water. The upper layer of the ocean floats like an iceberg on top of the very cold water in the ocean depths, and there’s little mixing between them. When water in the upper layer of the ocean warms and expands, it rises up in place, like a very stubby iceberg. Gravity balances mass, not volume, so the thermal expansion causes no lateral water flows.
The exception to that rule is for water at the bottom of the ocean. If it expands, it has an effect similar to raising the ocean floor, which does cause lateral flows. But, in reality, that doesn’t happen at all in the deep ocean, where temperatures are extremely stable.
Almost all thermal expansion takes place in the upper layer of the ocean. Only a small portion of the ocean is shallow enough for warming to reach the water at the bottom and cause thermal expansion there. That means only a small portion of the ocean’s thermal expansion can cause lateral water flows and affect sea-level at the shorelines.
Without substantial lateral flows of water, there can be no significant effect on the coasts. Of course, temperature changes do affect the density of water at the shore, but that doesn’t cause the shoreline to advance or retreat. When water warms it gets deeper where it warms, by a (small) percentage of its depth. A percentage of zero is zero, so at the beaches, where the depth is near zero, the rise is negligible. Were that not the case, beaches would be wider and the shoreline would be further out to sea in the winter (when the water is cold) than in the summer (when the water is warm).
If all this seems confusing, you might find it instructive to work through Chapter 11 (“Fluids”) here:
http://www.phy.duke.edu/~rgb/Class/intro_physics_1_review/intro_physics_1_review.pdf
In summary, it is a mistake to compare satellite-measured deep-ocean sea-level rise to tide gauge-measured coastal sea-level rise. Even if the satellite data were trustworthy (which it isn’t), and even if we had perfectly accurate numbers for PGR/GIA corrections (which we don’t), and even if we also had accurate corrections for local subsidence (due to factors like groundwater extraction, oil & gas extraction, etc.), and even if we had comprehensive tide-gauge coverage of all the world’s coasts, it would still be a mistake to compare coastal sea-levels and deep-ocean sea-levels, because they are different quantities. Comparing them is like comparing apples to oranges.
* “no effect,” that is, except an en extremely tiny & completely negligible effect on salinity, when the fresh meltwater mixes with the rest of the ocean, over a period of a few thousand years
Dave,
I would buy your argument if we were only talking about the top 10 or 100 meters of sea surface, but the Thermosteric 0-2000 meters is a significant mass of the Oceans. Check number 5 of:
http://www.nodc.noaa.gov/OC5/3M_HEAT_CONTENT/
Bob, the IPCC says nearly all sea-level rise (SLR) due to thermal expansion occurs in the top 700 meters. That’s probably right.
Note that there’s no seasonal variation in water temperature below about 100 meters.
More specifically, out of 1.6 ± 0.5 mm/yr SLR that the IPCC attributes to thermal expansion over 1993–2003, they say all but 0.1 mm/yr was in the upper 700 meters. In fact, most of that is surely in the top 100 meters.
So we’re basically talking about the continental shelf (7.6% of the oceans’ surface area), and arguably a bit of the continental rise.
If you click on #6 on that NOAA page, and compare the 0-700 and 0-2000 graphs, you can see that over the 1976-2012 period (i.e., starting where both graphs are at their arbitrary zero point on their Y-axis) they estimate about 4.5mm / (2012-1976) = 0.125 mm/yr SLR due to thermal expansion below 700 meters — not very different from the IPCC.
Moreover, note what happens when you do get a bit of thermal expansion in the water at the bottom of the ocean, in the (small) portion of the ocean which is shallow enough for that to happen. It has an effect similar to raising the bottom of the ocean slightly at that location, displacing water there. But the effect on sea-level is spread over the entire ocean.
More than 90% of the ocean is too deep for its bottom waters to be even slightly affected by thermal expansion, so you can begin by dividing the effect by 10.
Then note that even on the continental shelves, the bottom water temperature is much more stable than the water near the surface, so even there most of the thermal expansion doesn’t affect the water at the bottom, and, hence, won’t affect sea-level elsewhere.
So we’re talking about less than 1/10 of a small portion of a modest effect — i.e., negligible.
Broome Australia Tidal Data Record from 1966 to 2012.
http://www.bom.gov.au/ntc/IDO70000/IDO70000_62650_SLD.shtml
My charting of data shows tidal maximum and mean to be pretty well flat over 46 years.
Standard Deviation of around 2 metres since Tides are 10 metre High to 1m Low.
If anyone reckons a 200mm (over last 20 yrs) increase as alledged by the NOAA satellite data map is meaningful, then you’d be ignoring the prior 30 years data. Probably closer to 100 mm increase over full 46 years.
Nicely shows the Thermosteric change in Sea Level from winter to summer annually.
We can bin the “sky is falling” Press Release and go back to real work now.
Fremantle Mean Sea Level has increased maybe about 100-150mm over 115 years according to the BOM Tidal data set. Not the catastrophic 10mm per year that the governmental Australian Climate Commission announced earlier this year! Feel free to tell me why the official and physical data is wrong versus the two Jasons, because there are thousands of beach house owners in Perth that have no concern whatsoever.
http://www.bom.gov.au/ntc/IDO70000/IDO70000_62230_SLD.shtml
NOAA would say more like 175 or 180 mm over 115 years for Fremantle, with no sign of any acceleration:
http://tidesandcurrents.noaa.gov/sltrends/sltrends_global_station.shtml?stnid=680-471
That’s why Michael and McGinnis are full of crap except for one thing. Michael wrote the other day that proper scientific method tests theories as falsifiable. Tidal records show that there is no acceleration in sea levels rising and any increase is extremely small. Therefore CAGW theory is false. The data proves it is false. No amount of modelling can change what the data set shows.
There has been almost no increase in real global temperature, no catastrophic real sea level rise, no increase in real mega storms and the real polar climates are within normal ranges. Climate Models prove jack shit.
Dave, The average depth of the Oceans is 4 km and the 0 to 2 km thermosteric sea level rise about half that, and the continental shelves are a tiny fraction of the Oceans, so graph #5 is still valid, and shows a recent short term upturn.
http://www.nodc.noaa.gov/OC5/3M_HEAT_CONTENT/
Mr. Oz, who is McGinnis? I am Maginnis. If you are interested in Current sea level rise, and the many factors, try:
http://en.wikipedia.org/wiki/Sea_level_rise
and for warming in general:
This set of graphs show changes in climate indicators over several decades. Each of the different colored lines in each panel represents an independently analyzed set of data. The data come from many different technologies including weather stations, satellites, weather balloons, ships and buoys.[32]
http://en.wikipedia.org/wiki/Effects_of_global_warming
Bob, the “0-2km” thermosteric rise is not uniformly distributed over that range of depths. Most of it is in the top 100m. Nearly all of it is in the top 700m, which you can see If you click on #6 on that NOAA page, and compare the 0-700 and 0-2000 graphs.
Think about the changing of the seasons, and how that affects water temperature. Every springtime the ocean surface water in your hemisphere warms & expands, and the water in the other hemisphere cools and contracts. Every autumn the water in your hemisphere cools and contracts, and the water in the other hemisphere warms and expands.
Yet, even though those temperature changes are much greater in magnitude than any possible change in water temperature due to global warming, they do not cause seasonal flows of water back and forth between the two hemispheres, and they do not cause seasonal advances and retreats of the coastlines.
Do you understand why they don’t?
BTW, Wikipedia is a particularly untrustworthy source for information about sea-level rise, or anything else related to climate change.
Wikipedia is useful for non-controversial topics. But for anything controversial it tends to be propaganda, rather than honest, balanced information. For anything controversial with a clear left-right political axis, Wikipedia uniformly presents the Leftist view.
Climate change is certainly controversial, so it should go without saying that Wikipedia cannot be trusted on the topic. Climate Movement activists rewrote over 5000 Wikipedia articles into CAGW propaganda, censoring them to prevent any but the warmist point of view from being represented, to the applause of leftist Wikipedia czar Jimbo Wales.
In reports like this, it would be good to help the public keep perspective by noting that sea level has been rising for over 10,000 years.
Well, that’s certainly true if you average it over long enough periods, but there have at least been some fluctuations in rate.
Most recently, based on tide gauge records, the average rate of sea-level rise seems to have accelerated a bit, somewhere between 100 and 150 years ago, though that increase isn’t apparent at all tide gauges. Since then, there’s been no sustained increase in the rate of sea-level rise for at least 80 years, though it has fluctuated a bit.
Going back further in time, the Biblical city of Ephesus, on the eastern coast of the Aegean, was abandoned and rebuilt to the west of its previous locations several times, because of the retreating shoreline. The archeological site of the Biblical city from the time of Christ is now several miles from the coast. The retreat of the sea is generally attributed to silt from the Cayster River, but sea-level decline might have played a part.
Of course, all that was relatively recent compared to the retreat of the great ice sheets, about 10k years ago. That retreat certainly caused a large rise in sea-level, but most of that rise must have occurred prior to about 6k years ago.
Oops, I pasted the wrong link. This is the one I intended:
http://www.globalwarmingart.com/images/1/1d/Post-Glacial_Sea_Level.png