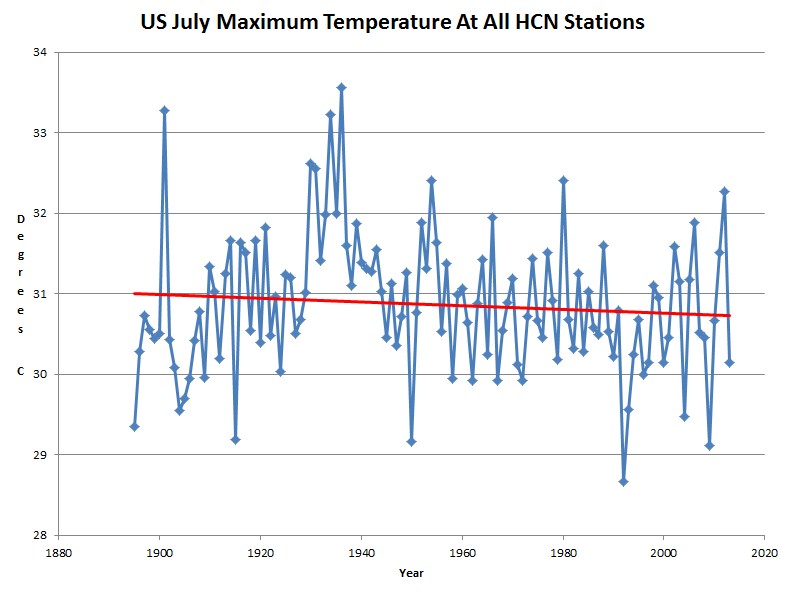
The five hottest July’s in the US were 1936, 1901, 1934, 1930 and 1931.
During July, 1936 – US afternoon temperatures averaged 33.6C (92F) compared to 30.1C (86F) so far in July, 2013.
The two coolest July’s occurred in 1992 (Pinatubo affected) and 2009.
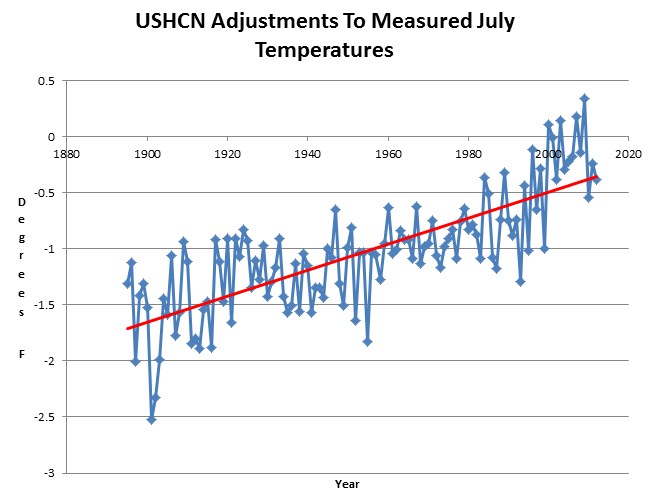
USHCN hides this trend by cooling the past and warming the present. In order to get rid of that inconvenient hot July of 1901, they subtracted 2.5 degrees.
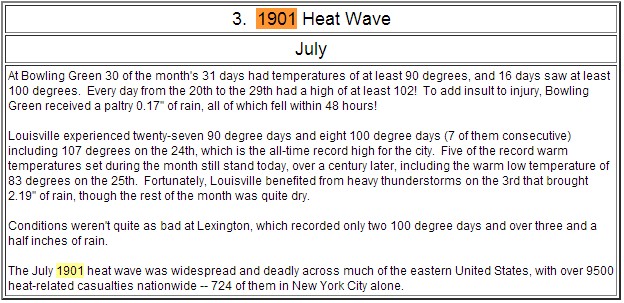
According to some honest people at NOAA, July, 1901 was the third worst heatwave in US history, with 9.500 casualties.
Had USHCN been able to adjust the temperatures at the time, most of those 9,500 dead people probably would have survived.


Greetings:
Here’s a link to the updated message to the Space Science & Technology Committee of the House of Representatives, first sent on 17 July 2013
https://dl.dropboxusercontent.com/u/10640850/Creator_Destroyer_Sustainer_of_Life.pdf
This shows that AGW(Anthropogenic Global Warming) is the result of sixty eight years (2013 – 1945 = 68 years) of official deception that started in 1945 to save the world from possible nuclear annihilation.
With kind regards, -Oliver K. Manuel Former NASA Principal Investigator for Apollo
Sent from my iPhone
All The Best to you Oliver and Thank You!
Another great post Steve, thanks!
I have a question though. Is the 2nd chart also for US only or is it worldwide? If it’s worldwide the explanation for US temps is another local “bubble” of warm temps as we had in the mild winter of 2012, while Europe and Asia were very cold. If so, I’d like to understand what caused that “bubble”. It’s interesting because 1901 is precisely the minimum between two low cycles C13 and C14…
Just the US temperatures.
Reblogged this on The Firewall.