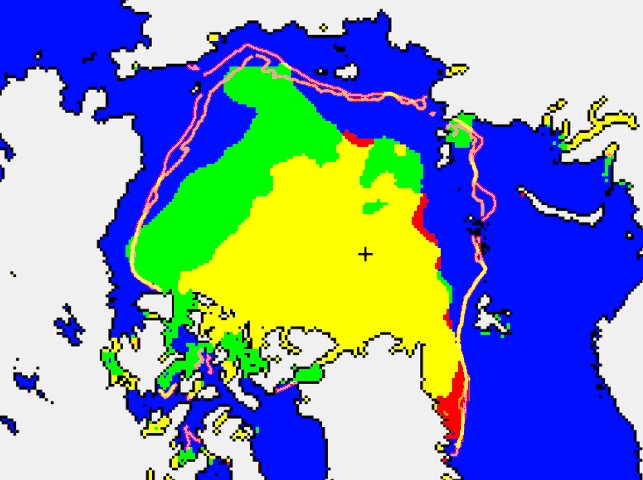
The map below compares NSIDC’s 2013 minimum with their 2012 minimum. Green is ice present in 2013 but not present in 2012. Red shows the opposite.
NSIDC explains that this huge increase in ice “reinforces the long-term downward trend in Arctic ice extent”
War is peace. Freedom is slavery. Ignorance is strength. Gain is loss.


Stevens talking about western arctic sea ice again … cue a towermadeofbullshit to show up and point out all Steven’s errors.
Bla Bla Bla, Prime Meridian, bla bla bla, hemisphere, bla bla, bla
There is an awful lot of extra ice over last year it has to be said. That will form a good base for multiyear ice next year, but how thick is it? Would be interesting to know.
Only 12 months to wait 🙂
Andy
Looking at the JAXA site, ice extents on this date, Oct 1, in the Western Arctic (i.e. Beaufort, Chukchi, E. Sib. seas) are above those from any in the last ten years, except for 2004, which looks to be close to the same. JAXA’s overlays only go back to 2002.
http://www.ijis.iarc.uaf.edu/cgi-bin/seaice-monitor.cgi?lang=e
But the pig entrails show a downward trend….