

Disrupting the Borg is expensive and time consuming!

Google Search
-
Recent Posts
- Analyzing The Western Water Crisis
- Gaslighting 1924
- “Why Do You Resist?”
- Climate Attribution Model
- Fact Checking NASA
- Fact Checking Grok
- Fact Checking The New York Times
- New Visitech Features
- Ice-Free Arctic By 2014
- Debt-Free US Treasury Forecast
- Analyzing Big City Crime (Part 2)
- Analyzing Big City Crime
- UK Migration Caused By Global Warming
- Climate Attribution In Greece
- “Brown: ’50 days to save world'”
- The Catastrophic Influence of Bovine Methane Emissions on Extraterrestrial Climate Patterns
- Posting On X
- Seventeen Years Of Fun
- The Importance Of Good Tools
- Temperature Shifts At Blue Hill, MA
- CO2²
- Time Of Observation Bias
- Climate Scamming For Profit
- Climate Scamming For Profit
- Back To The Future
March 2026 M T W T F S S 1 2 3 4 5 6 7 8 9 10 11 12 13 14 15 16 17 18 19 20 21 22 23 24 25 26 27 28 29 30 31 Recent Comments
- Bob G on Analyzing The Western Water Crisis
- conrad ziefle on Analyzing The Western Water Crisis
- Bob G on Analyzing The Western Water Crisis
- arn on Analyzing The Western Water Crisis
- conrad ziefle on Analyzing The Western Water Crisis
- conrad ziefle on Analyzing The Western Water Crisis
- Bob G on Analyzing The Western Water Crisis
- Gordon Vigurs on Analyzing The Western Water Crisis
- Bob G on Analyzing The Western Water Crisis
- Bob G on Analyzing The Western Water Crisis
Building Back Better
Posted in Uncategorized
Leave a comment
We Are All Berliners Now
‘There will be no place for dissent in future Marxist/Leninist American…These people will be squashed like cockroaches …. there will be no place to defect to’”
- Yuri Bezmenov 1984
Posted in Uncategorized
Leave a comment
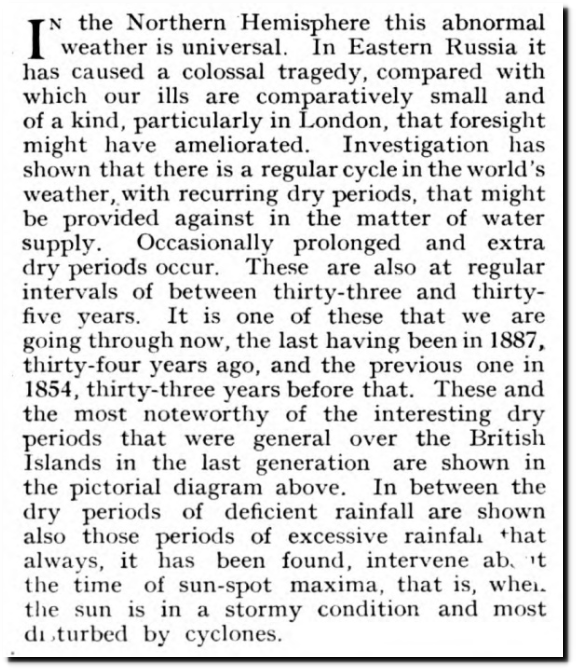
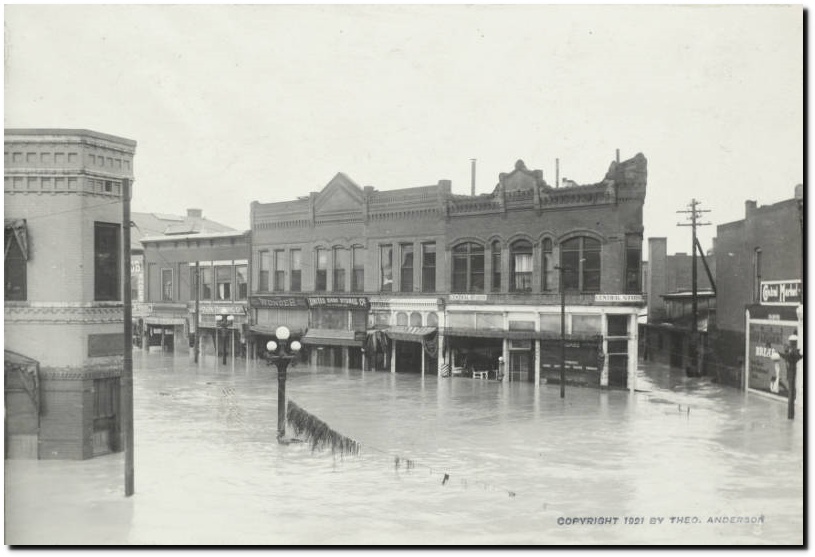
“Sizzling October” 1921
On this date in 1921, the New York Times reported that Earth had a fever.
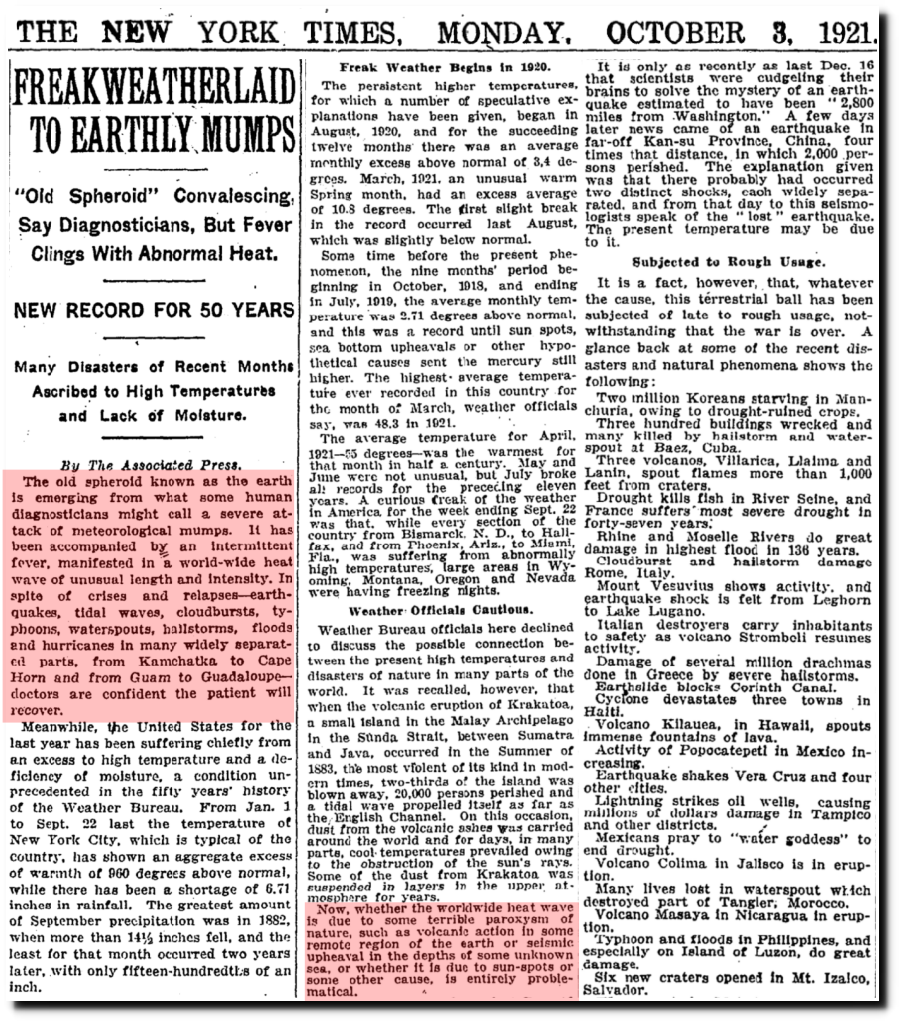
TimesMachine: October 3, 1921 – NYTimes.com
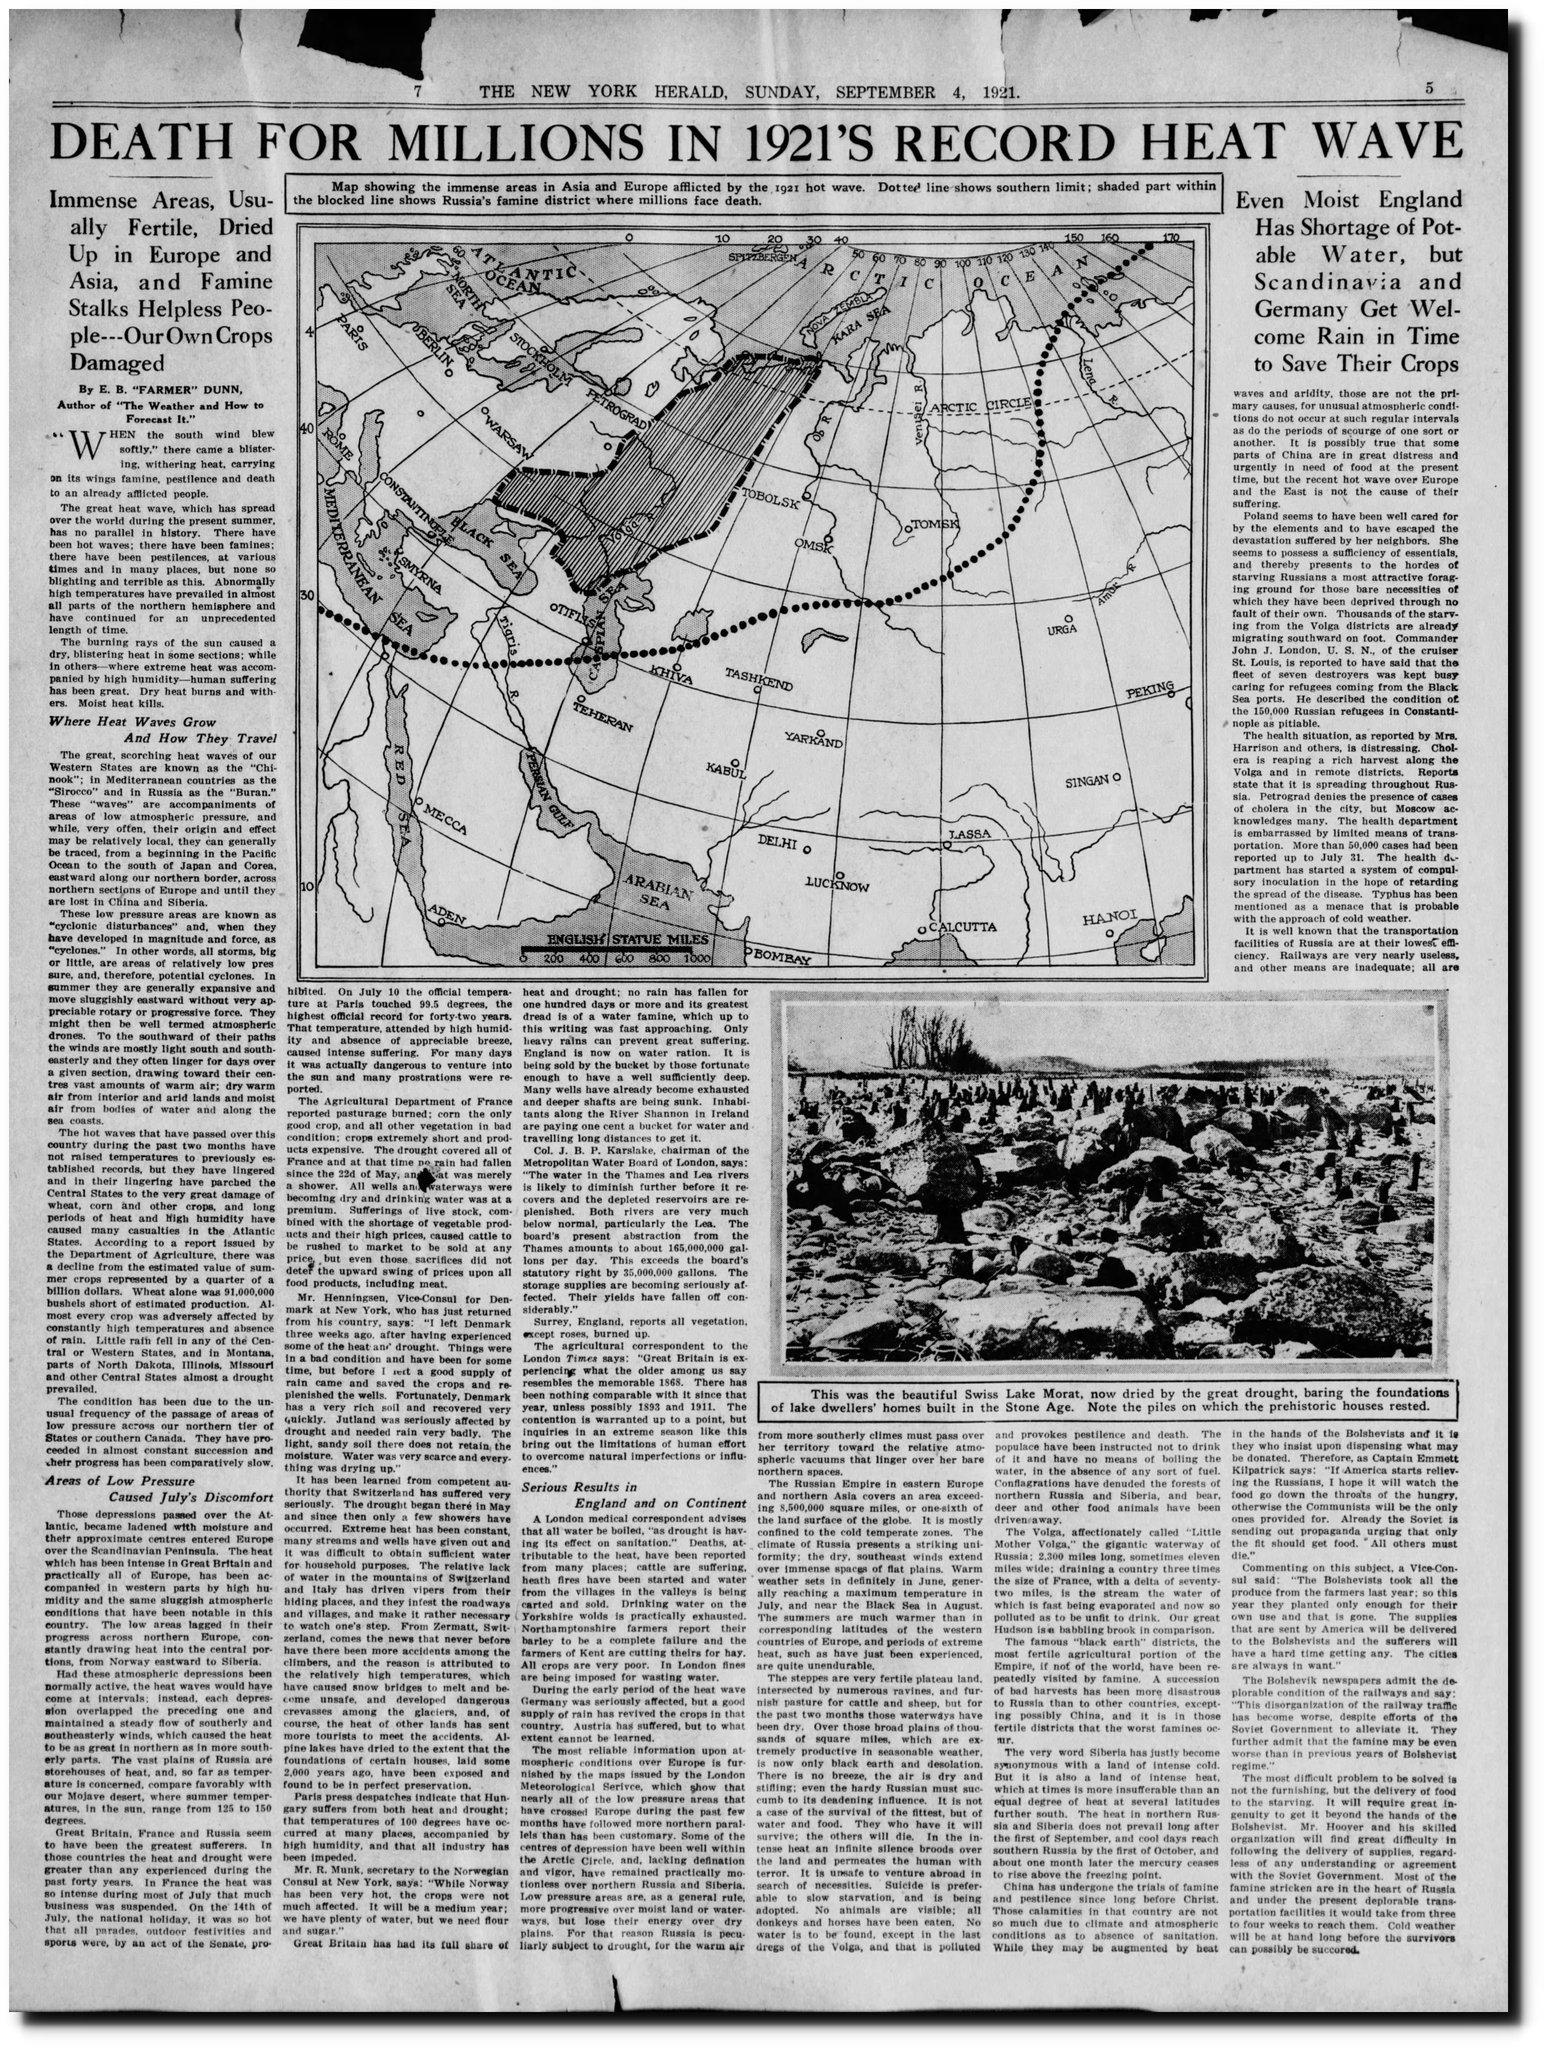
04 Sep 1921, 61 – New York Herald at Newspapers.com
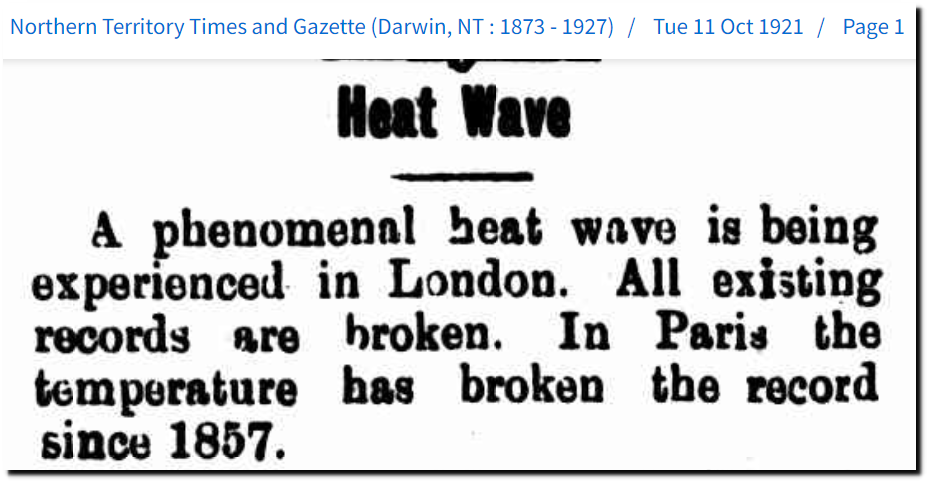
11 Oct 1921 – Heat Wave – Trove
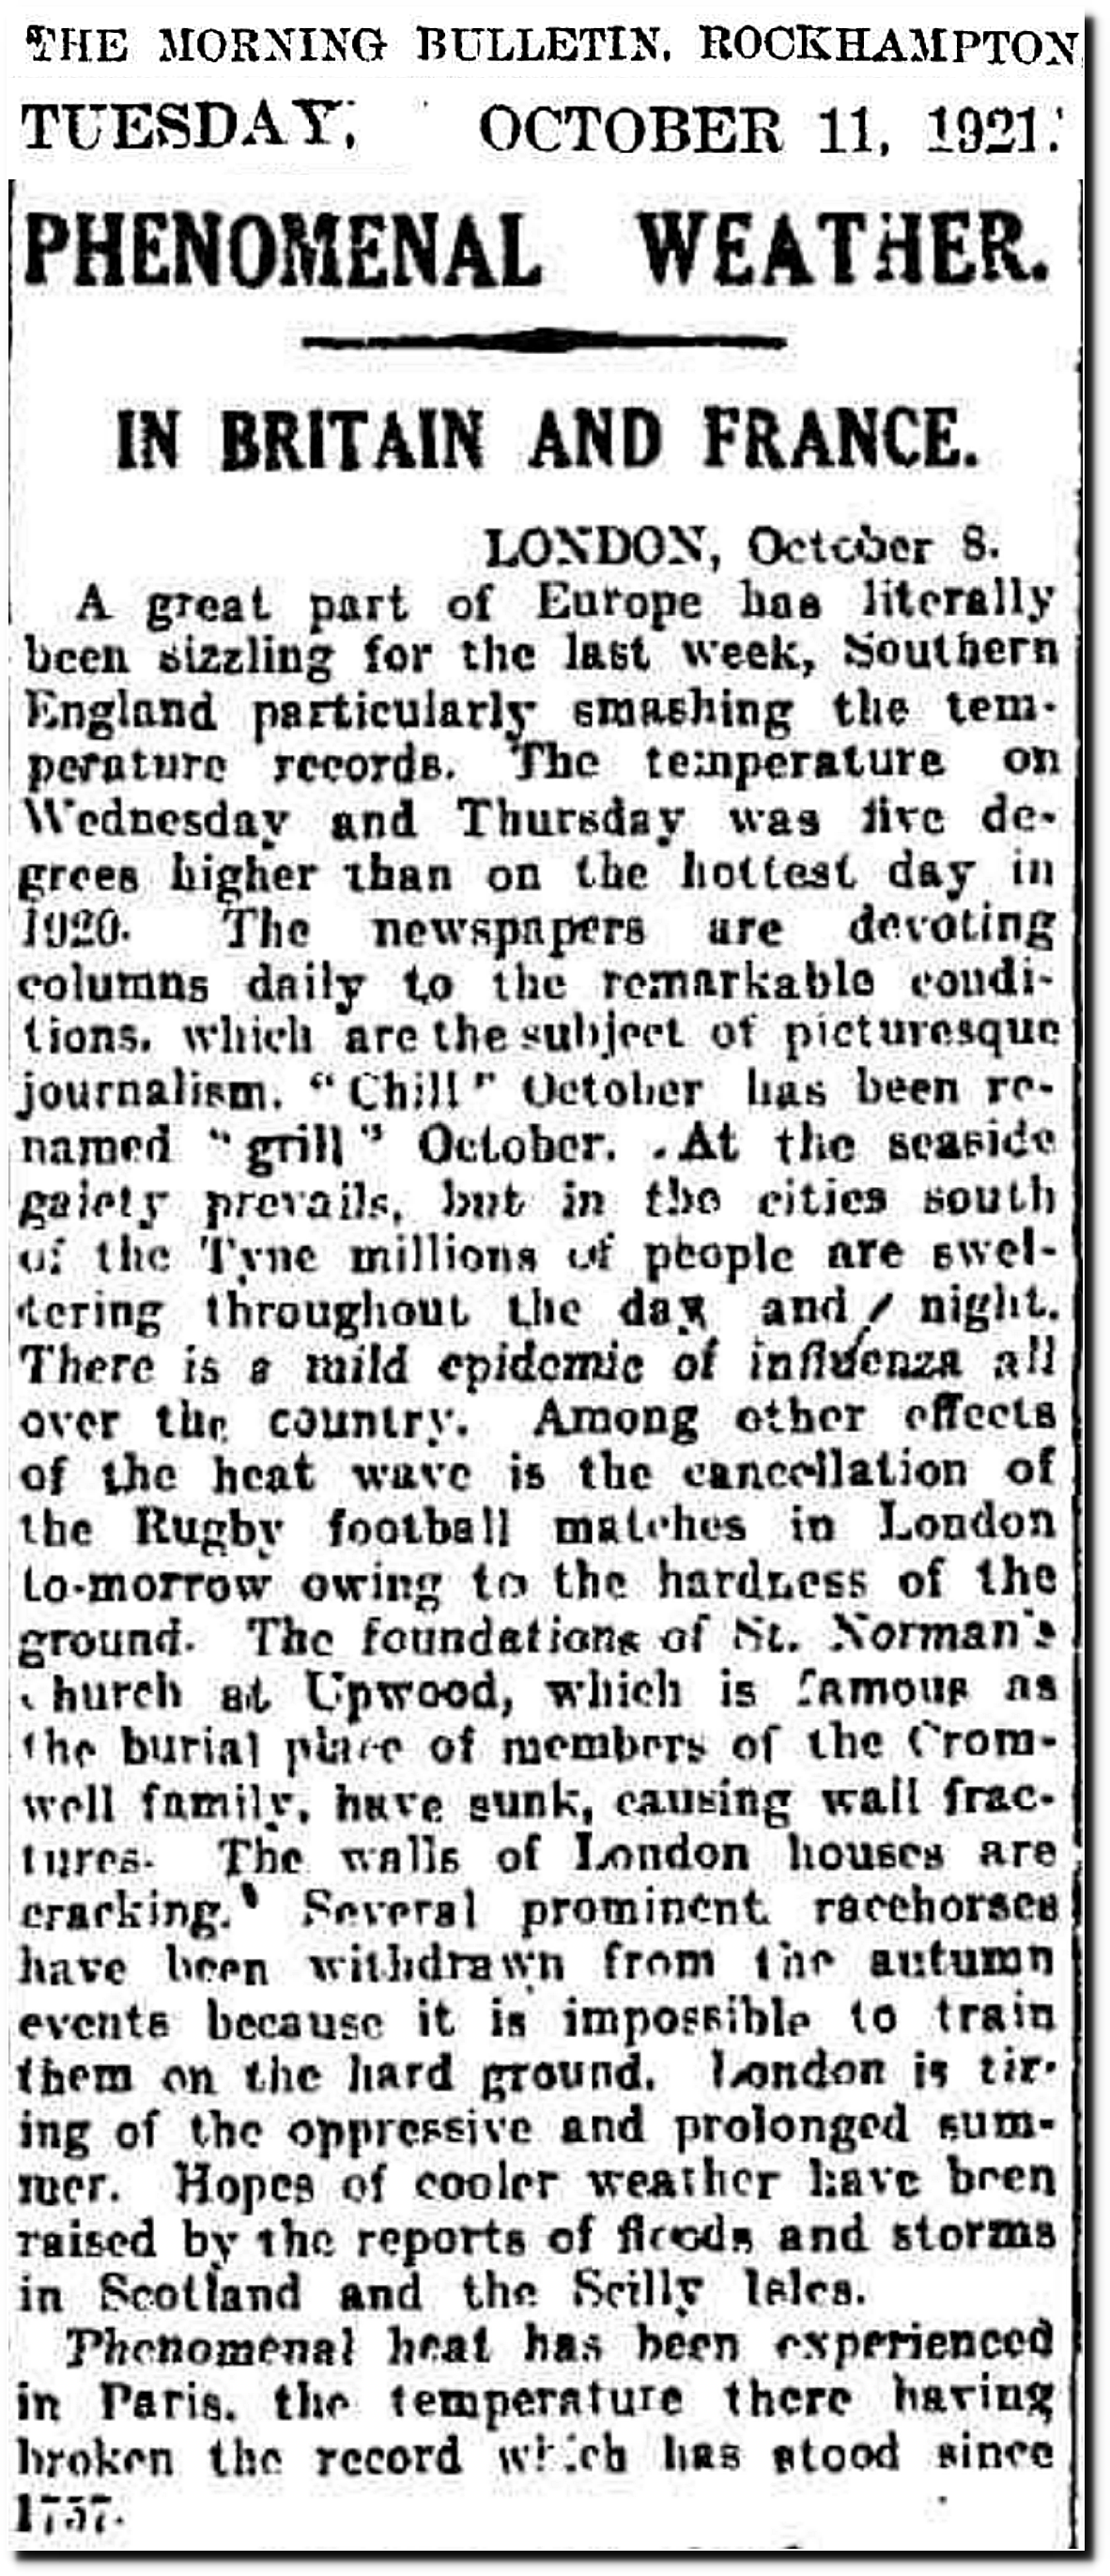
11 Oct 1921 – PHENOMENAL WEATHER. – Trove
The heat was blamed on sunspots
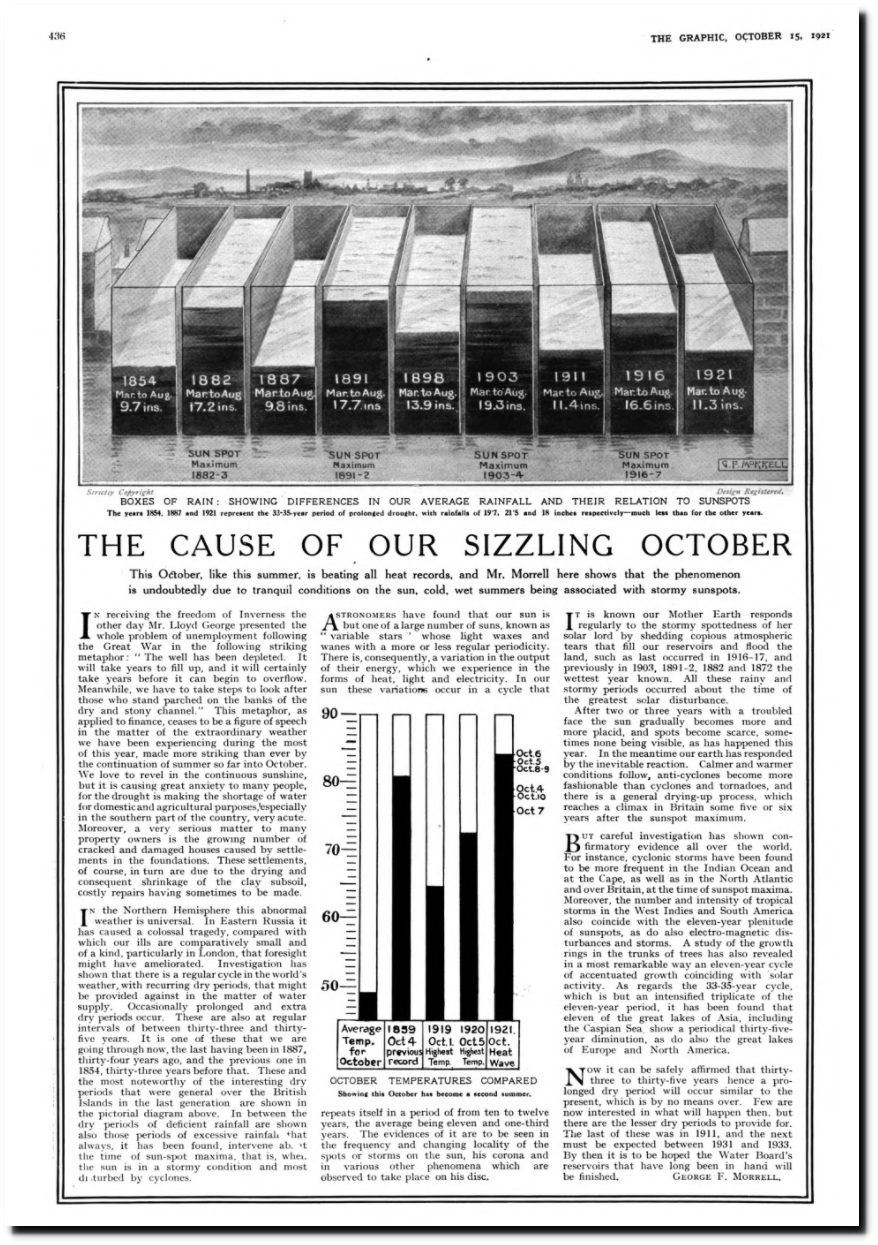
#448 – The Graphic : an illustrated weekly newspaper. … v.104 (Jul.-Dec.1921)
There was a large solar storm on May 15 of that year.

(PDF) The 1859 space weather event revisited: Limits of extreme activity
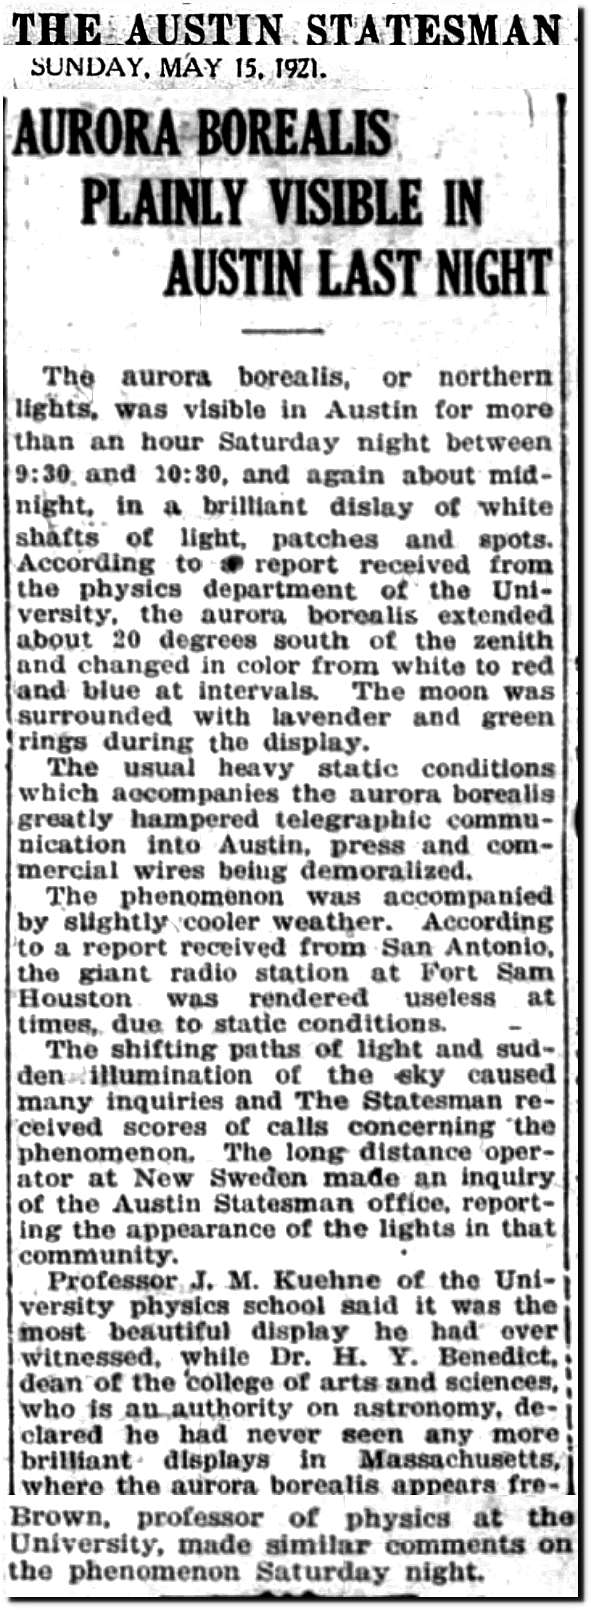
15 May 1921, 7 – Austin American-Statesman at Newspapers.com
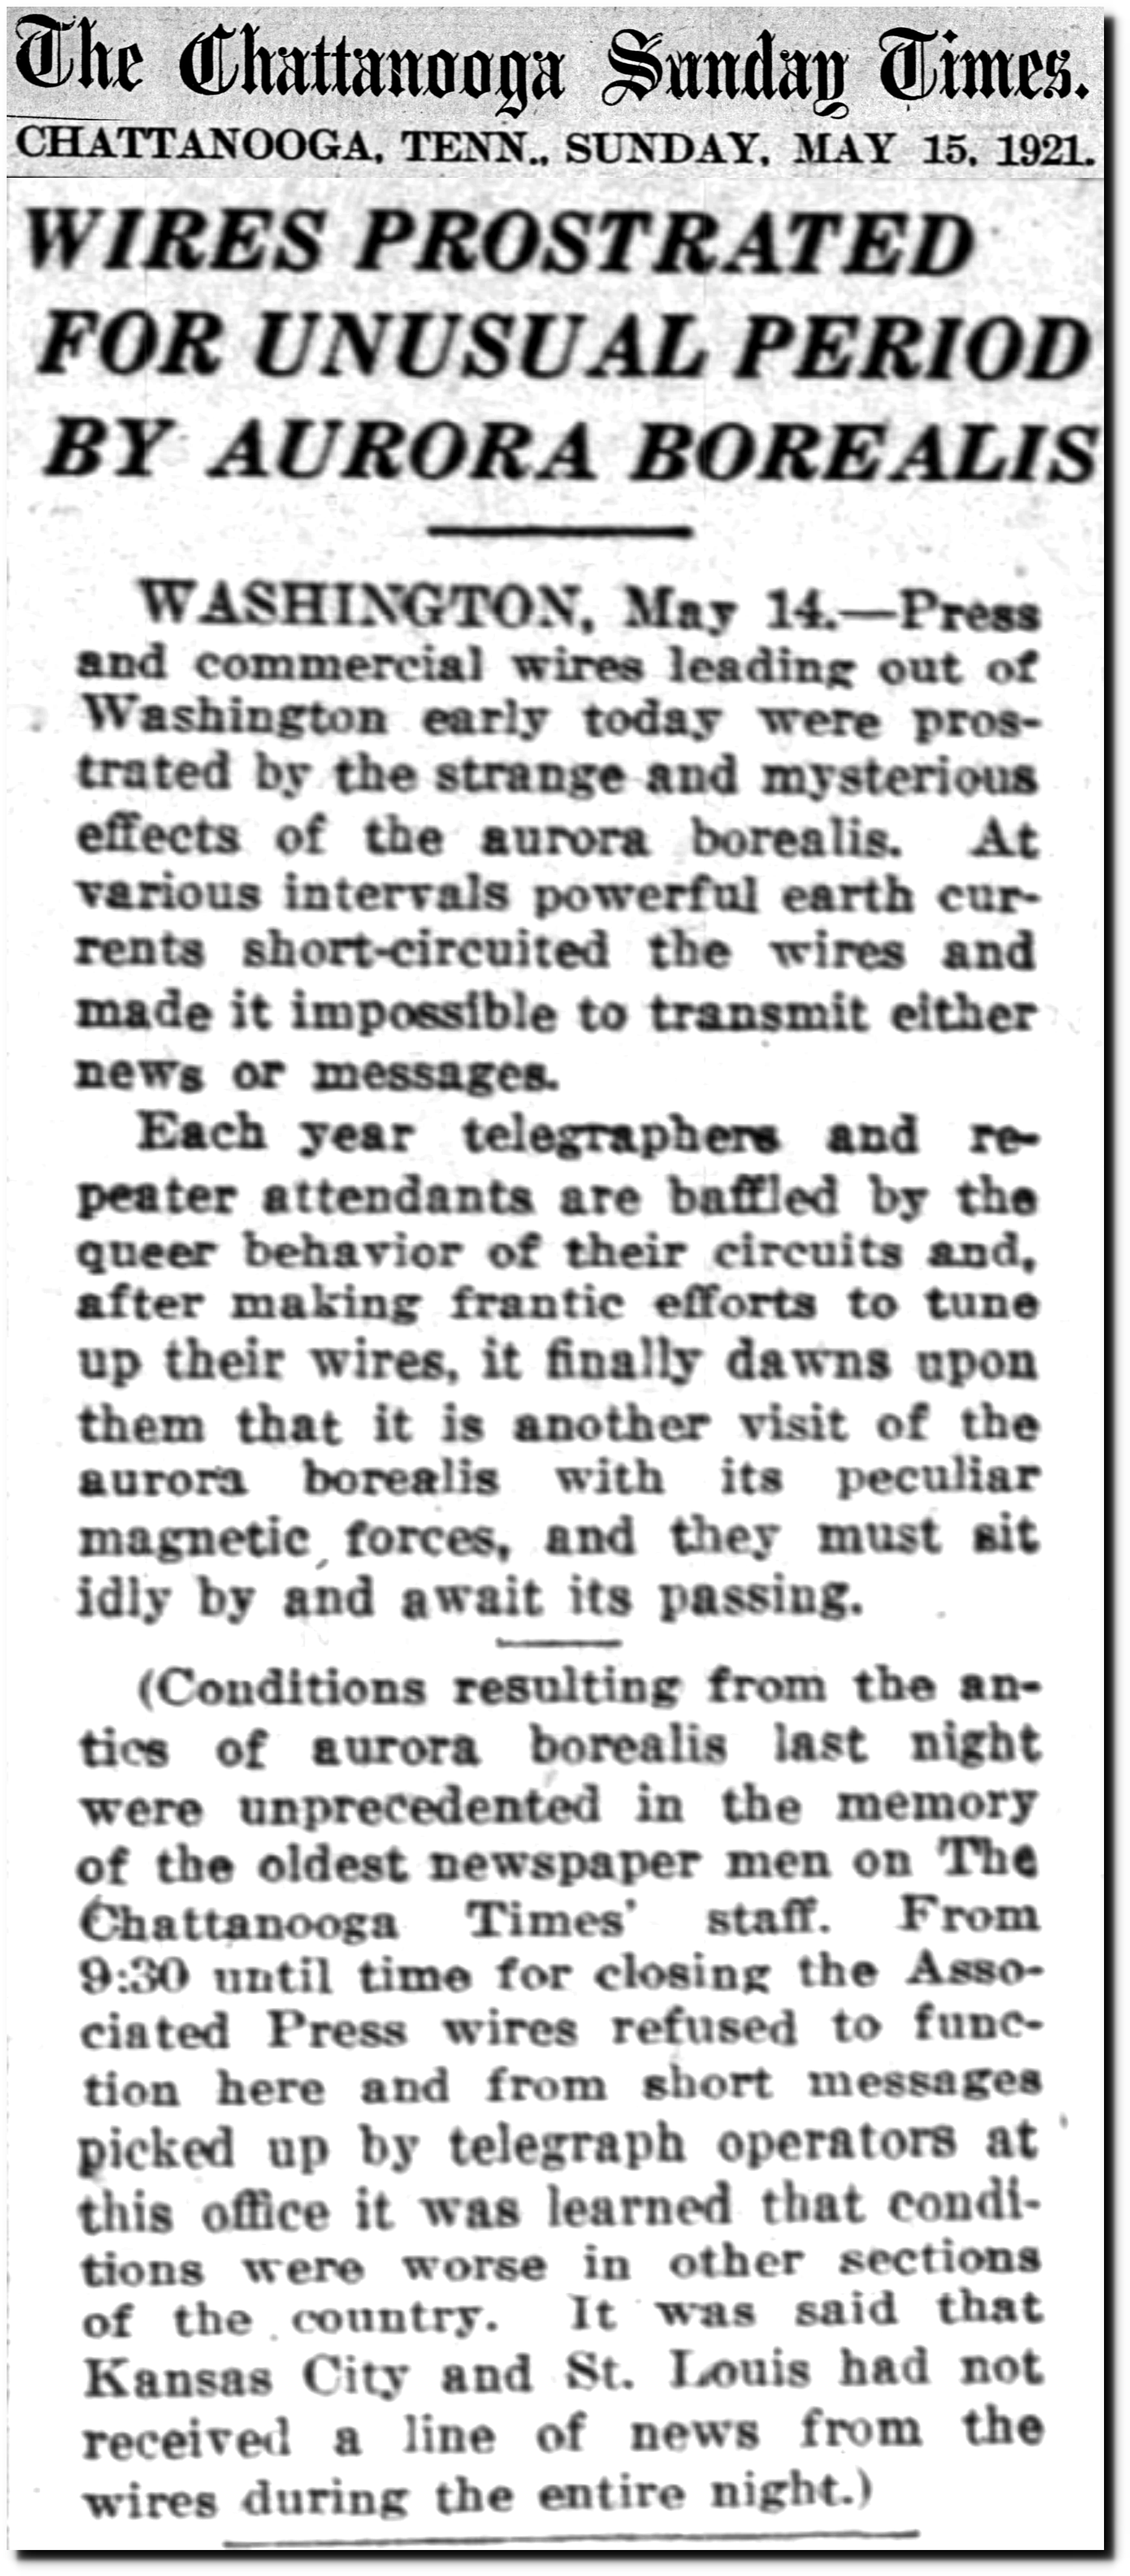
15 May 1921, 1 – Chattanooga Daily Times at Newspapers.com
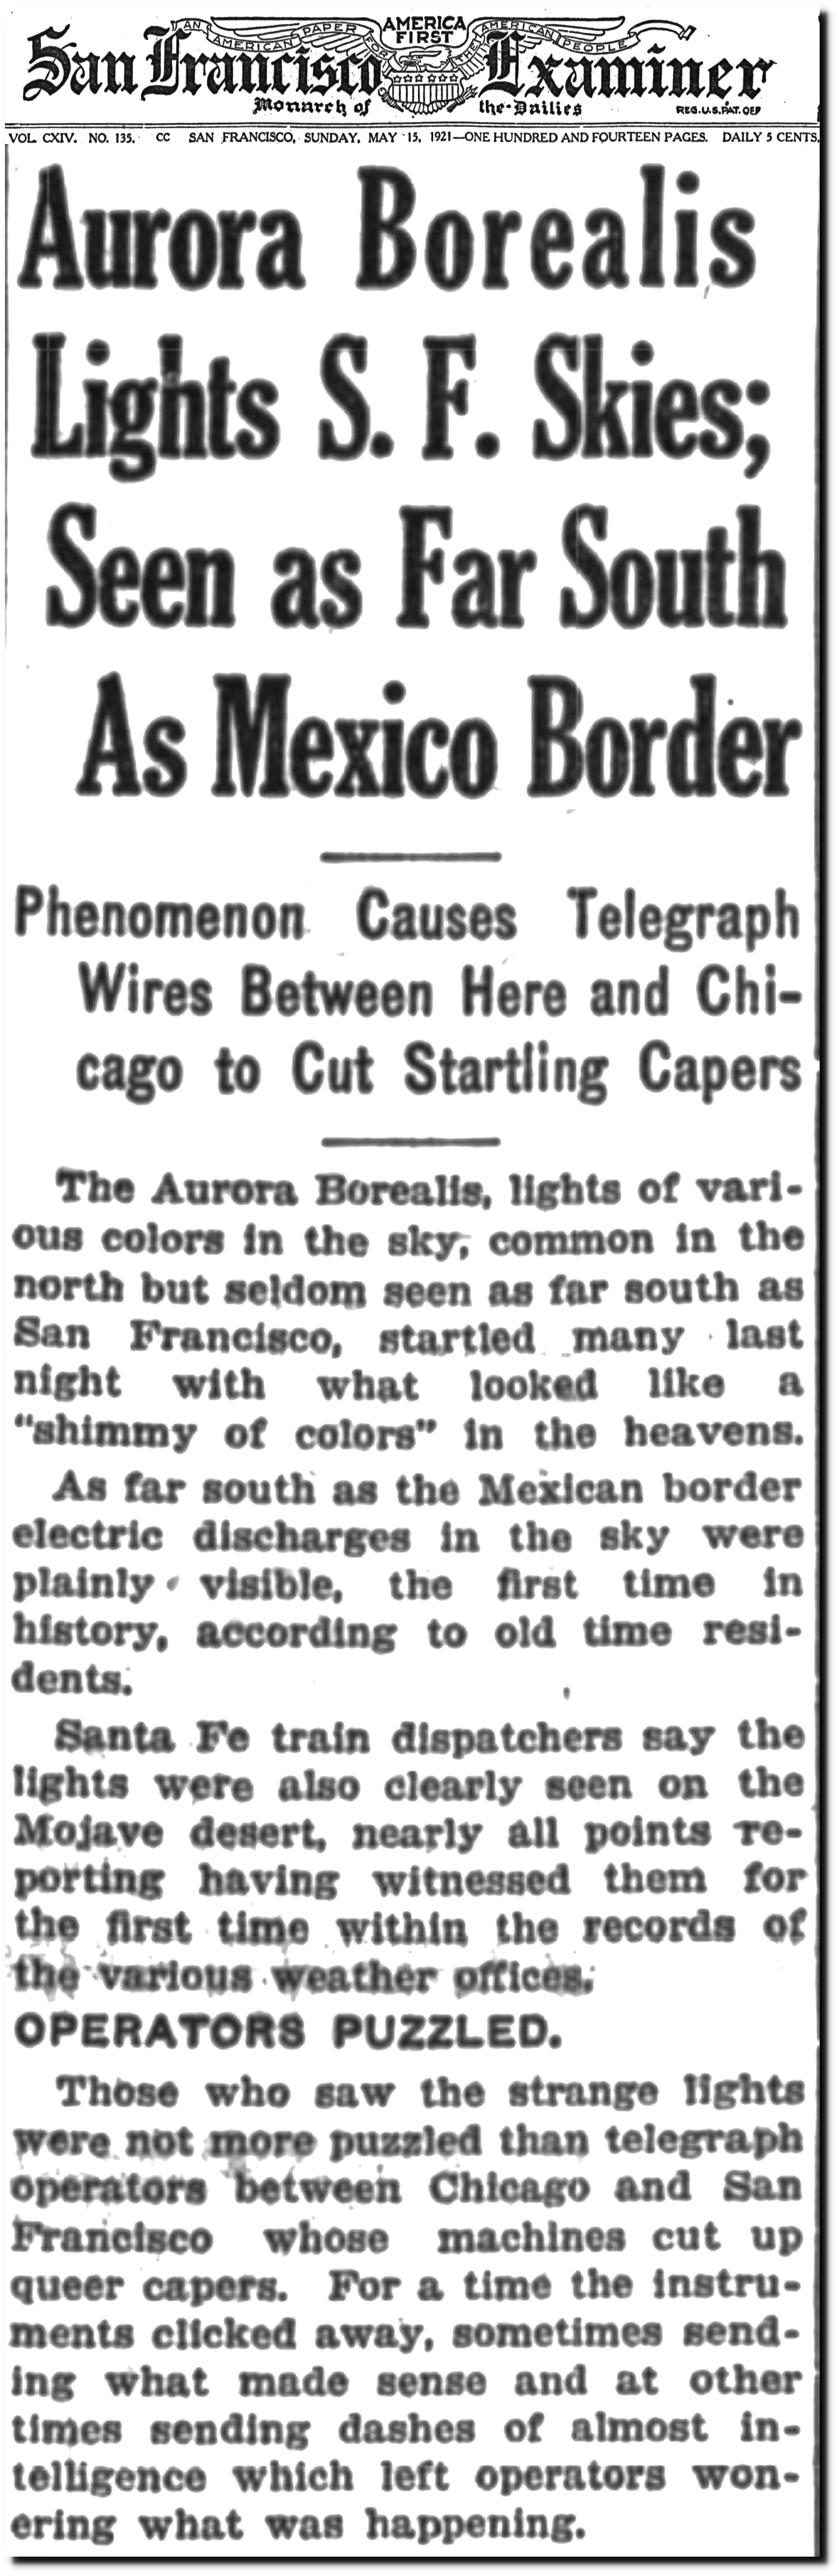
15 May 1921, 55 – The San Francisco Examiner at Newspapers.com
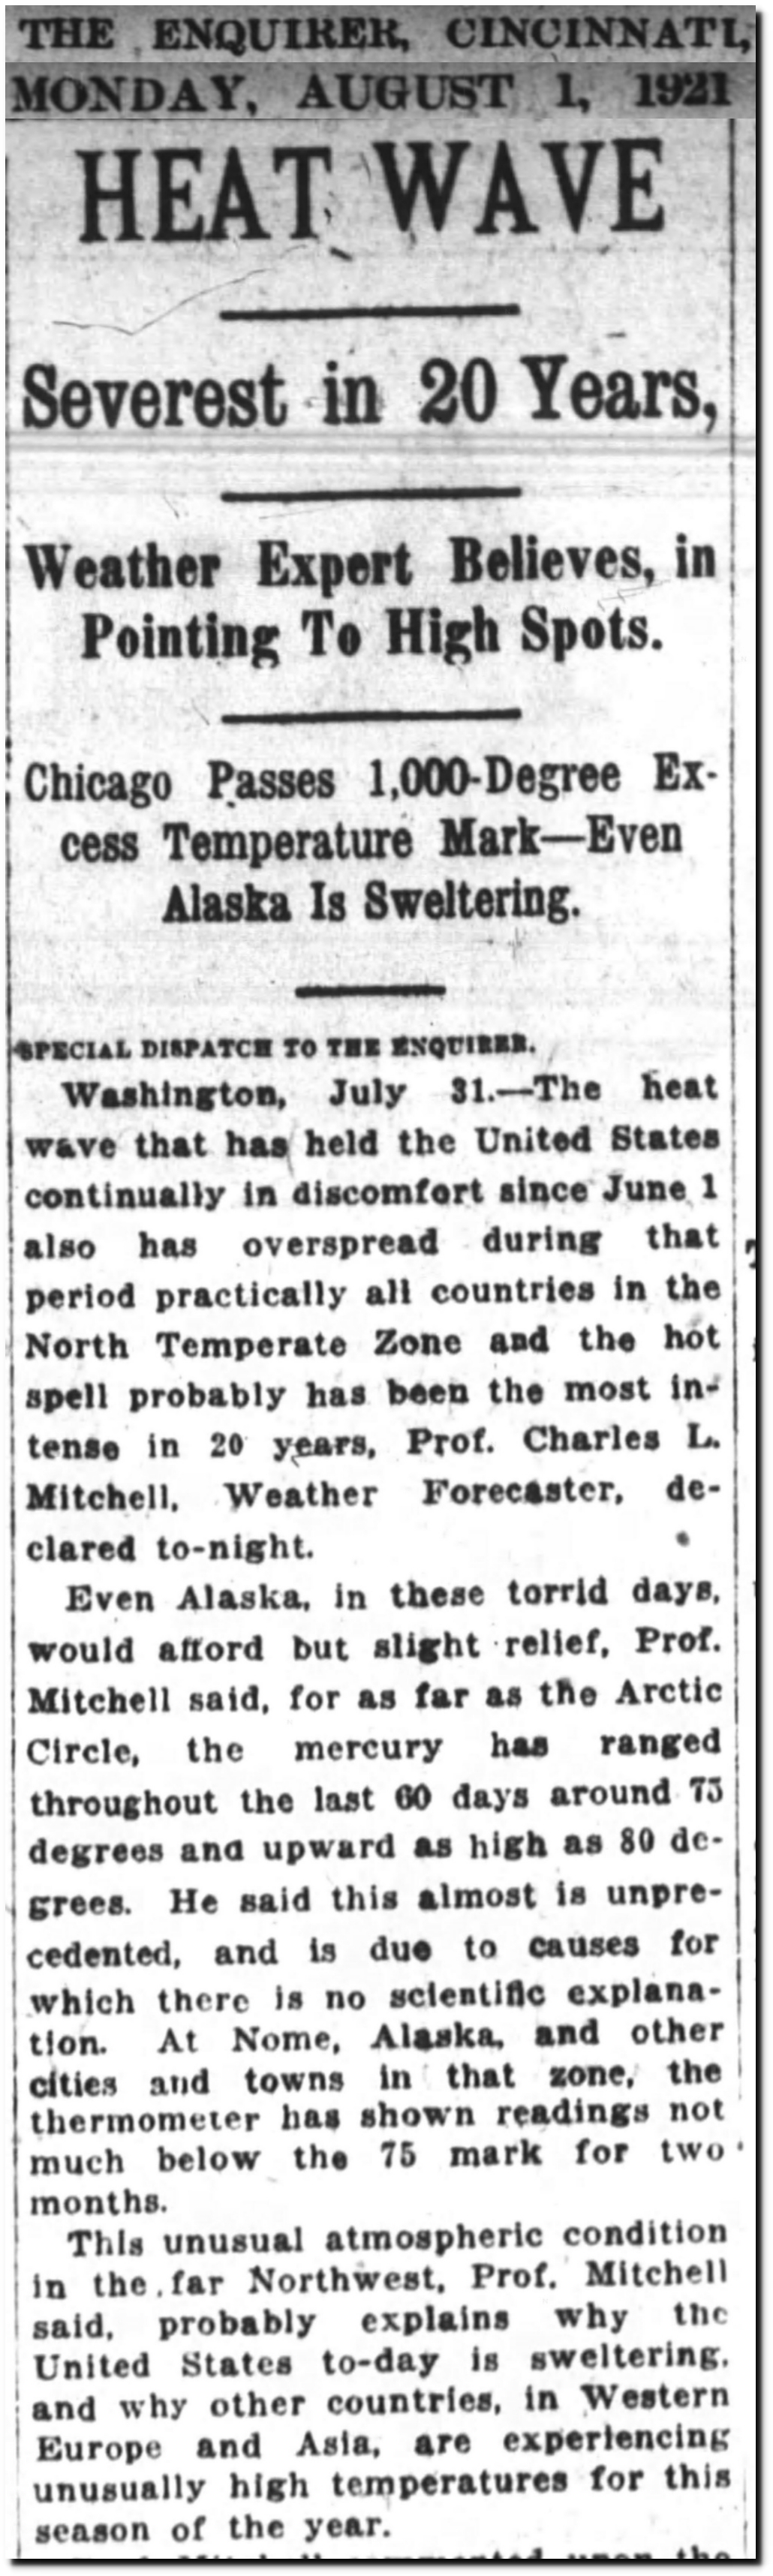
01 Aug 1921, Page 4 – The Cincinnati Enquirer at Newspapers.com
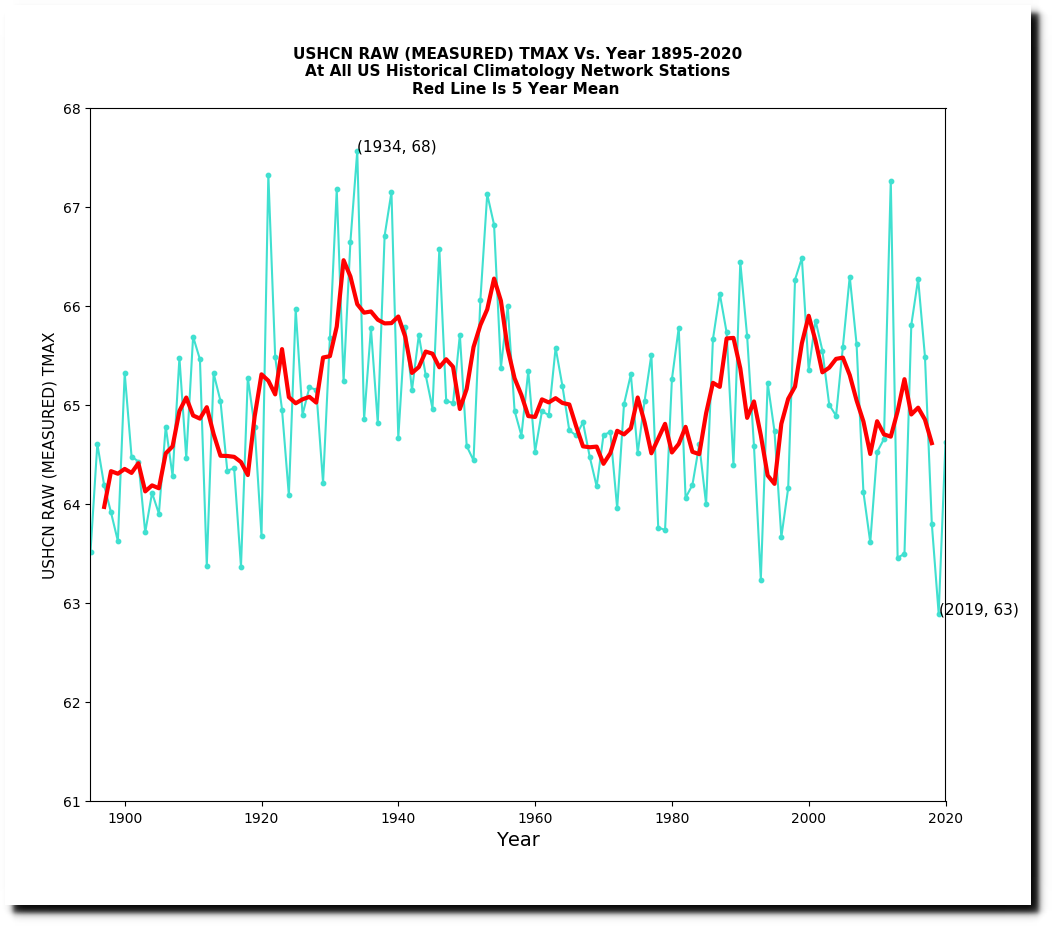
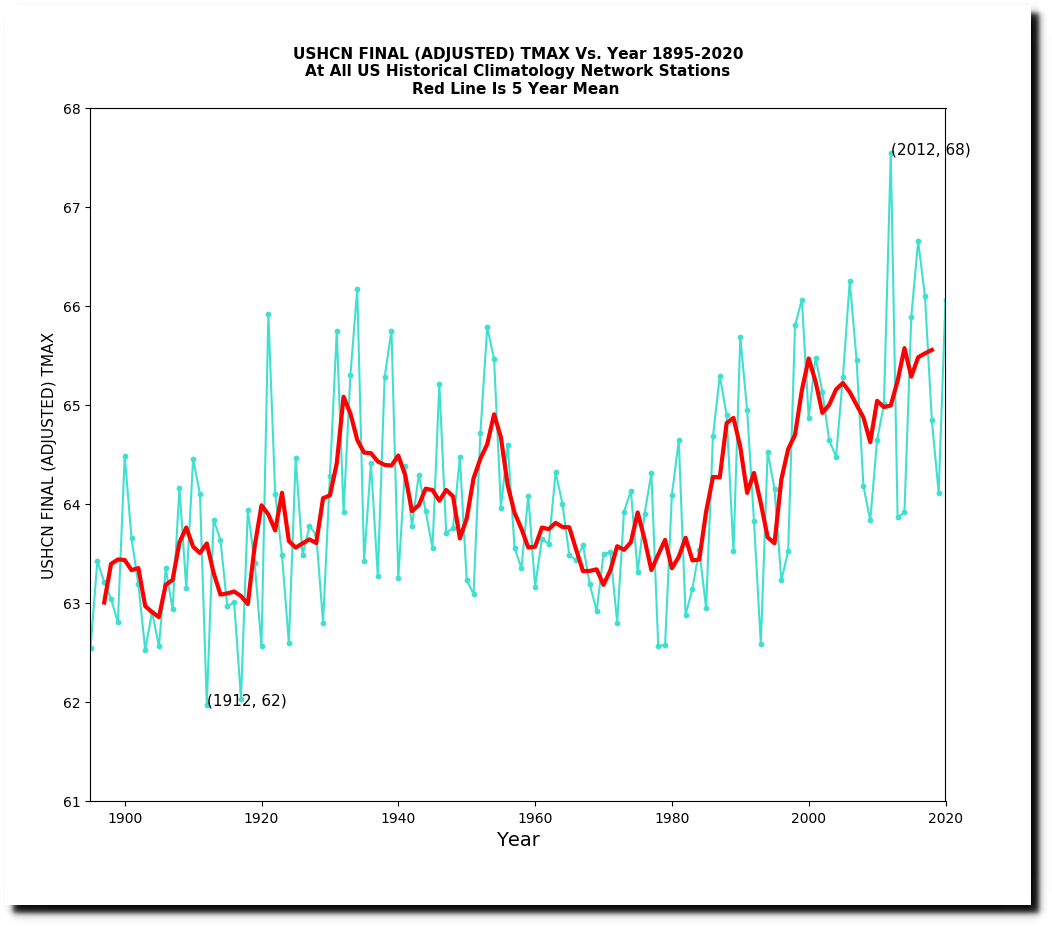
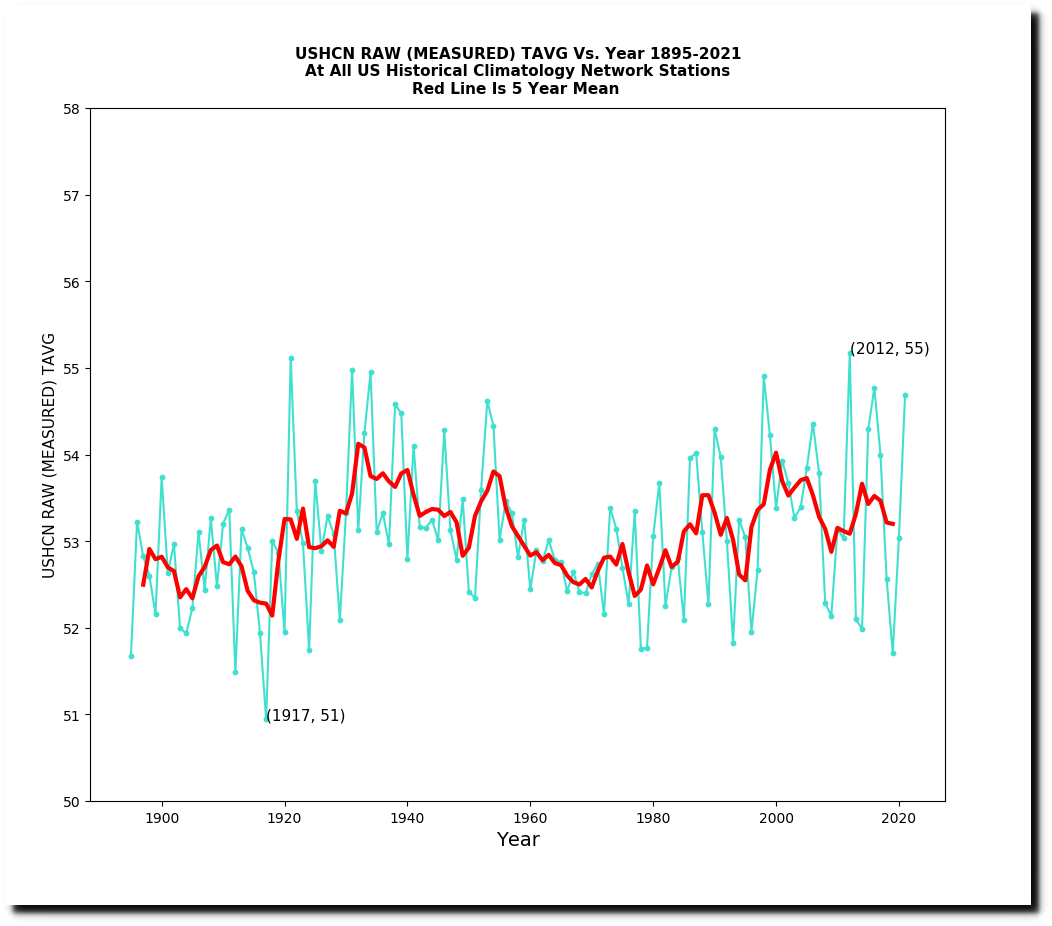
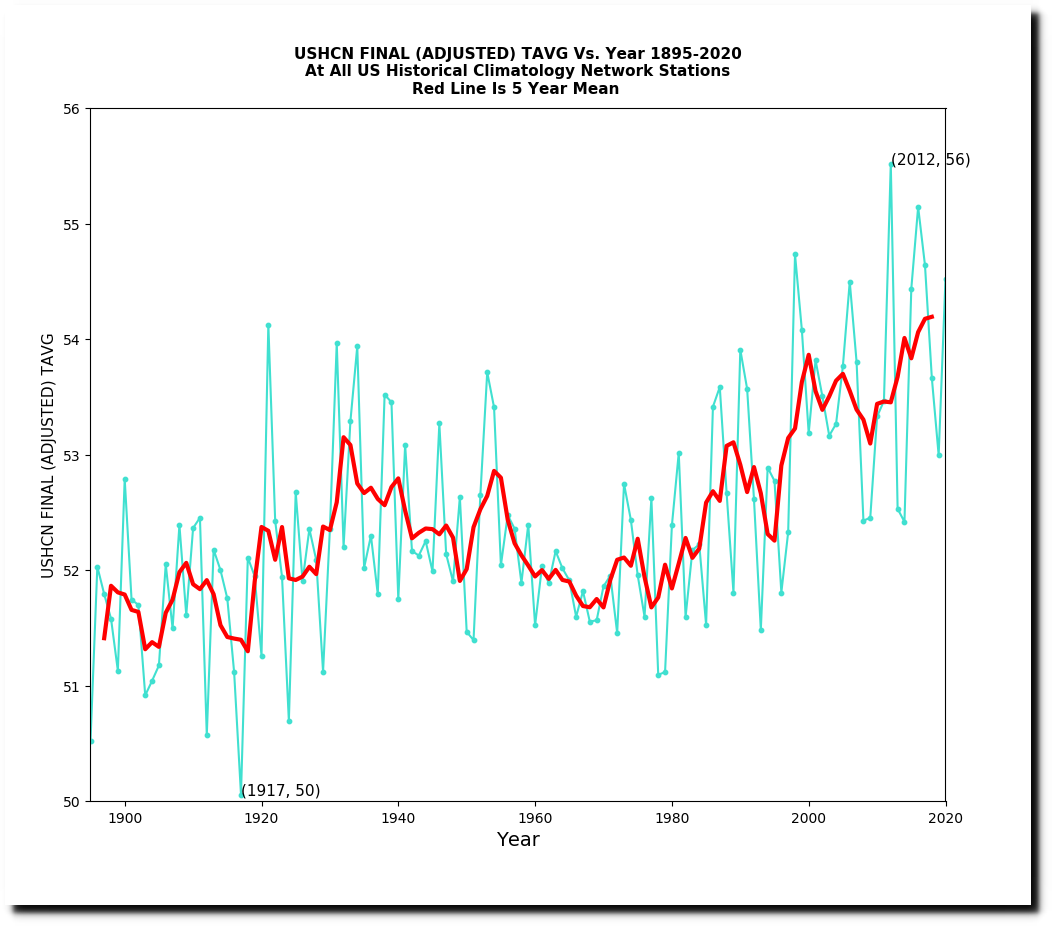
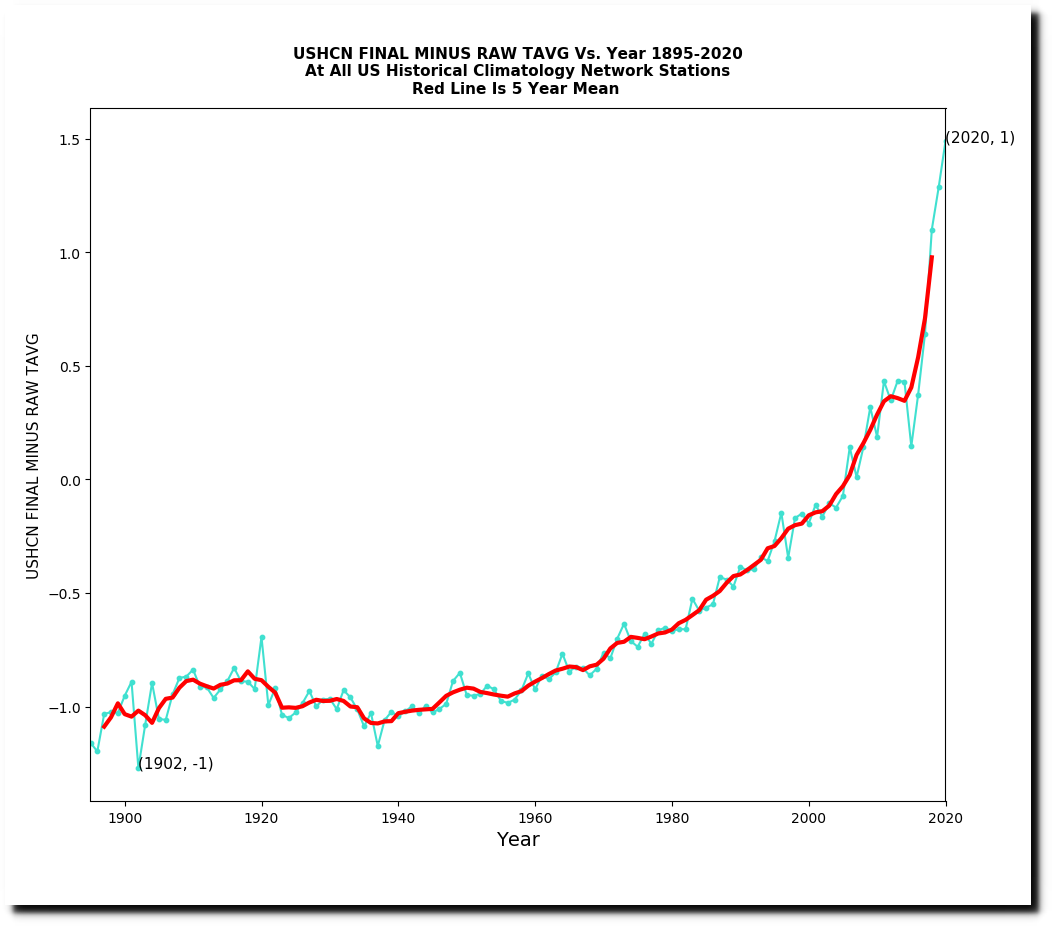
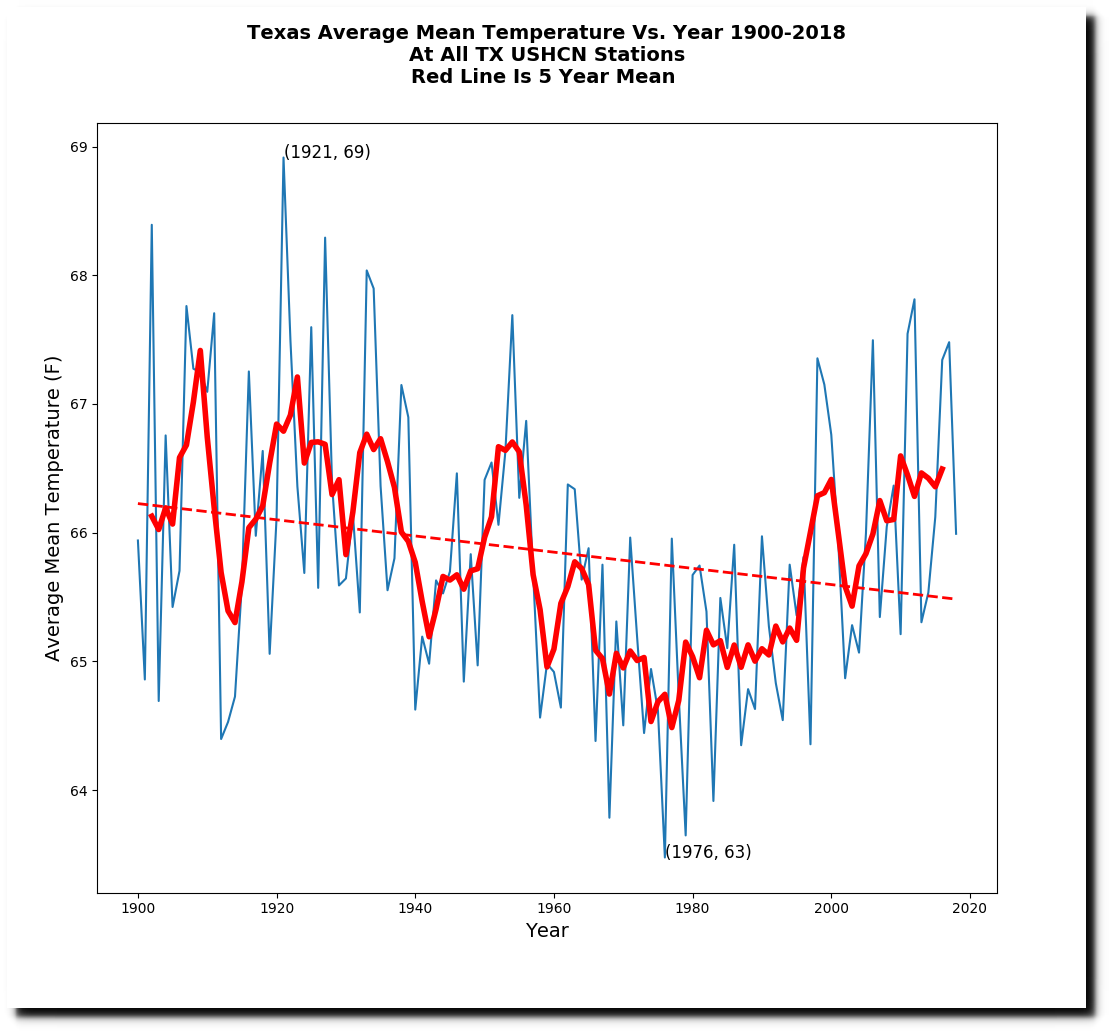
But NASA has erased the heat of 1921
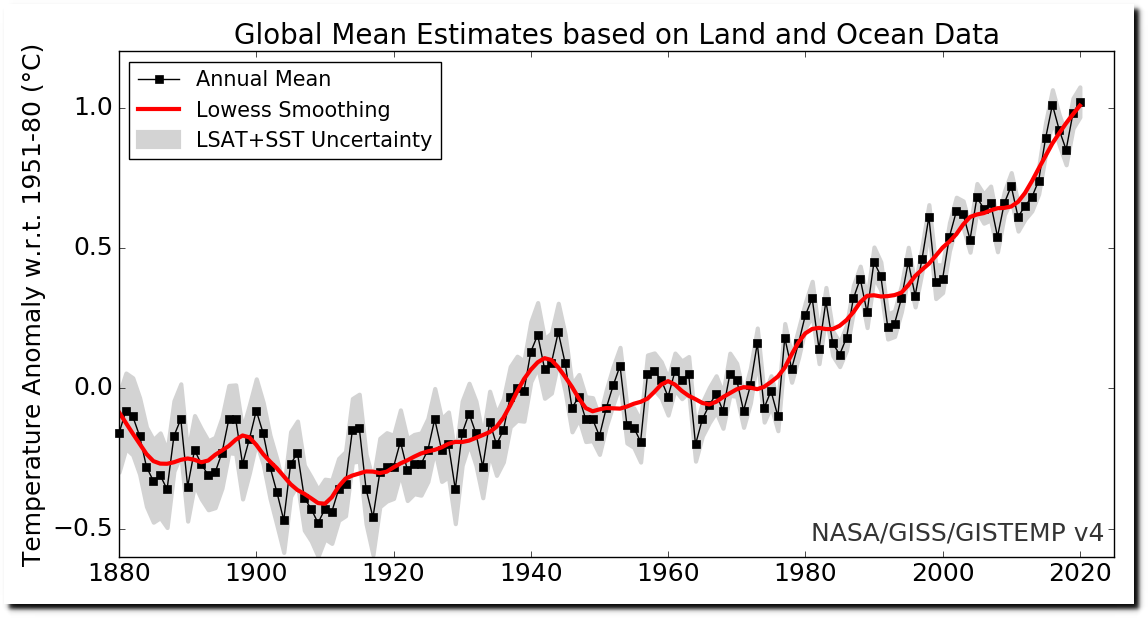
Likewise in the US, NOAA has erased the heat of 1921, which was the second hottest year.
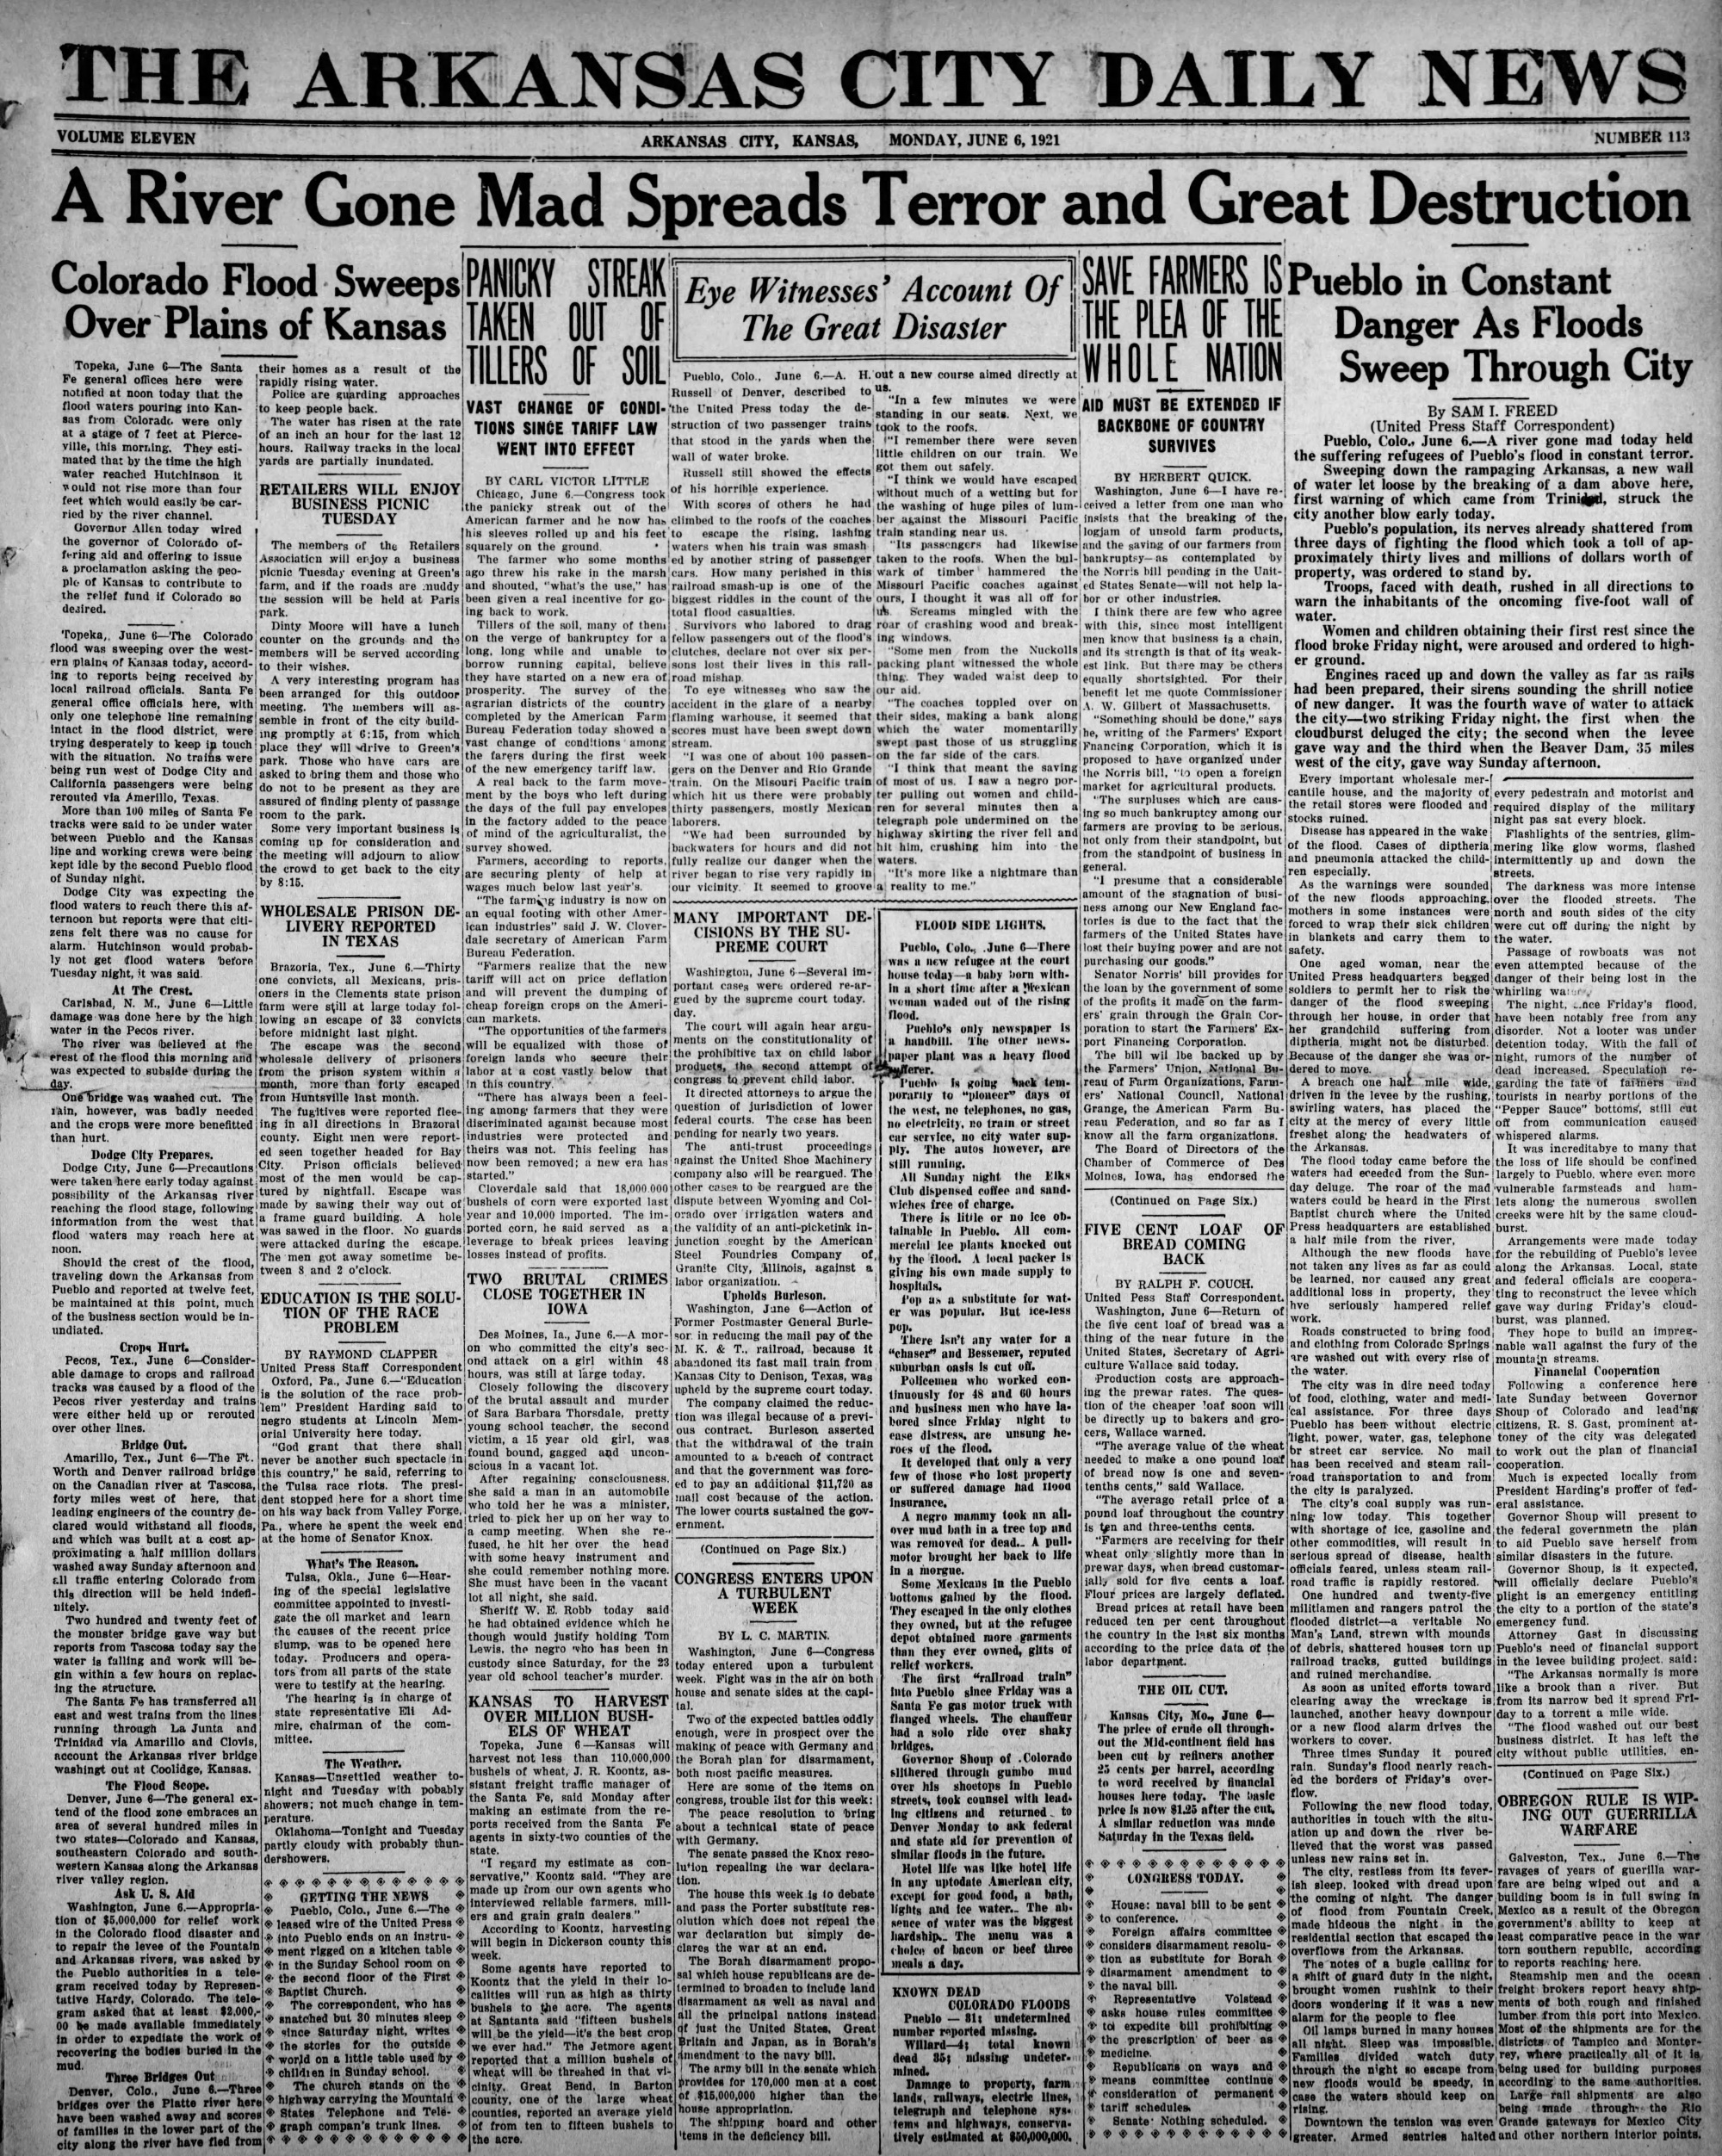
06 Jun 1921, 1 – The Arkansas City Daily News at Newspapers.com
Posted in Uncategorized
Leave a comment
“The Process Of Demoralization Is Complete And Irreversible”
Posted in Uncategorized
Leave a comment
“A Trifling Investment Of Fact”
“There is something fascinating about science. One gets such wholesale returns of conjecture out of such a trifling investment of fact.”
? Mark Twain
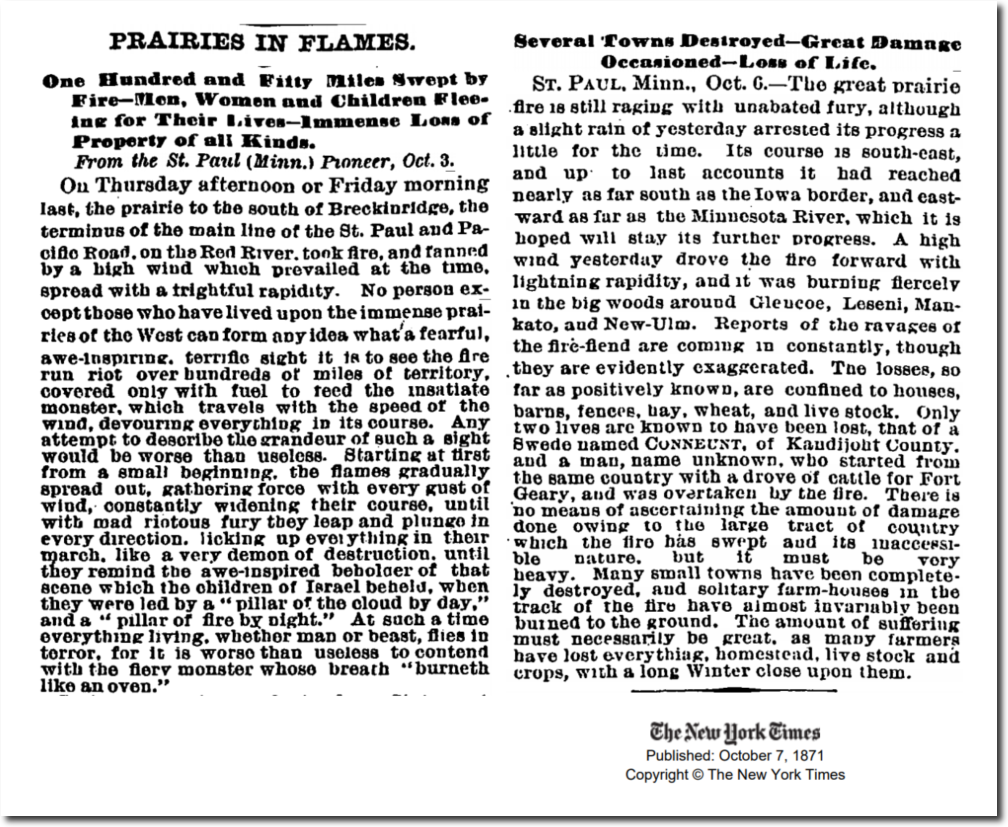
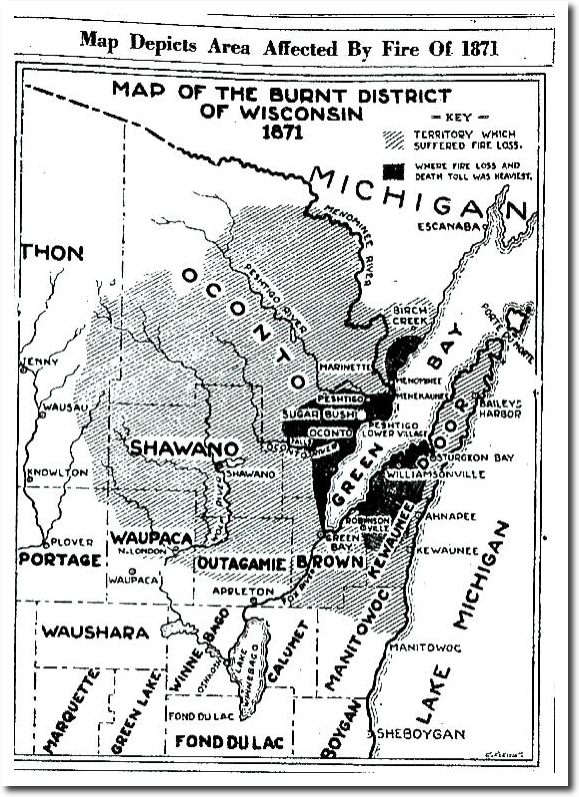
This week in 1871 brought the deadliest fires in US history. On October 7, 1871 much of Minnesota and Wisconsin were burning.
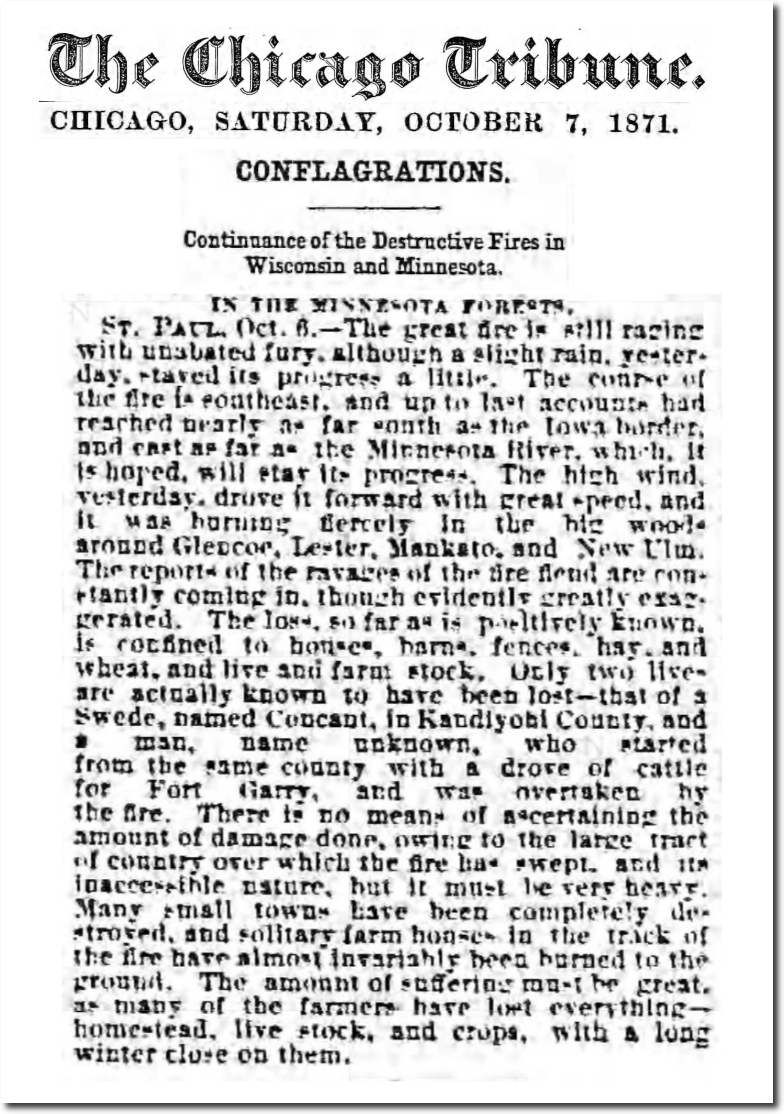
07 Oct 1871, 1 – Chicago Tribune at Newspapers.com
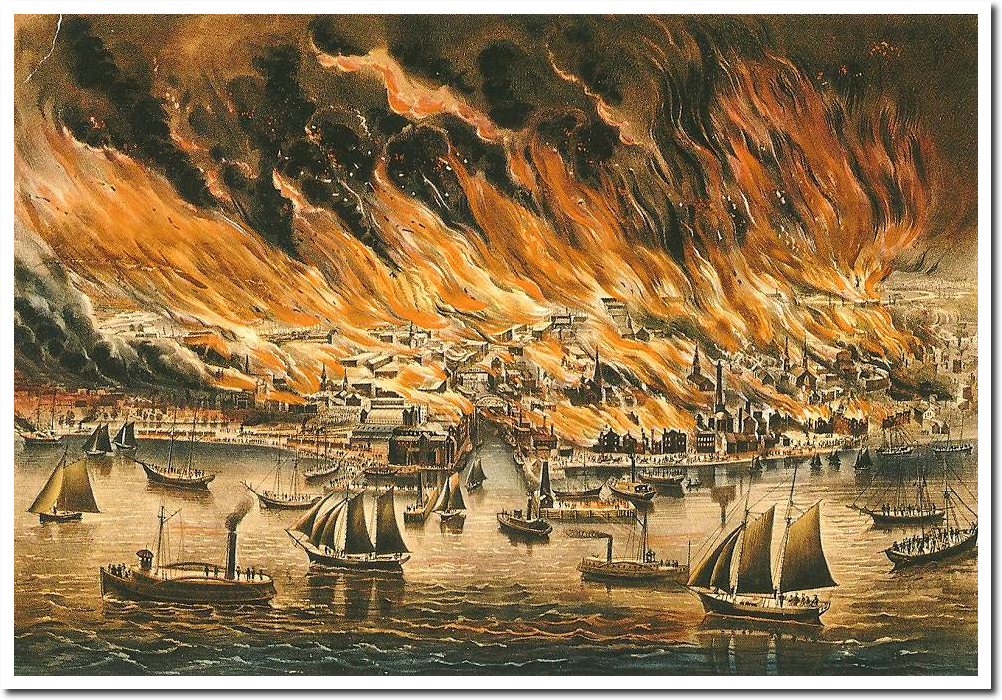
The following day Chicago burned to the ground, and many other towns around the Great Lakes in flames.
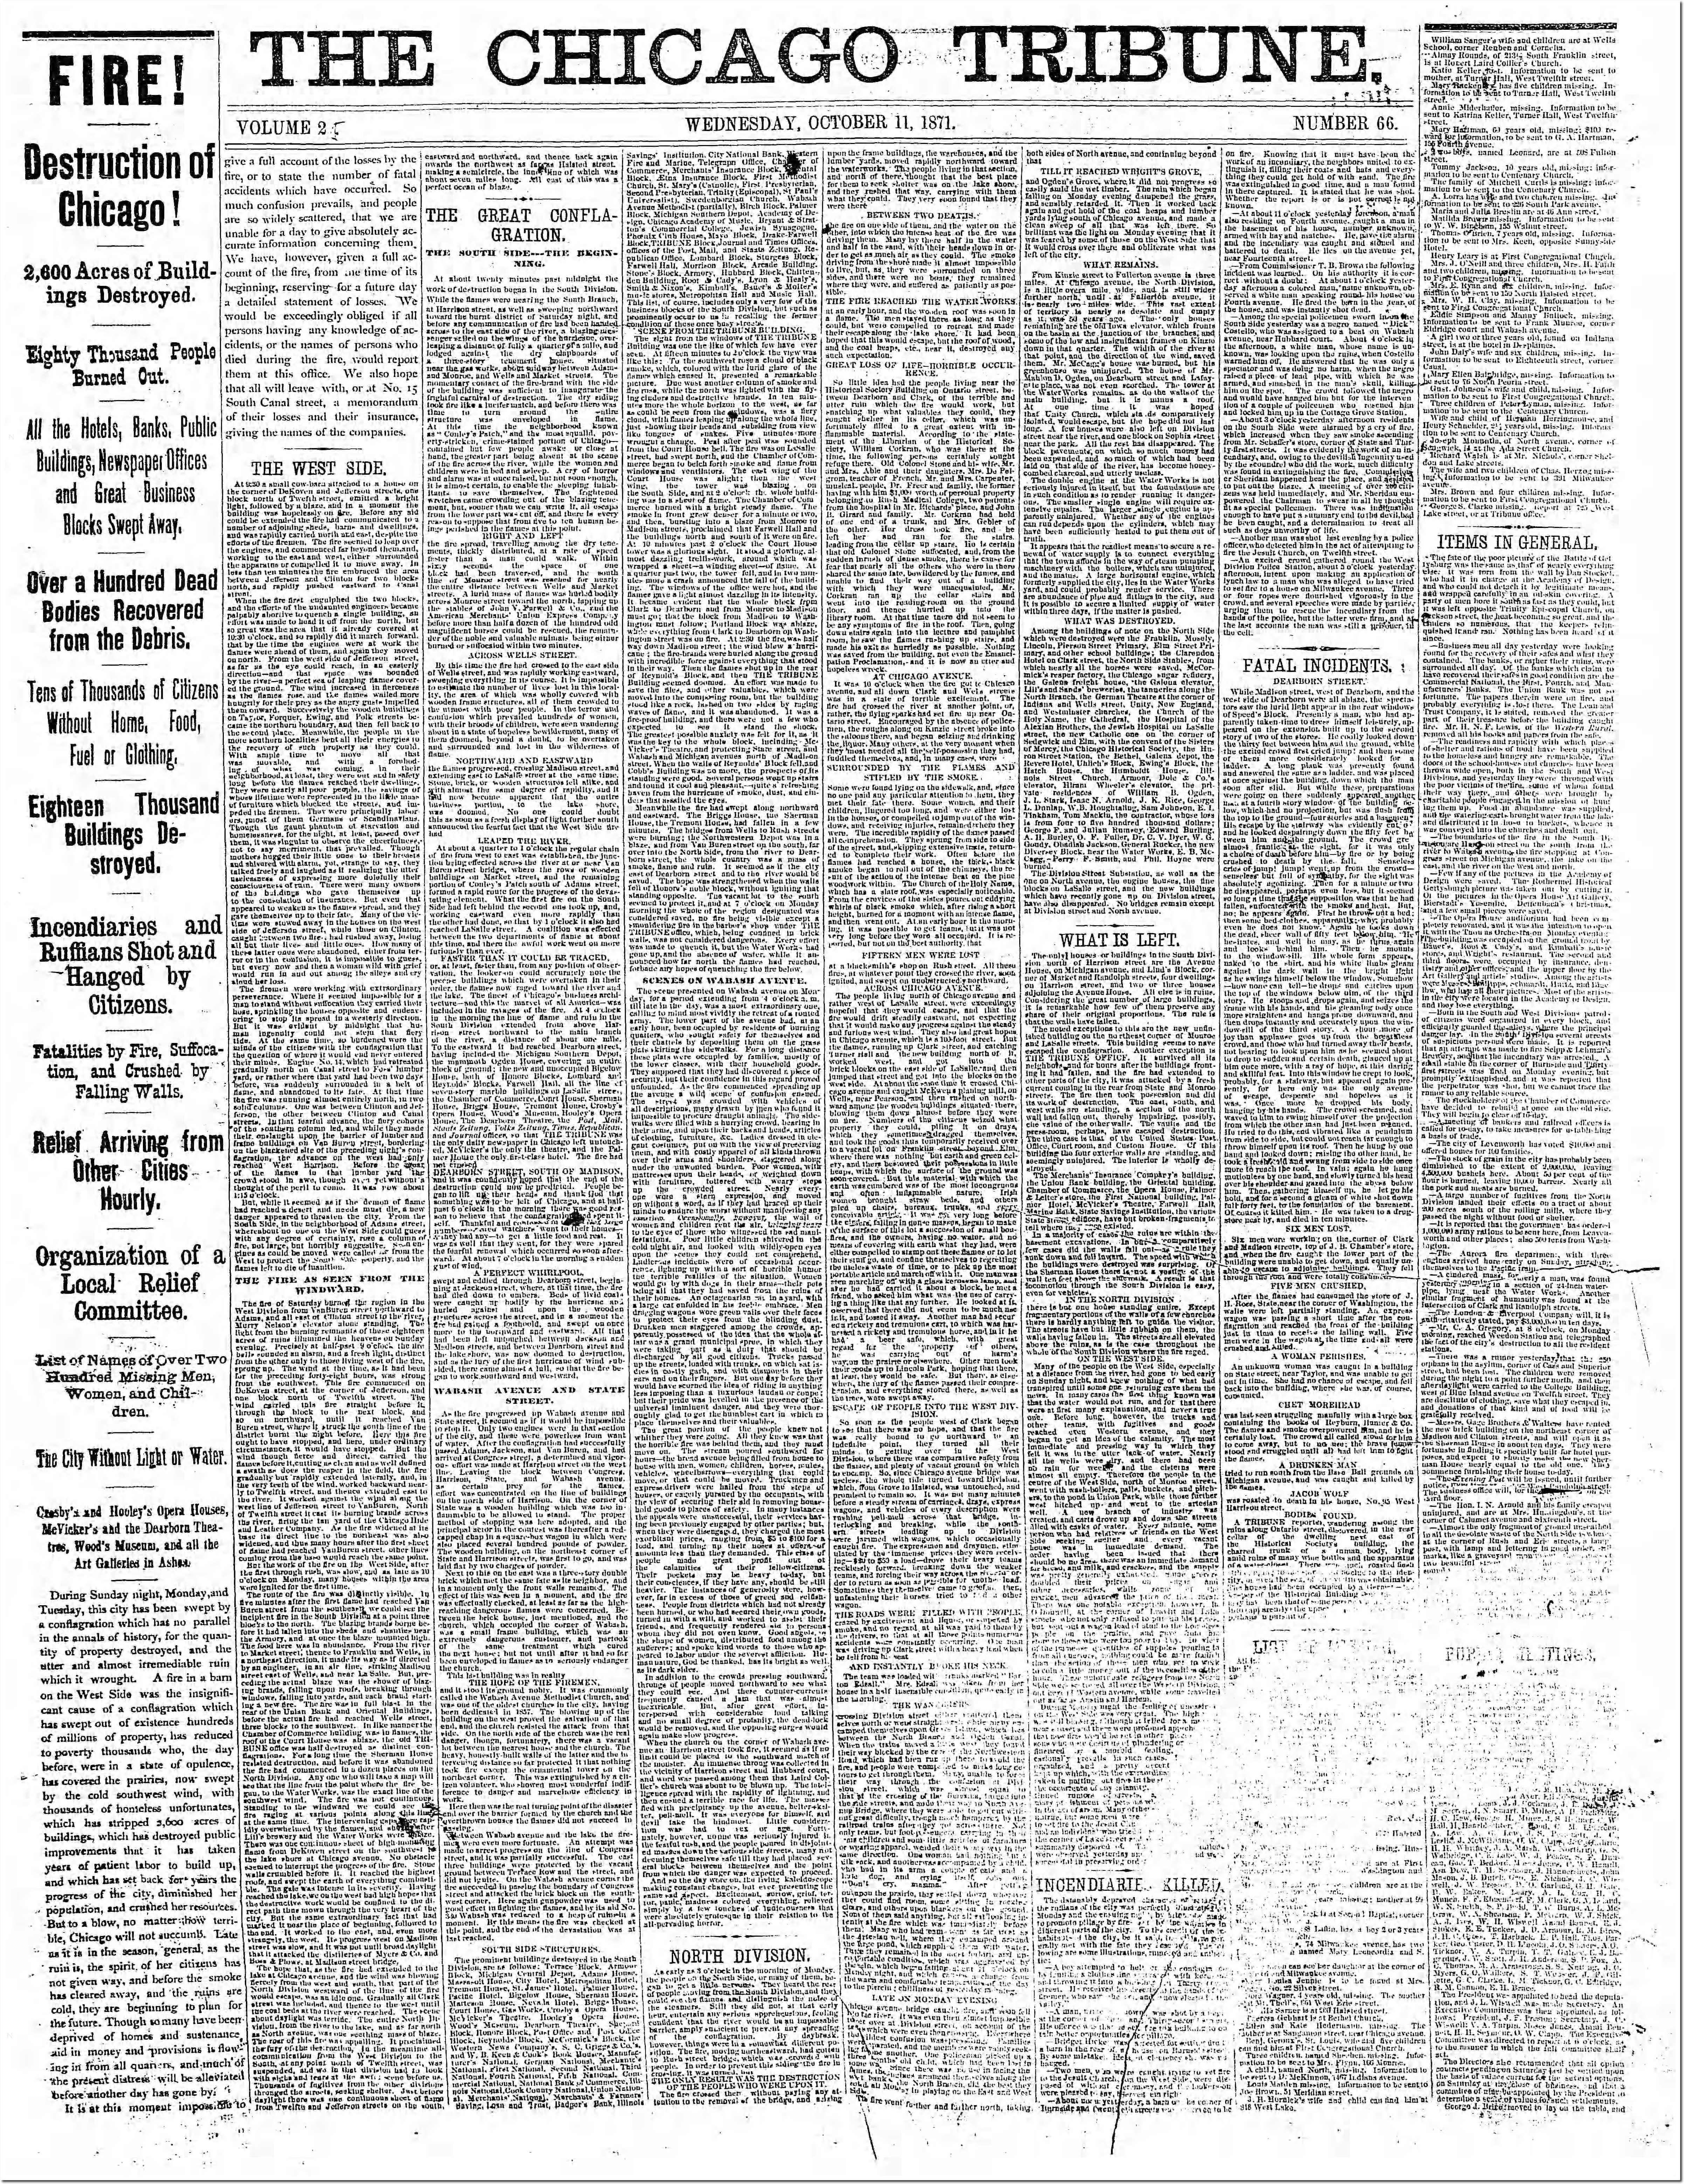
11 Oct 1871, 1 – Chicago Tribune at Newspapers.com
There were massive fires in Wisconsin, Michigan and the Rocky Mountains.
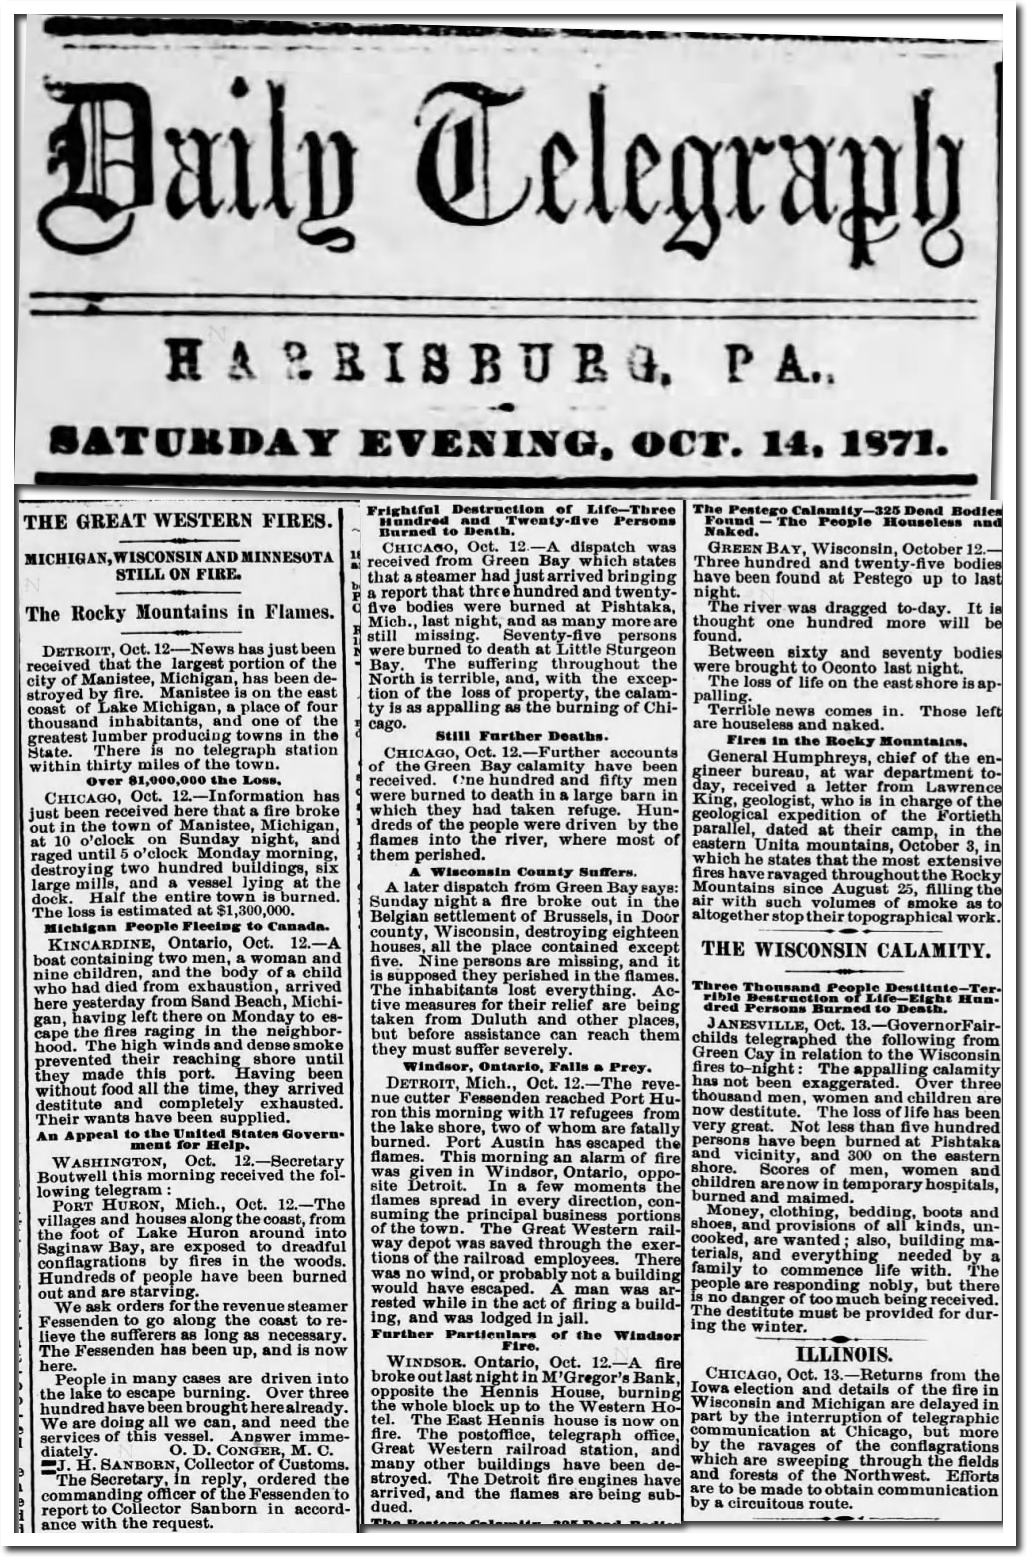
14 Oct 1871, Page 2 – Harrisburg Telegraph at Newspapers.com
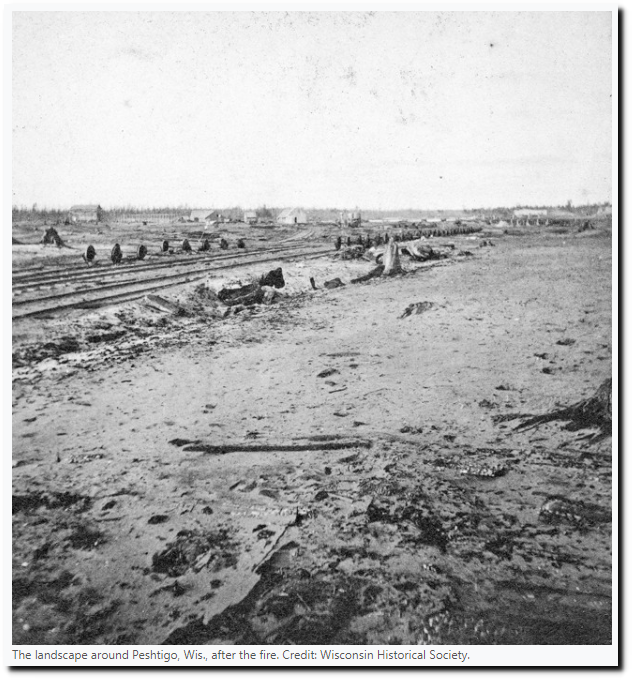
The worst of these fires occurred at Peshtigo, Wisconsin, where more than one thousand people burned to death.
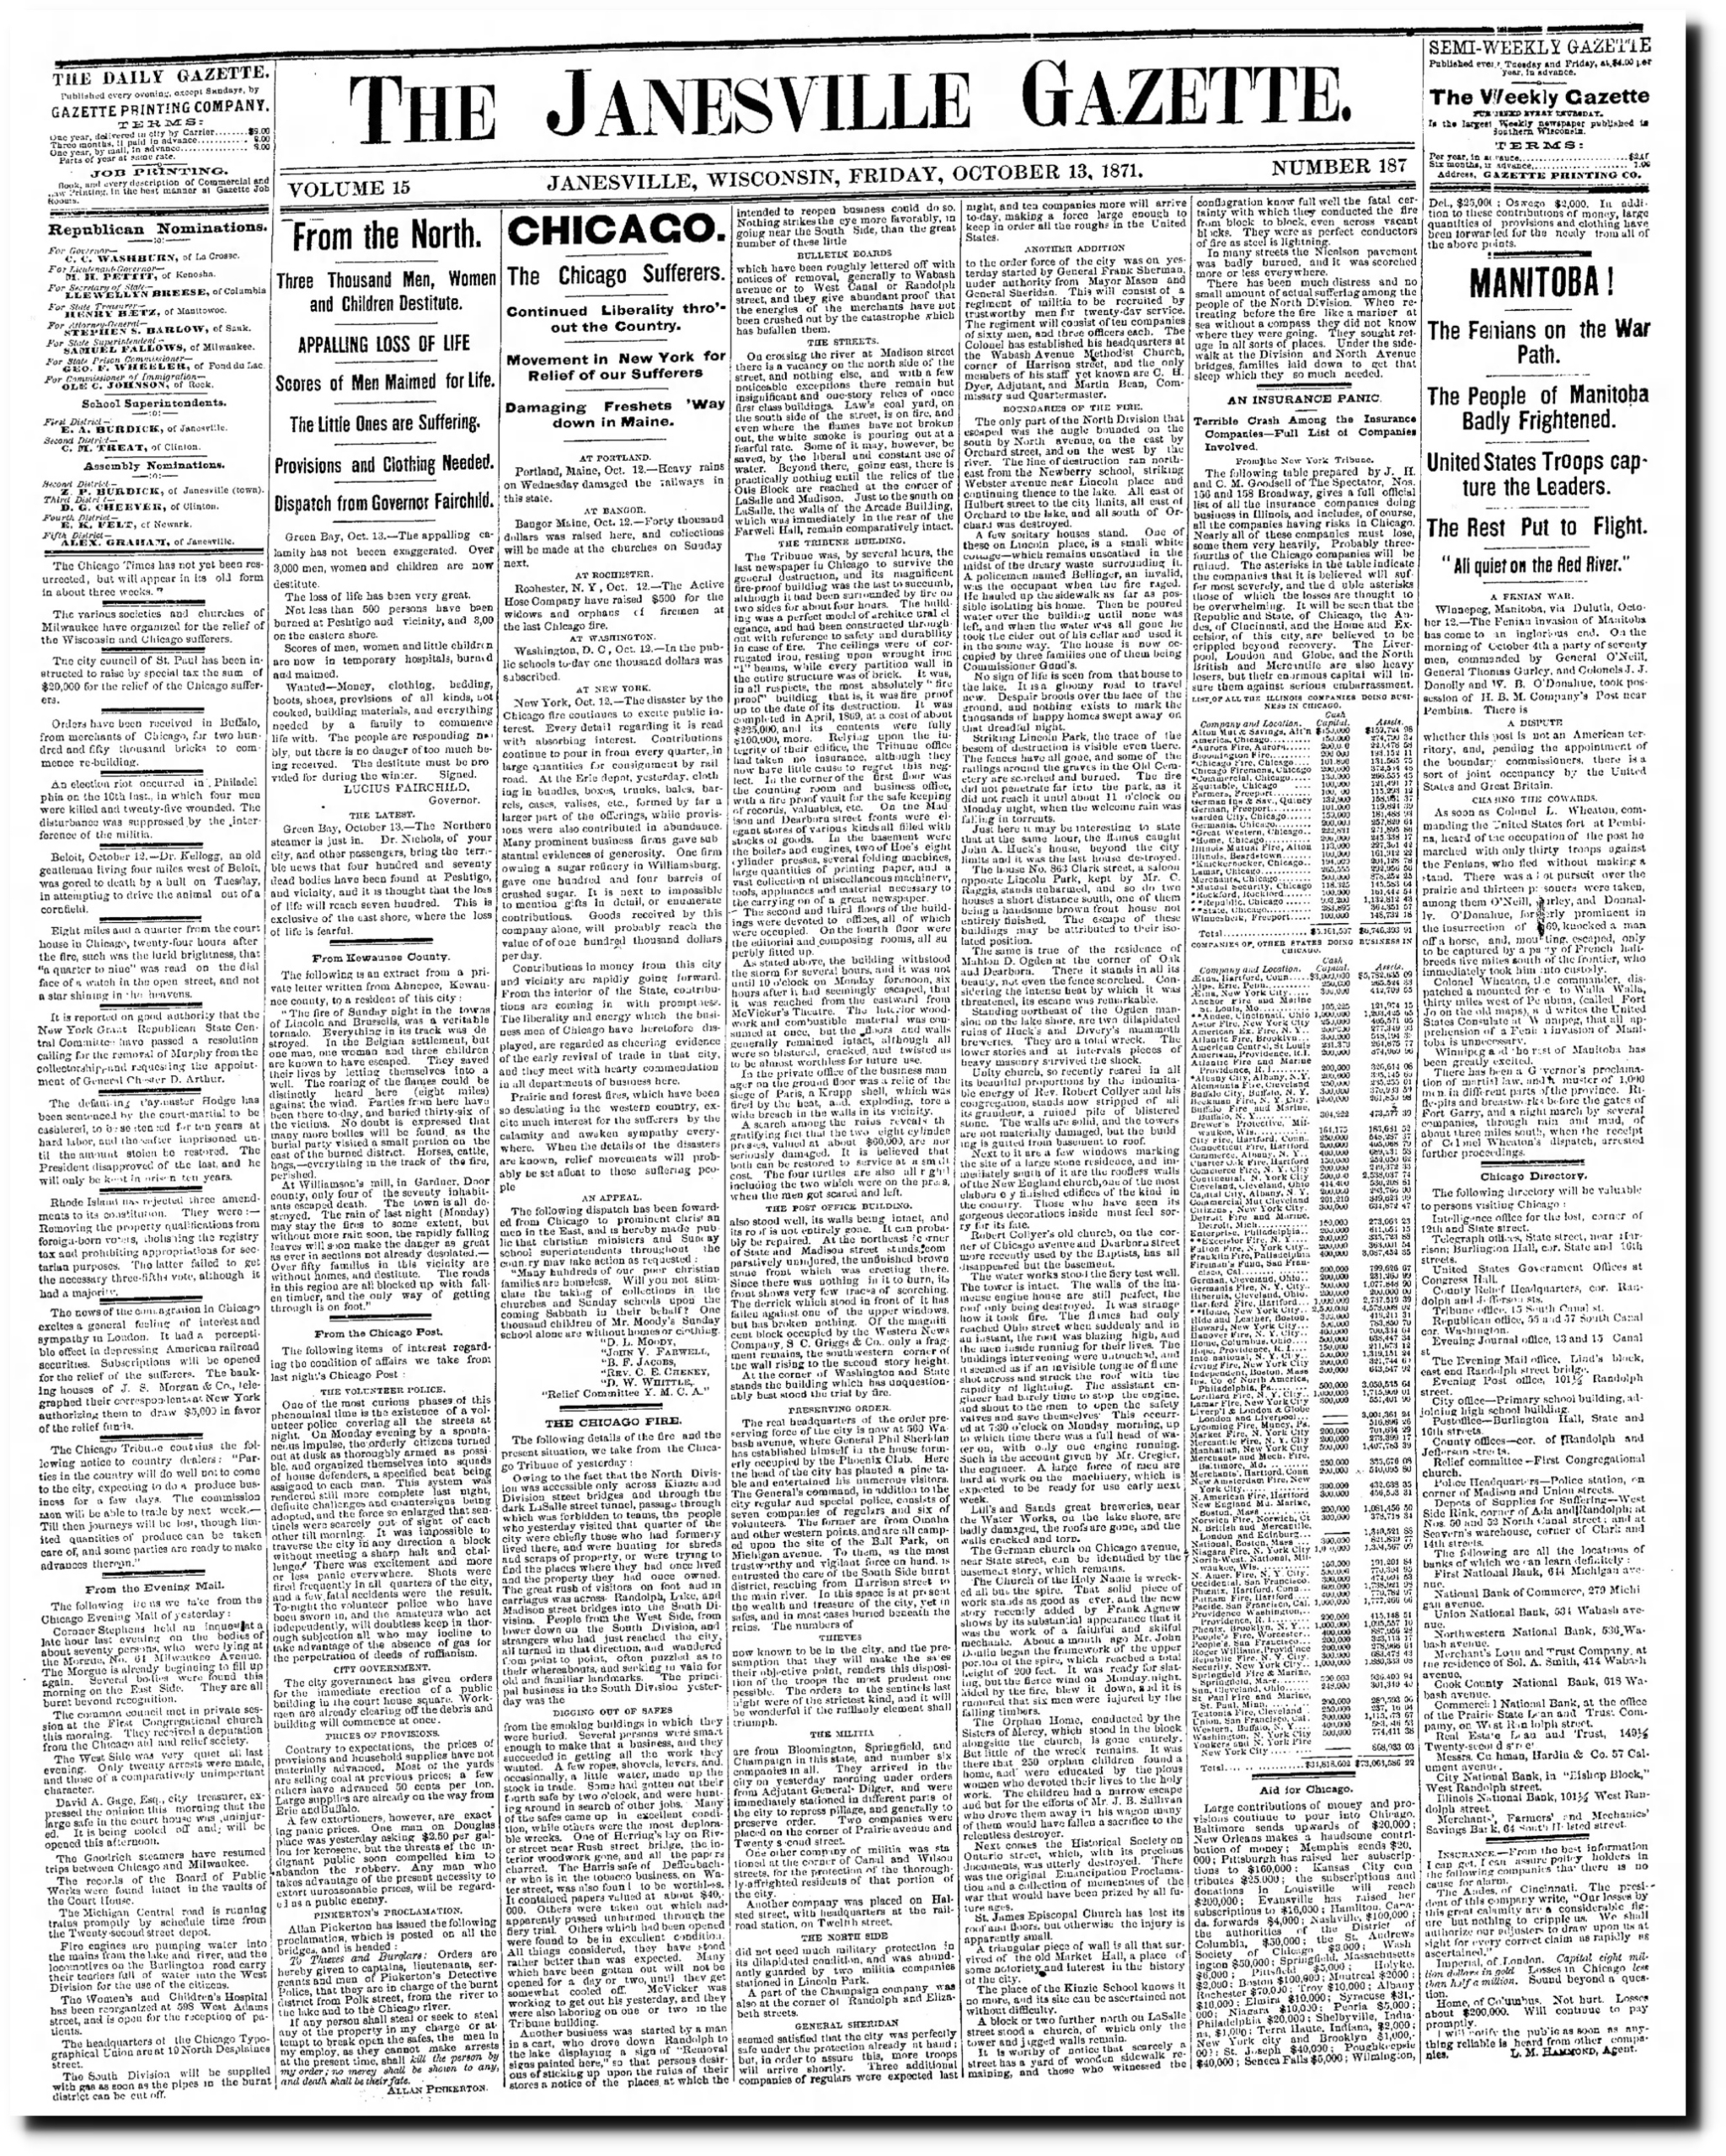
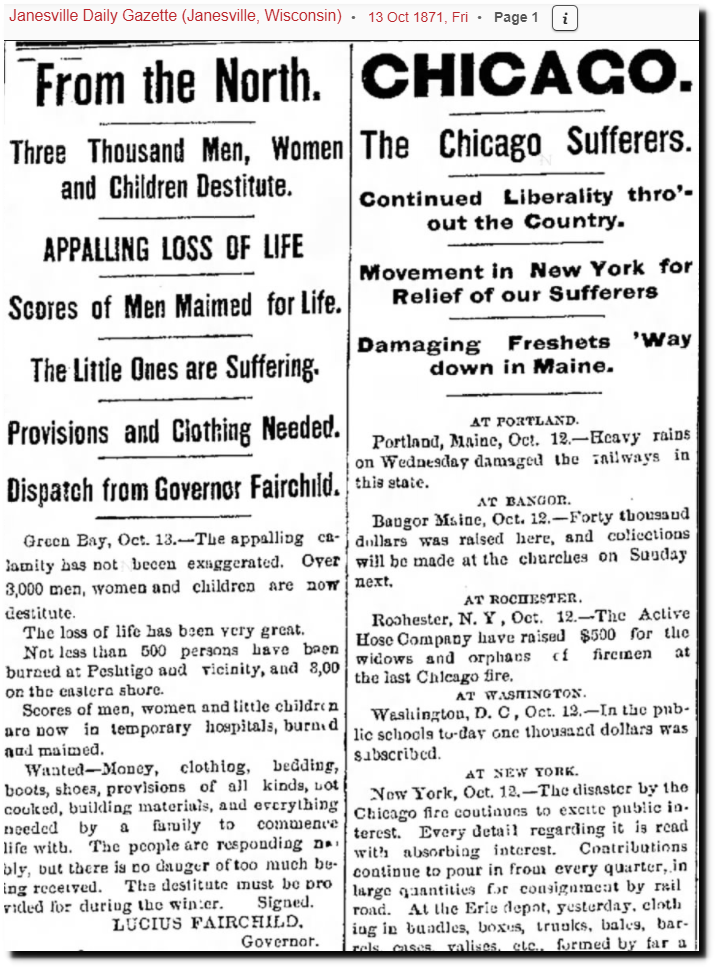
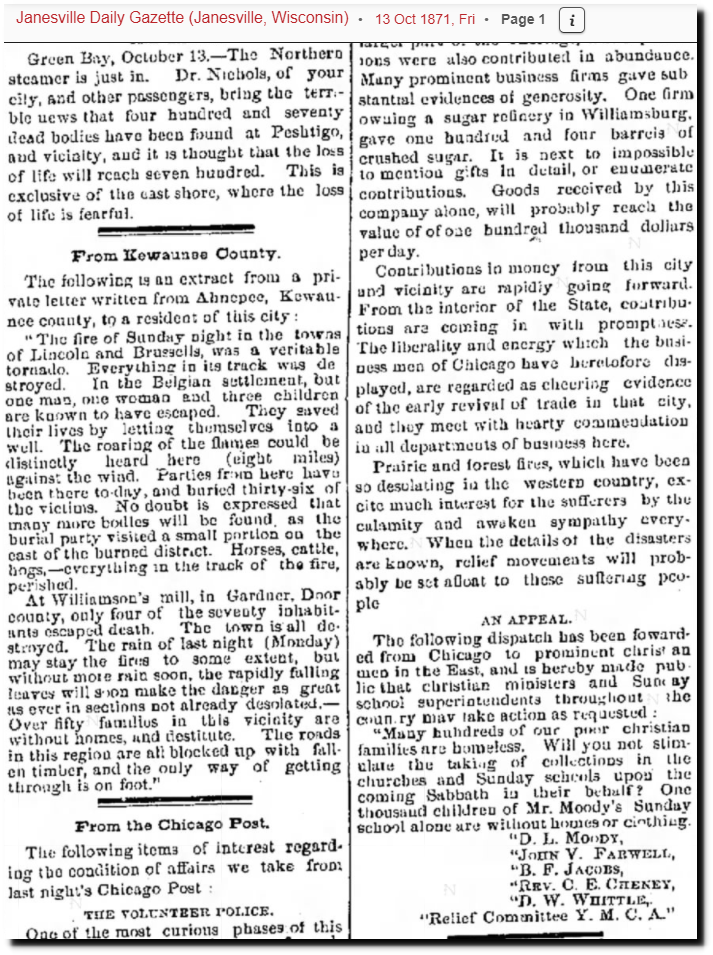
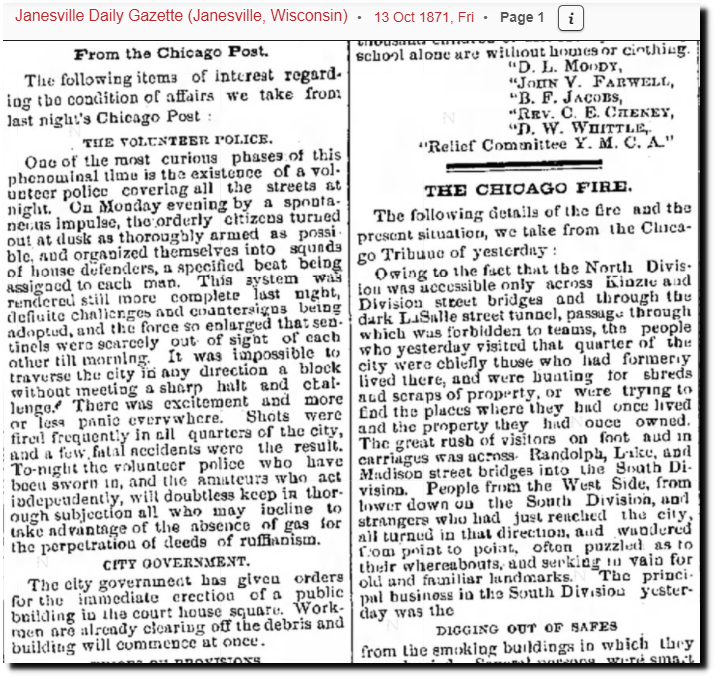
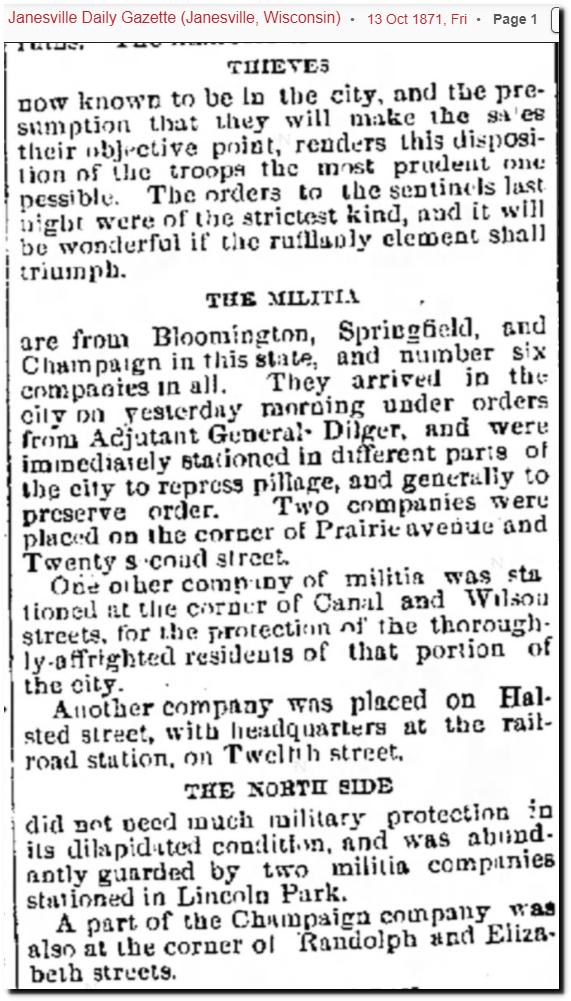
13 Oct 1871, Page 1 – Janesville Daily Gazette at Newspapers.com
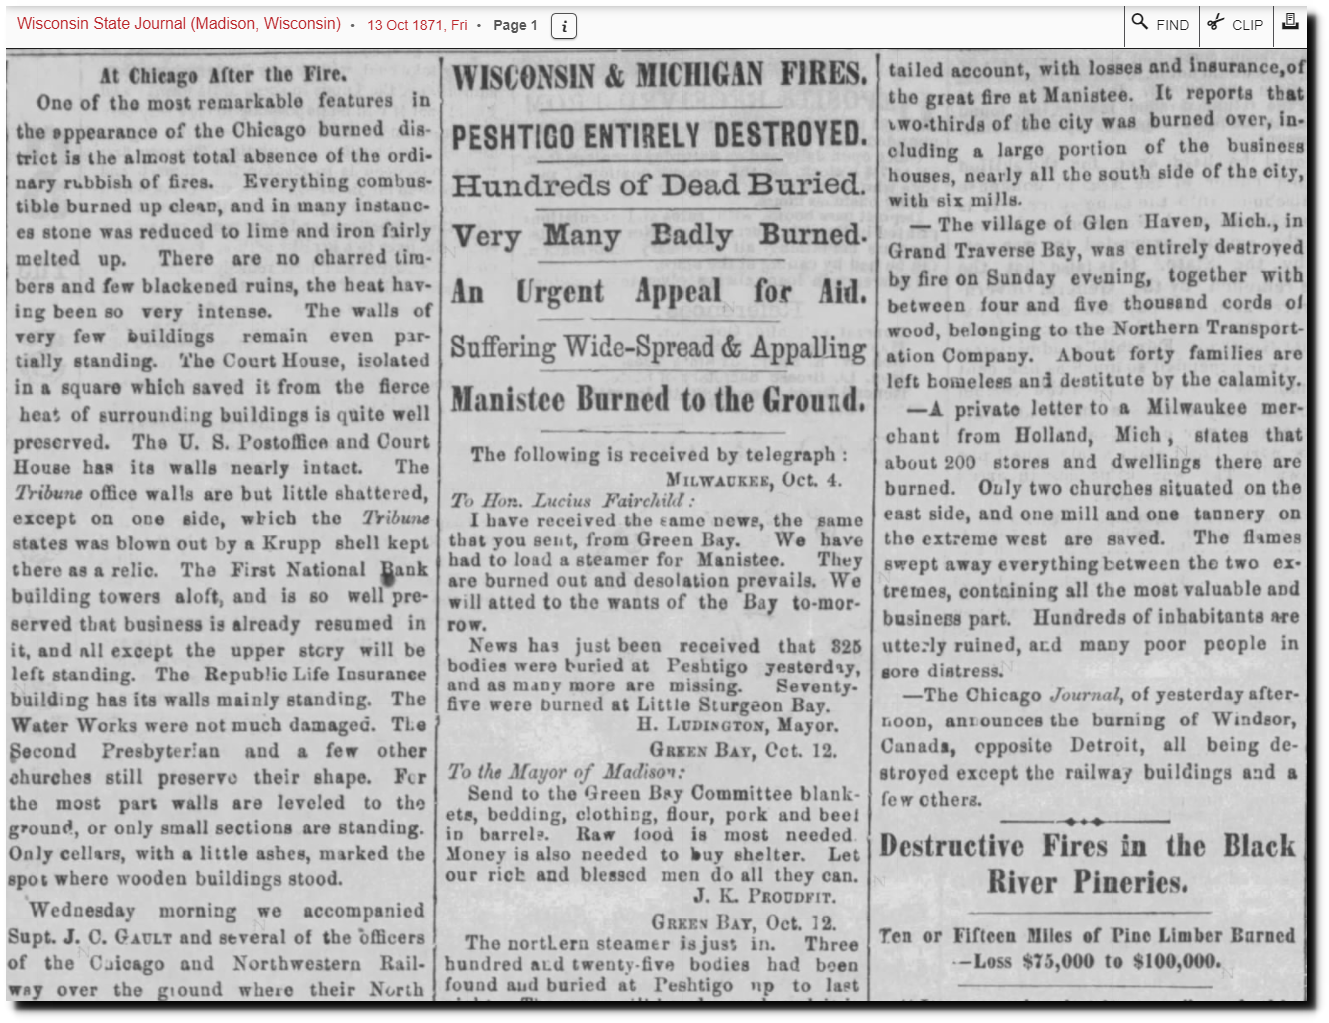
13 Oct 1871, 1 – Wisconsin State Journal at Newspapers.com
The current version of history is that the people of Peshtigo had no warning, and this has led to speculation the fires were caused by a meteor or comet. 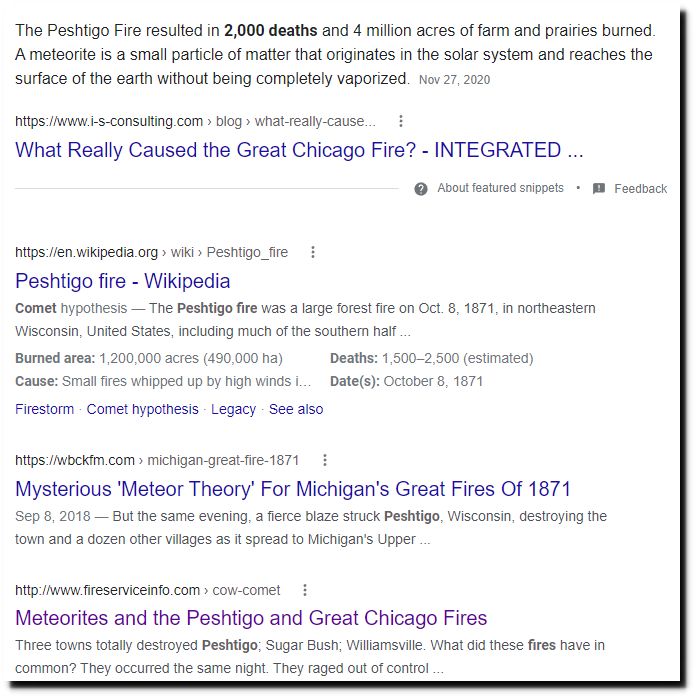
But the reality is – people in Peshtigo knew they were going to be driven from town six days earlier.
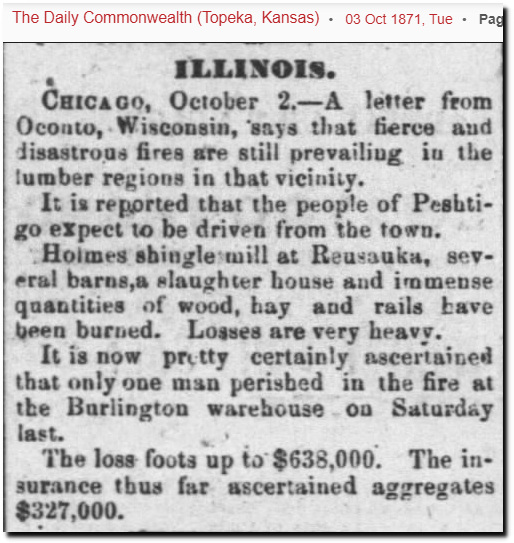
03 Oct 1871, 1 – The Daily Commonwealth at Newspapers.com
Here is what really happened.
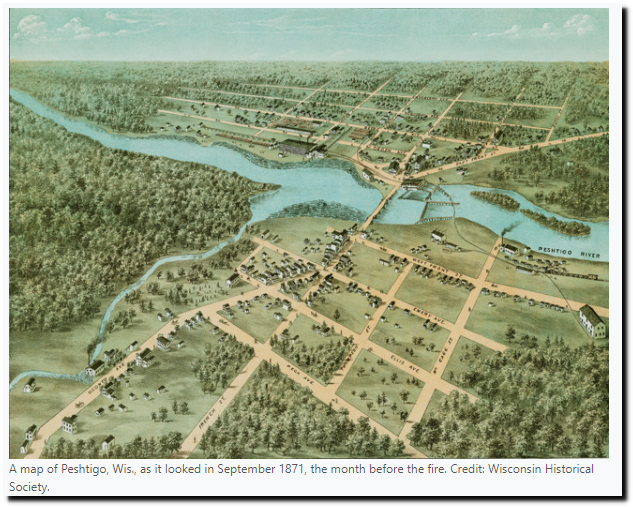
From 1870 to 1871, the Midwest was engulfed in drought. Peshtigo and the surrounding area, which normally gets a meter or two of snow, got almost none that winter. The spring and summer also brought lighter than normal precipitation. Historical records mark the date of the last soaking rain before the fire as July 8, leaving the slash to bake in the dry air for another three months through summer and early fall.
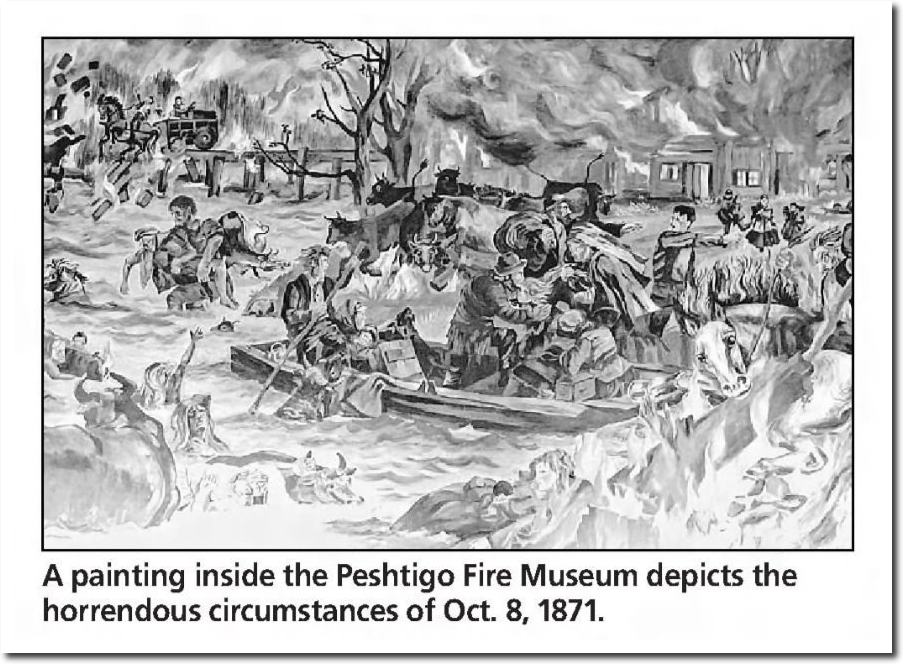
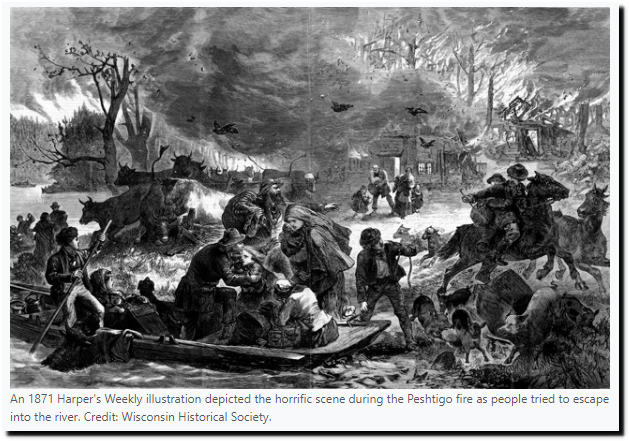
In early October, a cyclonic weather front formed over the Great Plains, creating westerly winds that headed toward Peshtigo. When the storm hit the Northwoods on Oct. 8, a huge temperature difference created strong winds, kicking up coals and fanning the smaller fires, which merged into one enormous fire. A wall of flame nearly 5 kilometers wide and almost a kilometer high roared through the town and quickly spread, according to survivor accounts.
Based on the vitrification of sand, the fire was estimated to have reached more than 1,000 degrees Celsius. It burned so intensely that it created its own weather system, with winds whipping the fire into a tornado-like column of fire and cinders. Authors Gess and Lutz reported that winds rushed through the town at more than 160 kilometers per hour. Escape routes were limited; outrunning the fire was impossible. Many survivors used the same phrase to describe the speed of the flames: “faster than it takes to write these words.”
The combination of conditions that caused the Peshtigo fire and others in the Midwest in October 1871 — normal land-clearing methods, extensive drought conditions and a particularly windy weather front — was not unique or even especially rare. Beginning in spring 2016, wildfires ripped through the Fort McMurray area in Alberta, Canada, burning more than 600,000 hectares. “There was a mild winter and not a lot of meltwater from the mountain snowpack,” said Mike Wotton, a research scientist with the Canadian Forest Service, quoted in a 2016 CBC article. “Then there was an early, hot spring, and everything got very dry. Then on top of that, it got windy,” Wotton said.
“This really shows that once a fire like this is up and running, the only things that are going to stop it [are] if the weather changes or if it runs out of fuel to burn up,” said Mike Flannigan, professor of wildland fire science at the University of Alberta in Edmonton, in the same article. “With a fire like this, it’s burning so hot that air drops [of water by firefighters] are like spitting on a campfire.”
Posted in Uncategorized
Leave a comment
Vaccinations In India Had No Effect
The “delta variant” curve in India had already passed before they reached 20% vaccinations.
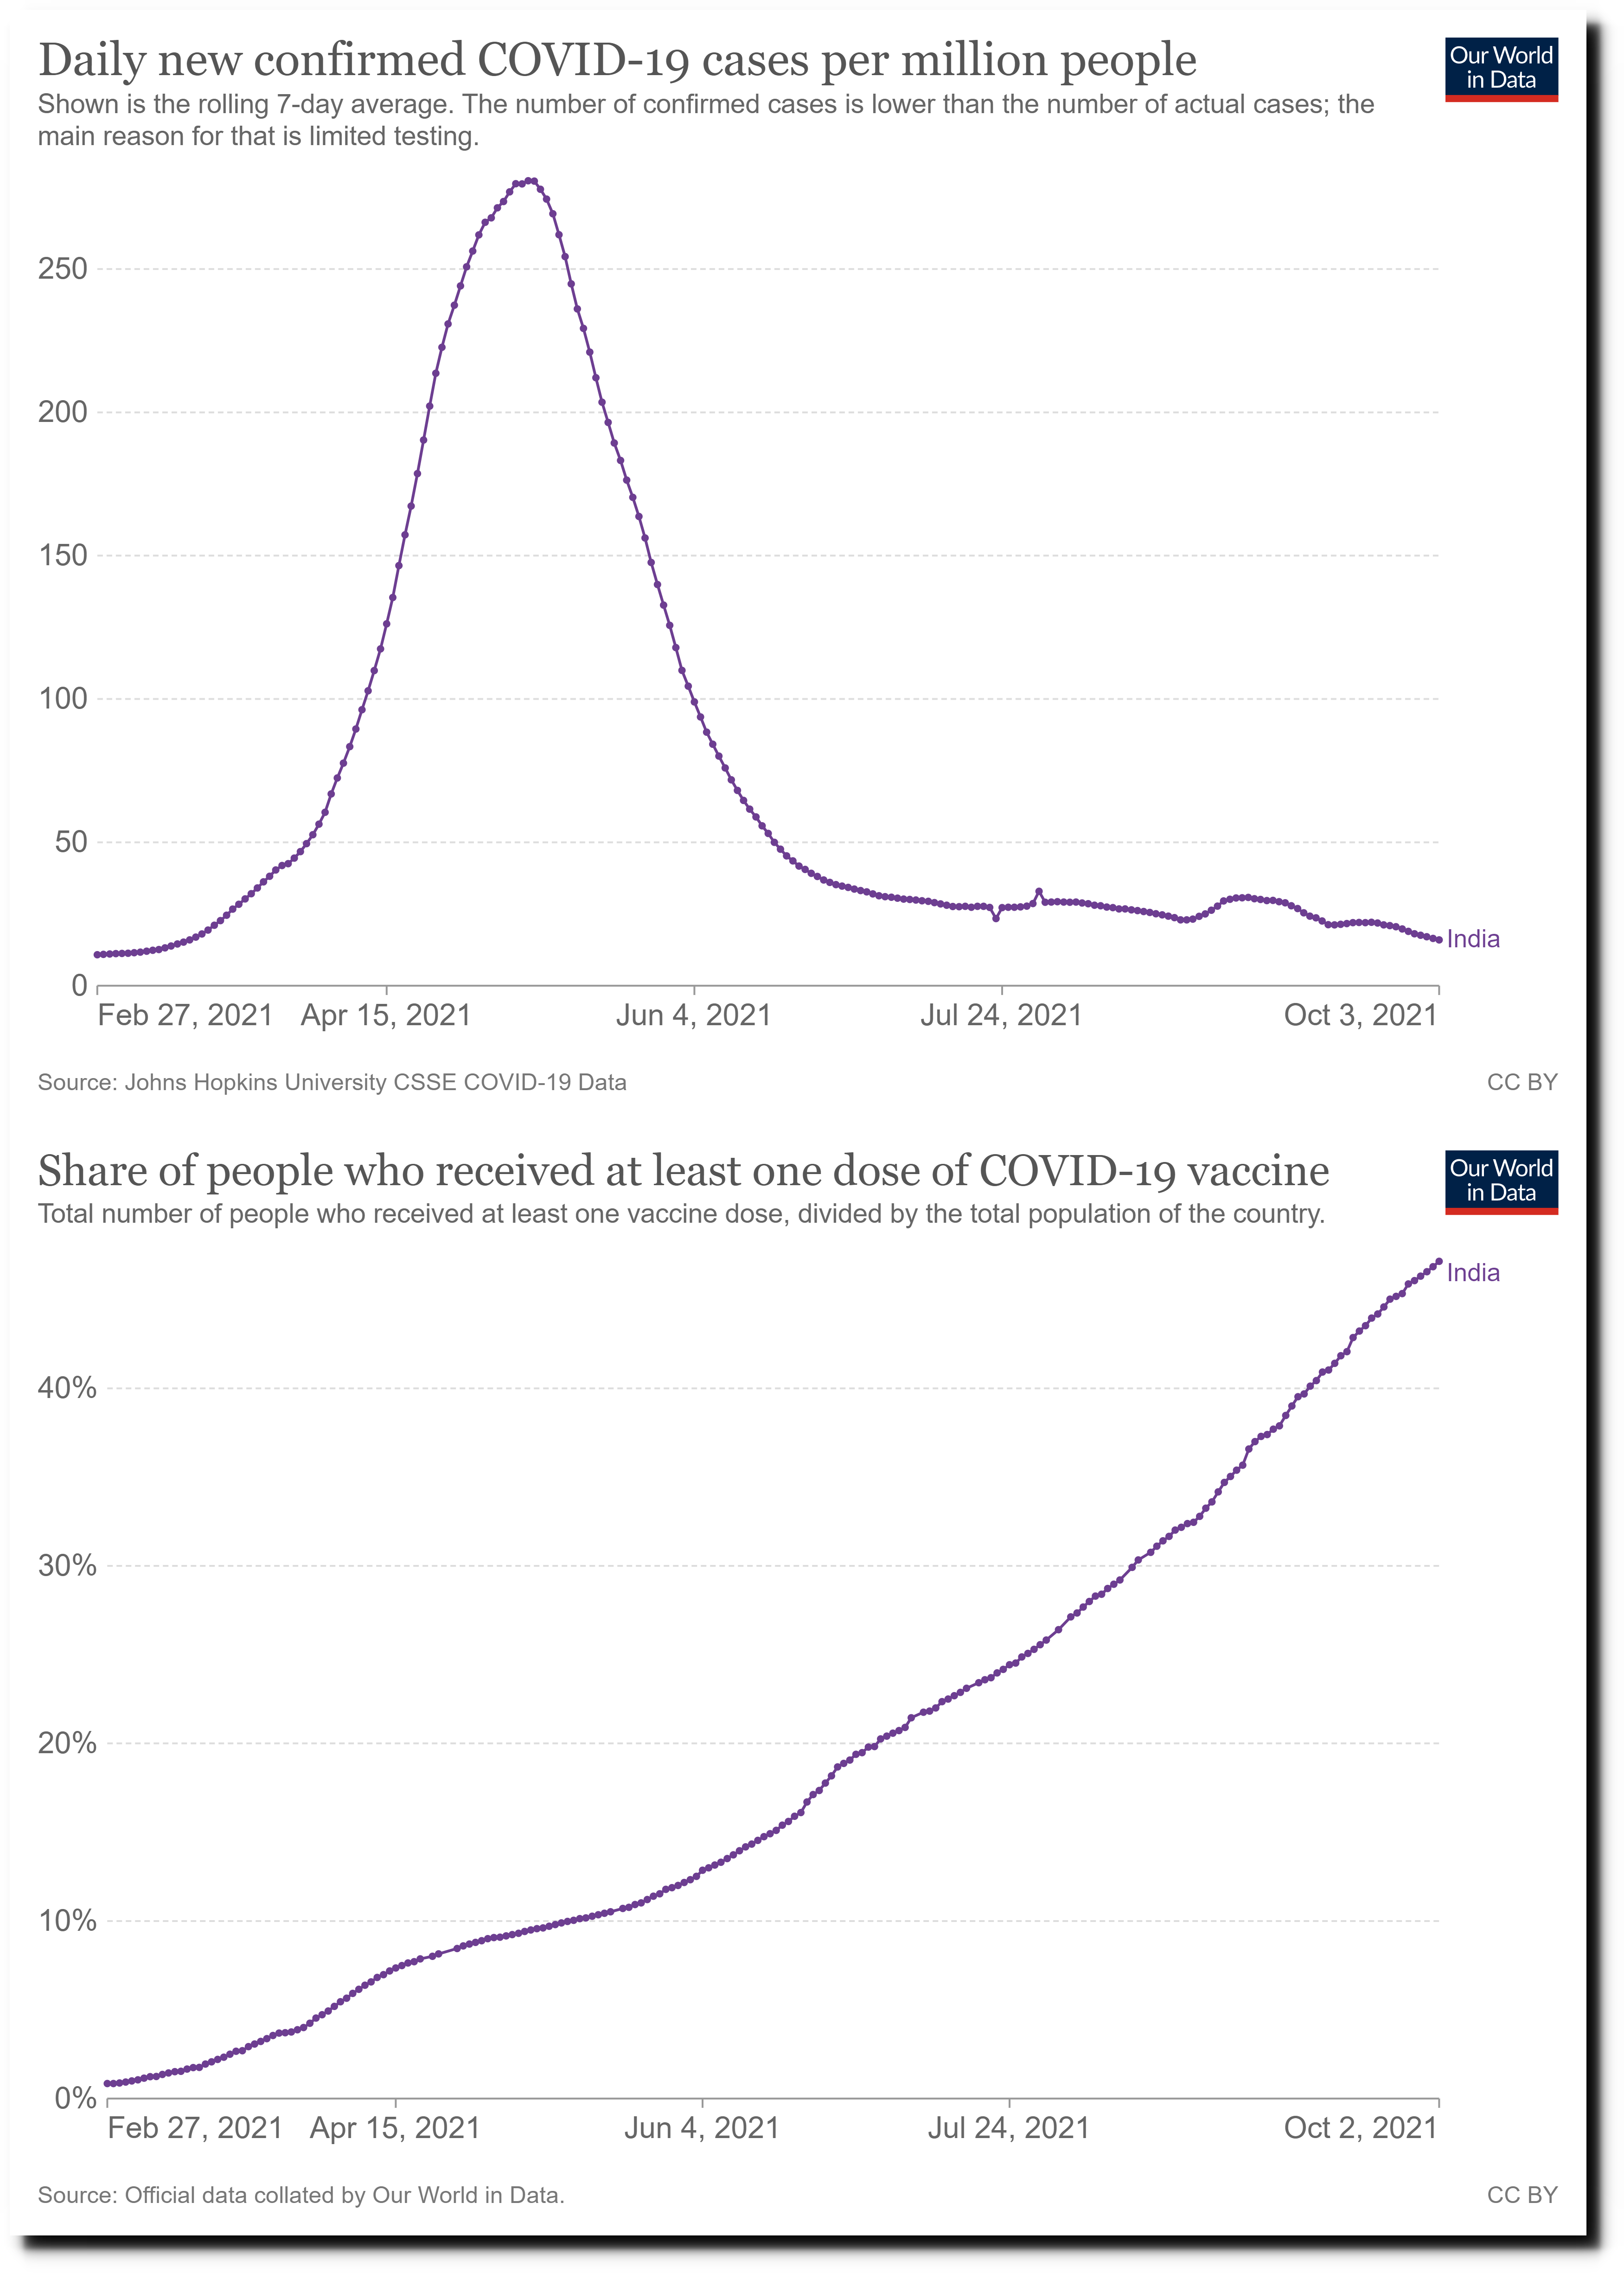
COVID-19 Data Explorer – Our World in Data
But Israel believes they need 100% of people injected at least three times.

Posted in Uncategorized
Leave a comment
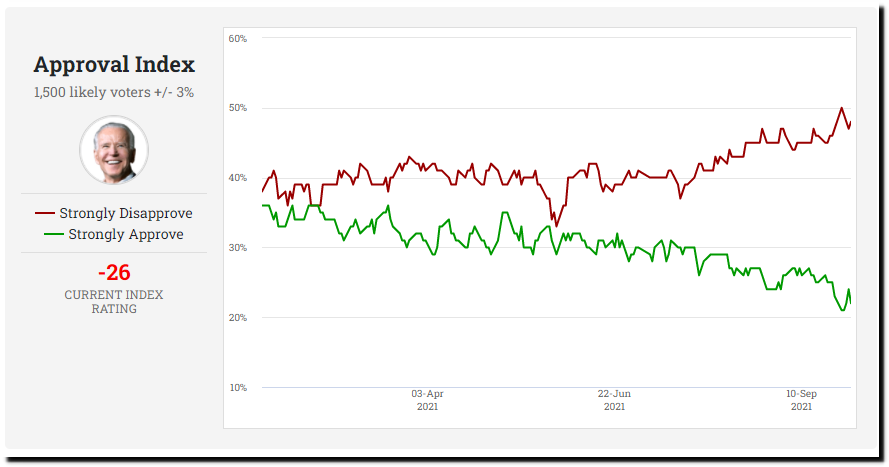
Shocking Opinion Poll
I was shocked to learn there still a few people supporting Joe Biden.
Posted in Uncategorized
Leave a comment
“Deadliest Pandemic In History” “More Younger People Than Before”
The New York Times reports :
“Nearly 700,000 people in the U.S. have now died of Covid-19 — making this the deadliest pandemic in American history. A majority who died recently were in the South and unvaccinated. Many of the victims were also younger than before.“
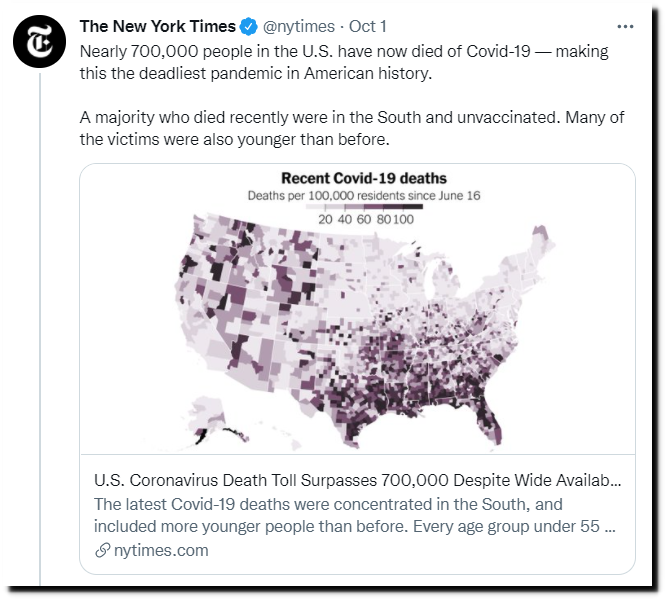
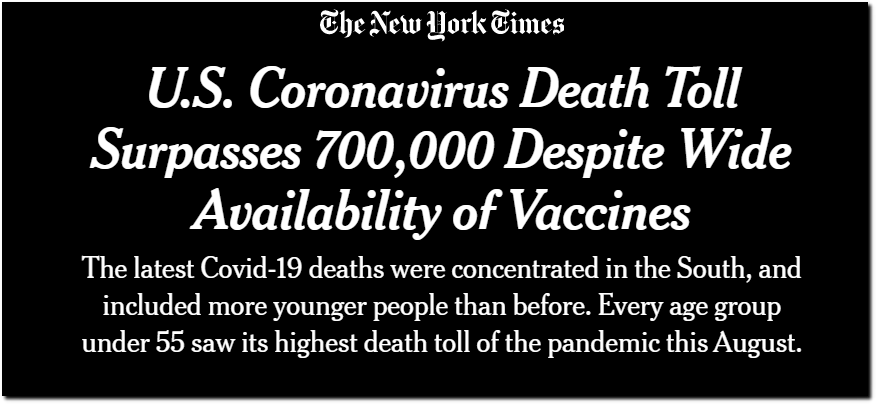
U.S. Covid Death Toll Nears 700,000 Despite Availability of Vaccines – The New York Times
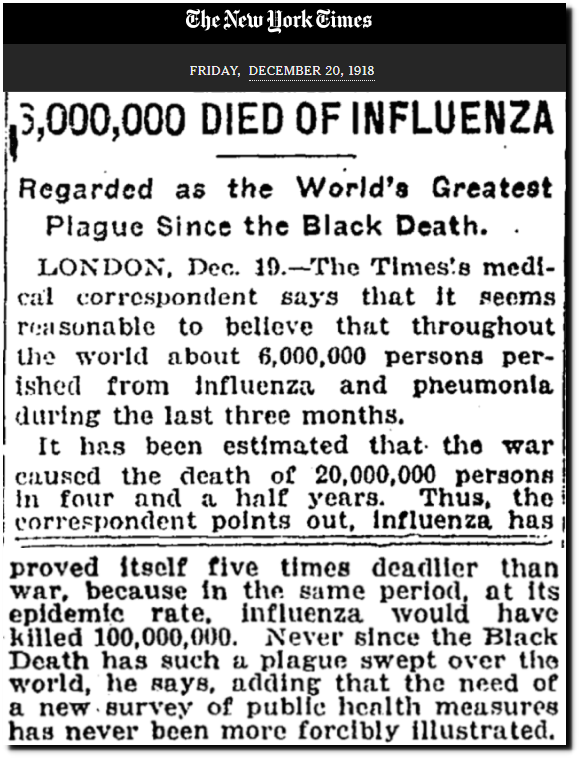
According to the CDC, at least 50 million people died in the 1918-1919 pandemic, which is an average death rate more than twenty times higher than COVID-19.
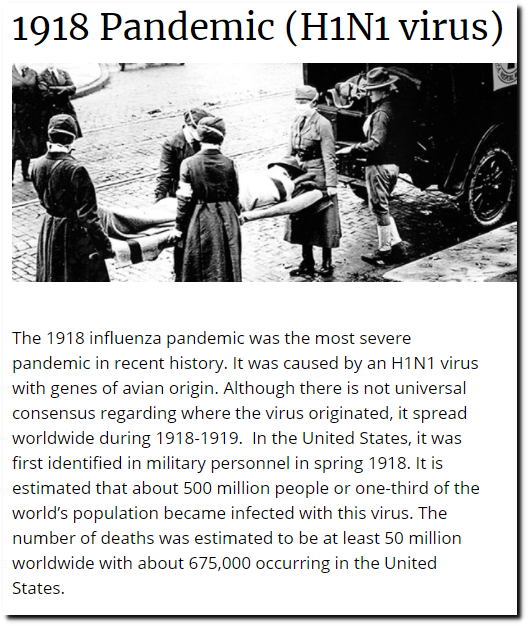
1918 Pandemic (H1N1 virus) | Pandemic Influenza (Flu) | CDC
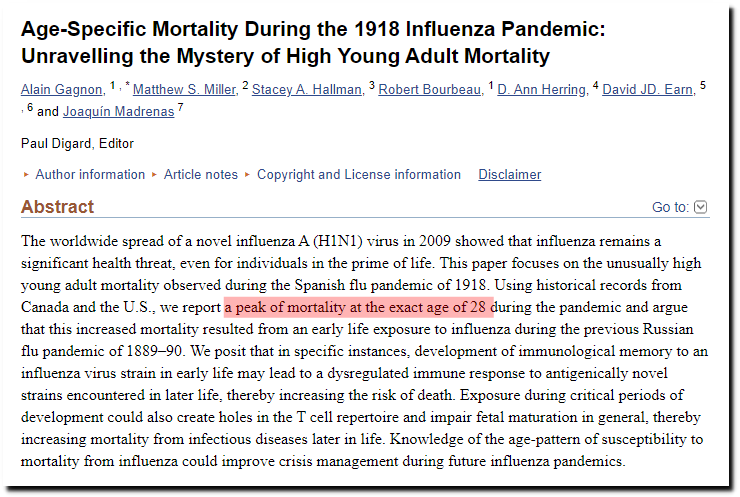
The 1918-1919 pandemic had a peak mortality of age 28.
Fewer than four thousand people under age 30 have died from COVID-19 in the US, compared to hundreds of thousands in 19181-1919 pandemic.
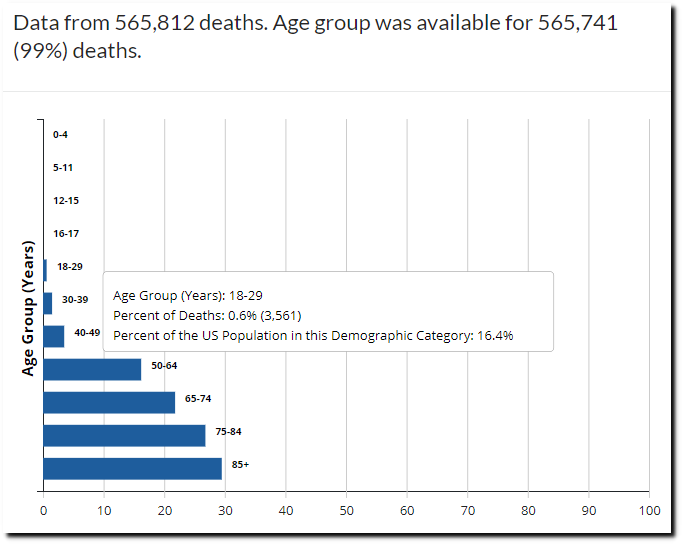
Death rates for older people are hundreds of times higher for COVID-19 than for 18 to 29 years old.
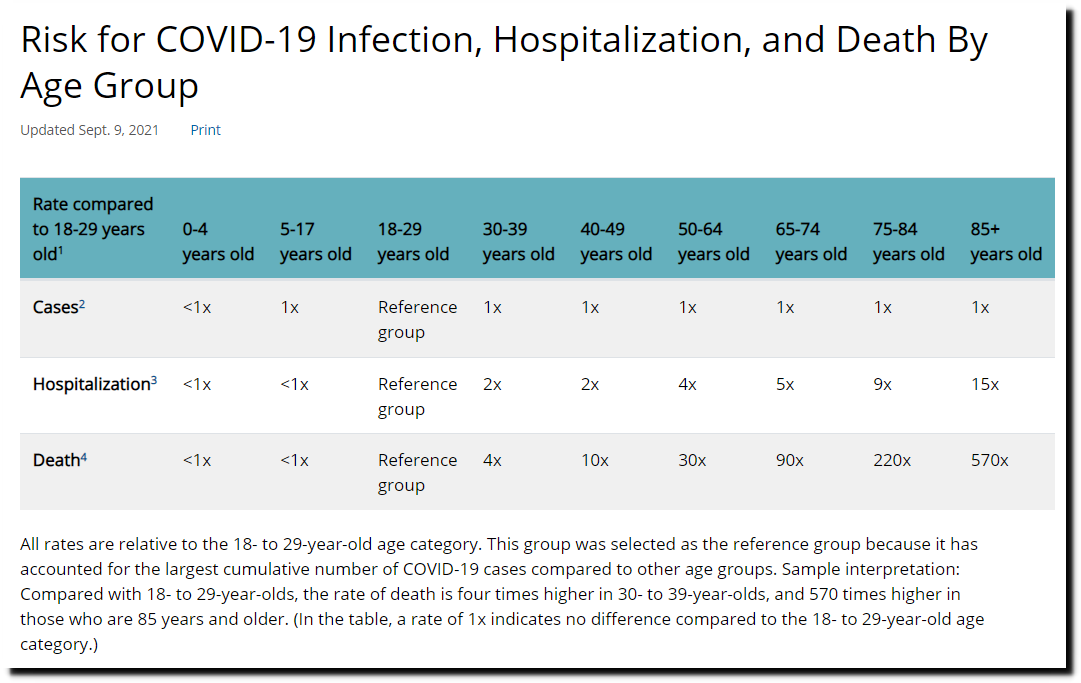
Risk for COVID-19 Infection, Hospitalization, and Death By Age Group | CDC
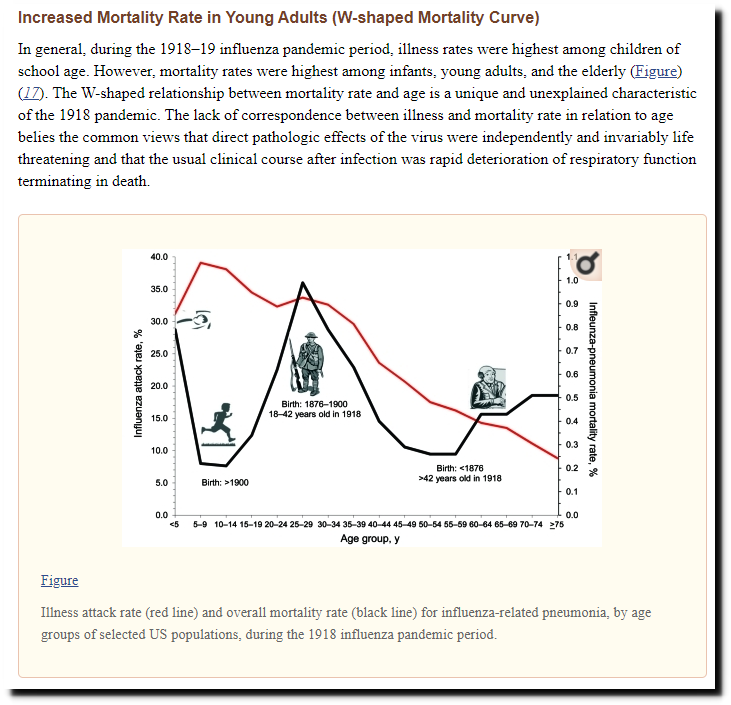
Pathogenic Responses among Young Adults during the 1918 Influenza Pandemic
The average age of death for COVID-19 is 79, the same as for all other causes. By contrast, the 1918-1919 pandemic shortened peoples lives by thirty or forty years.
Then the New York Times went on to show a death rate chart vs. vaccination rate “since June 16” which made it look like New Jersey, New York, Massachusetts and Rhode Island had low death rates,
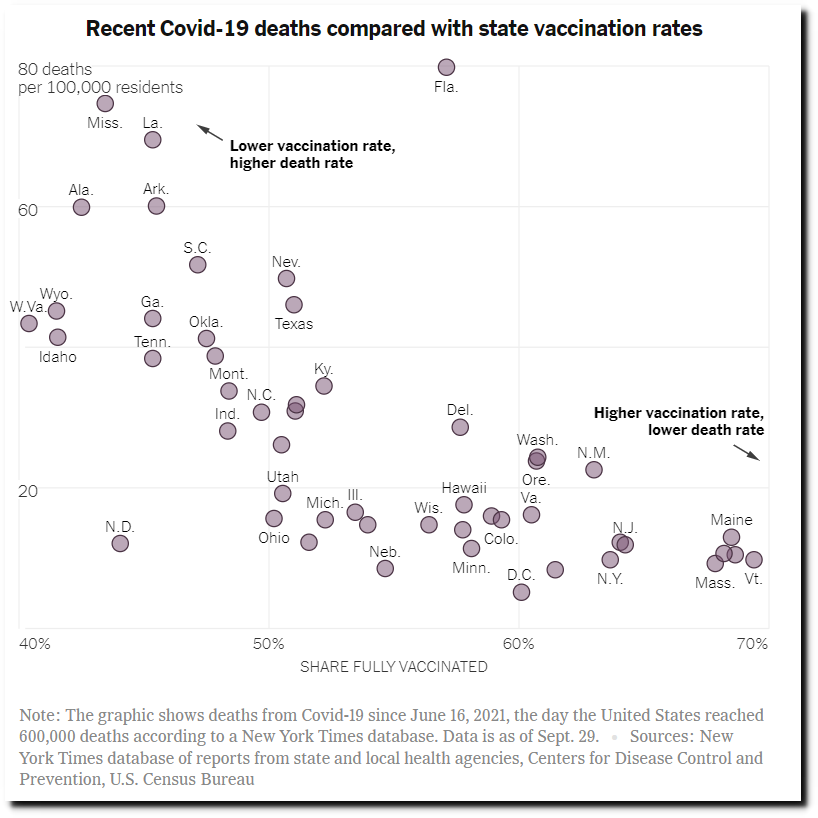
All four states are in the top ten.
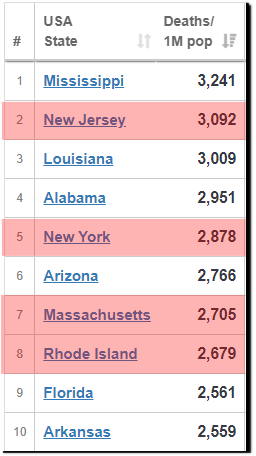
United States COVID: 44,490,897 Cases and 719,674 Deaths – Worldometer
So why did the New York Times pick a start date of June 16? The “delta” pandemic hit the south earlier than the Northeast. It peaked in the south six weeks ago, and is still on the upslope.
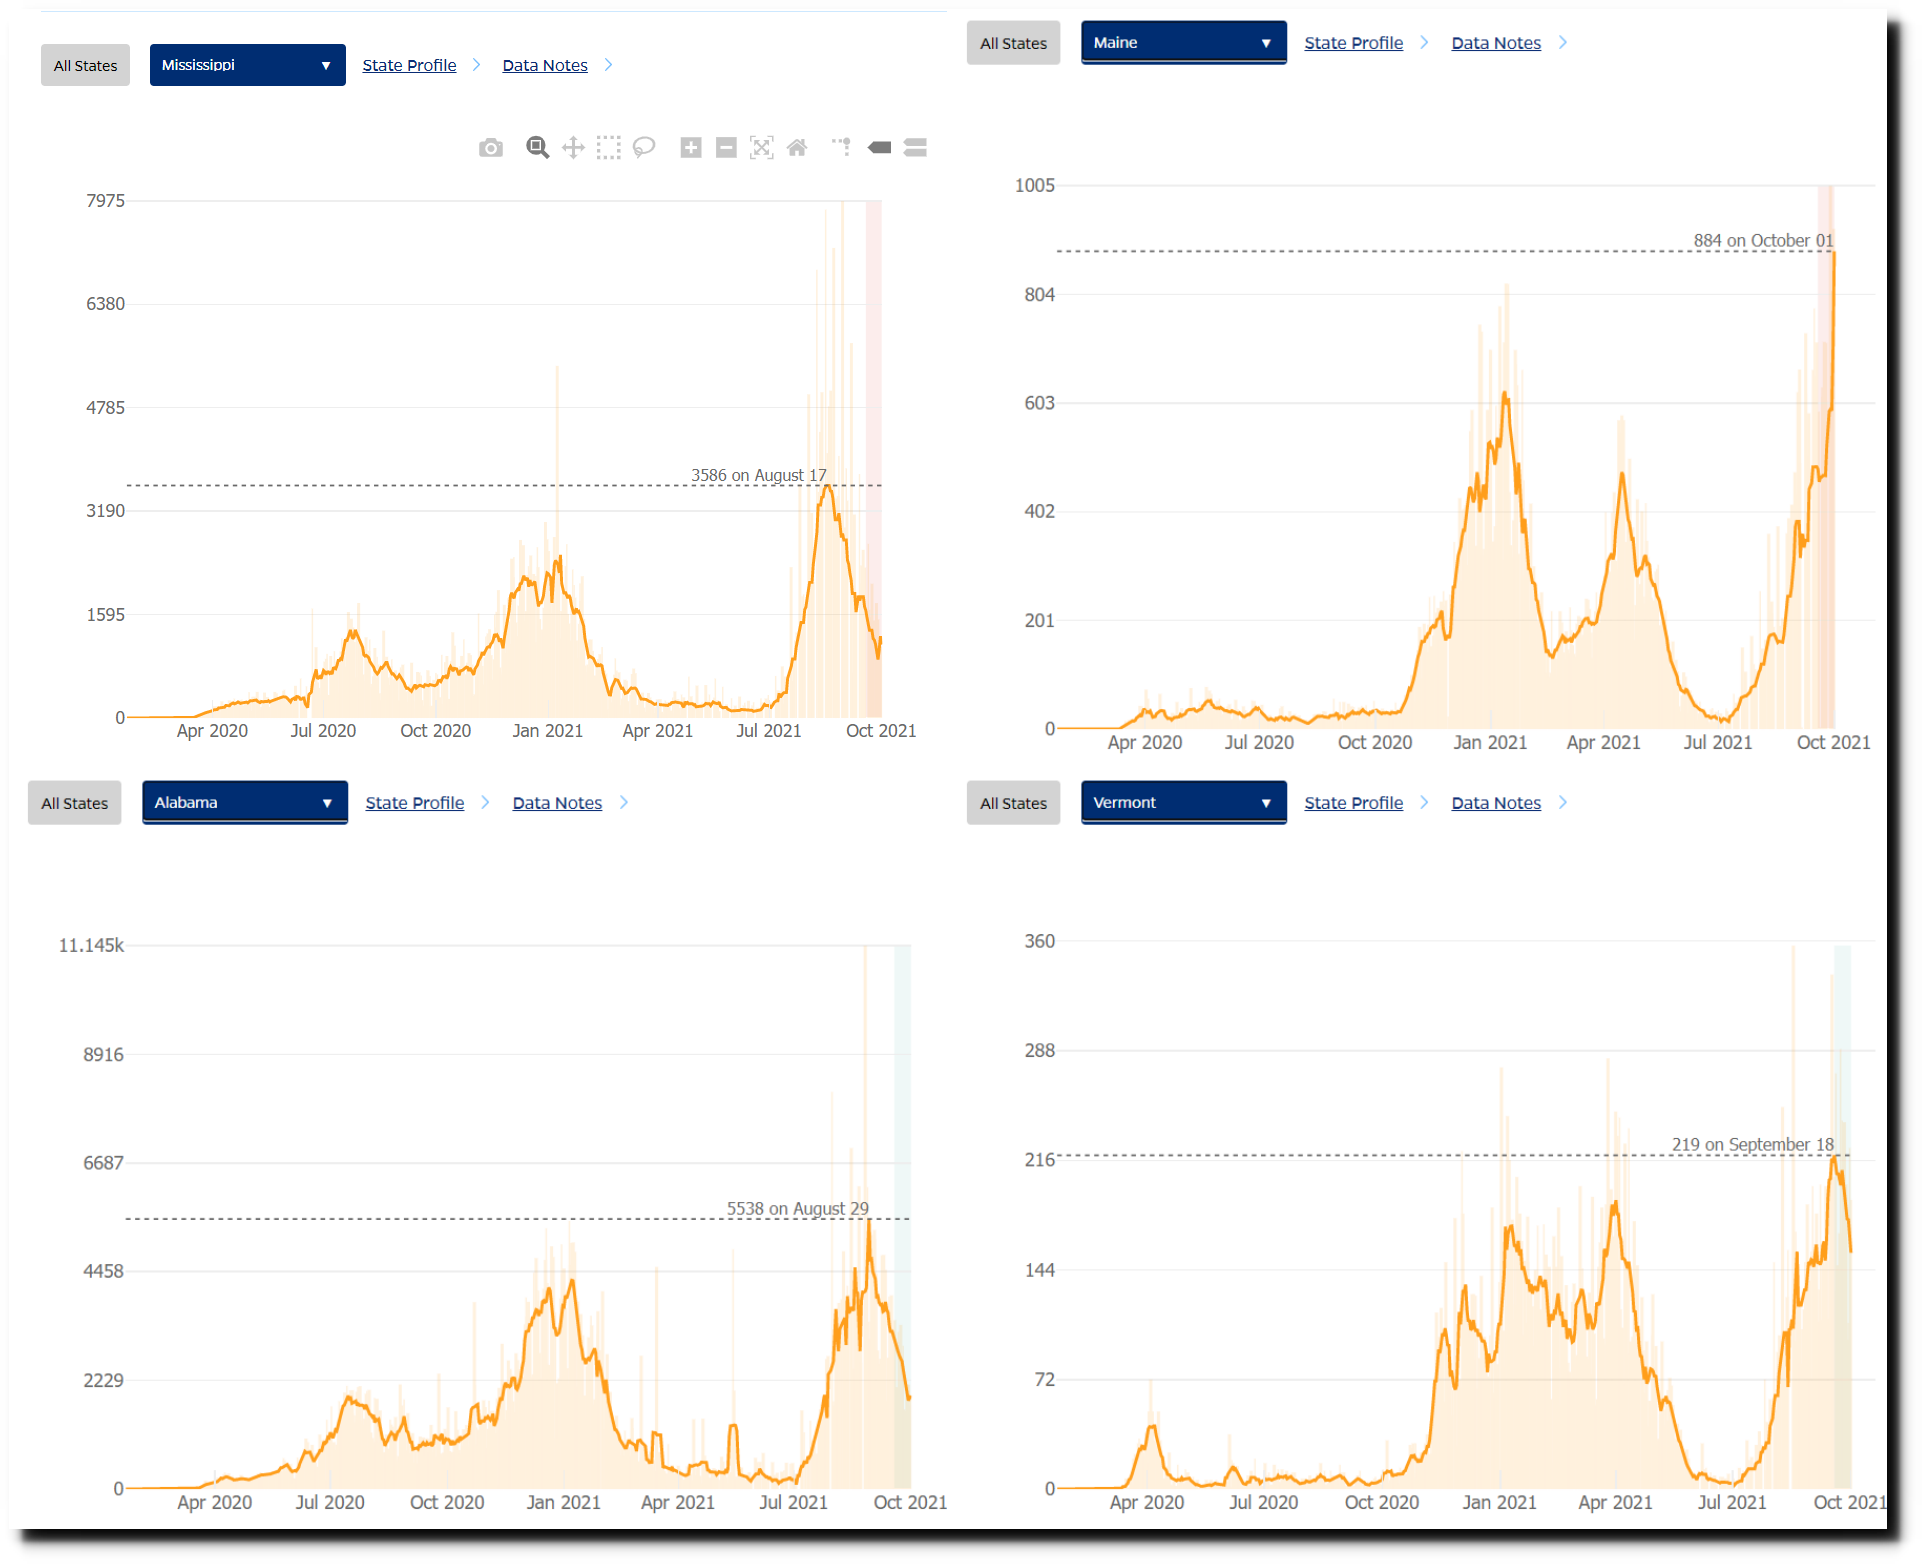
Have we flattened the curve in the US? – Johns Hopkins
Deaths in the northeast are increasing, and decreasing in the south.
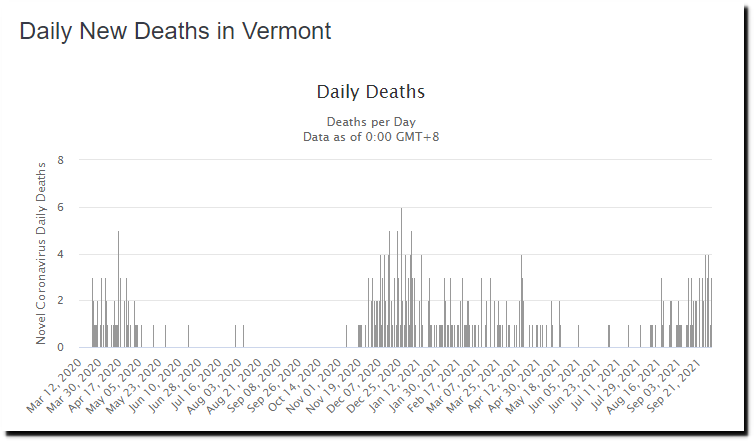
Vermont COVID: 34,081 Cases and 321 Deaths – Worldometer
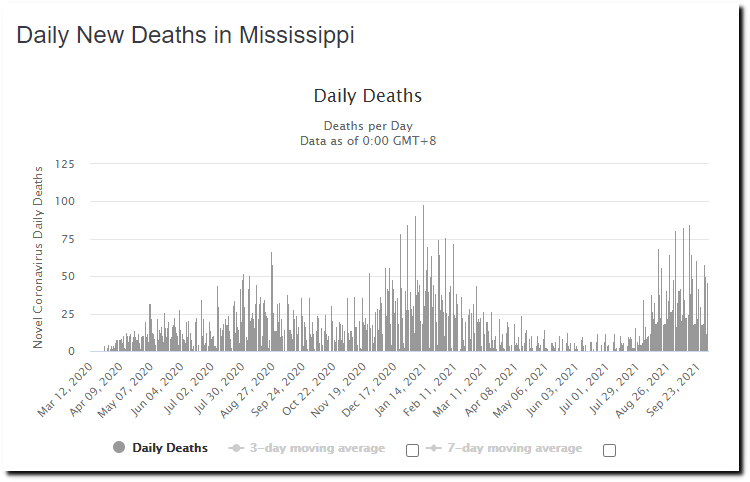
Mississippi COVID: 489,216 Cases and 9,646 Deaths – Worldometer
By cherry-picking the start date the New York Times is trying to make it look like vaccines work.
In 1918 they reported the flu was worse than the black death.
Posted in Uncategorized
Leave a comment