Smoking Gun Of Fraud And Collusion

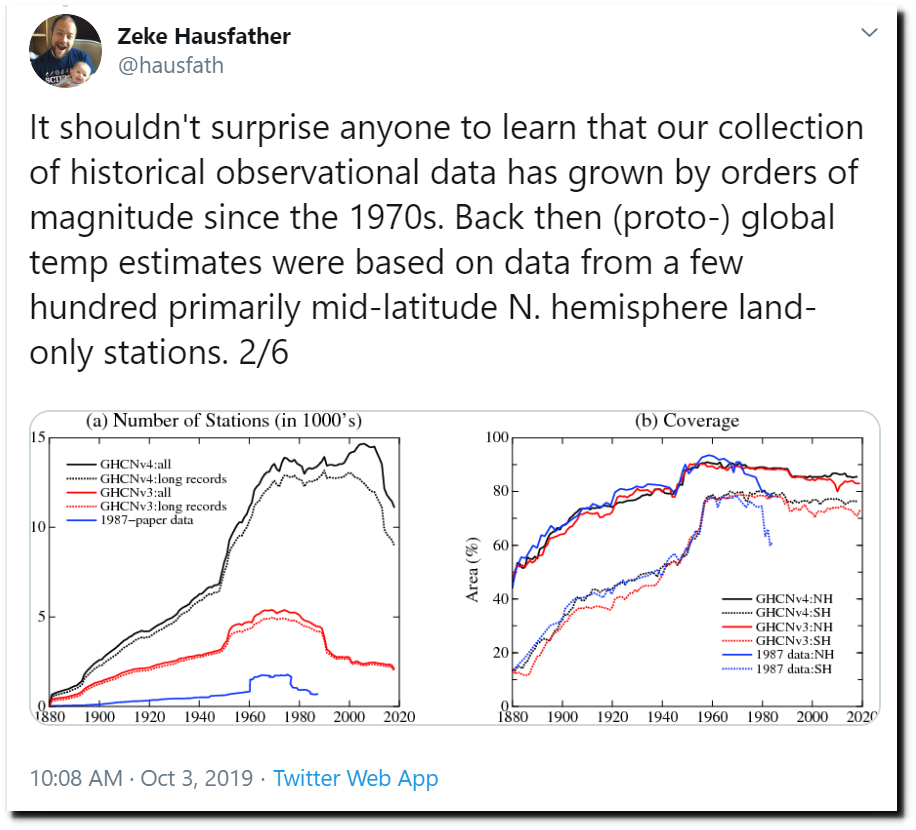
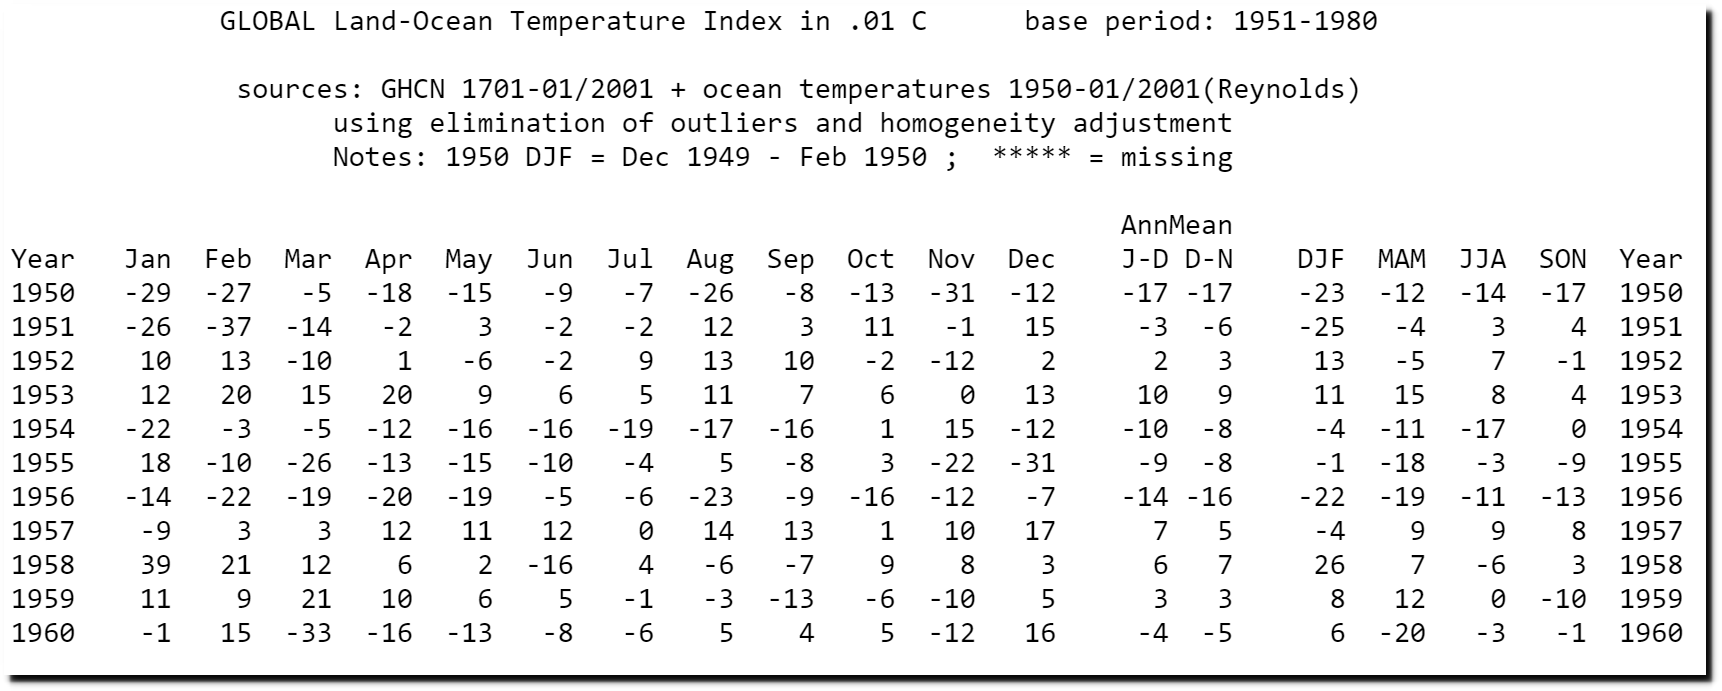
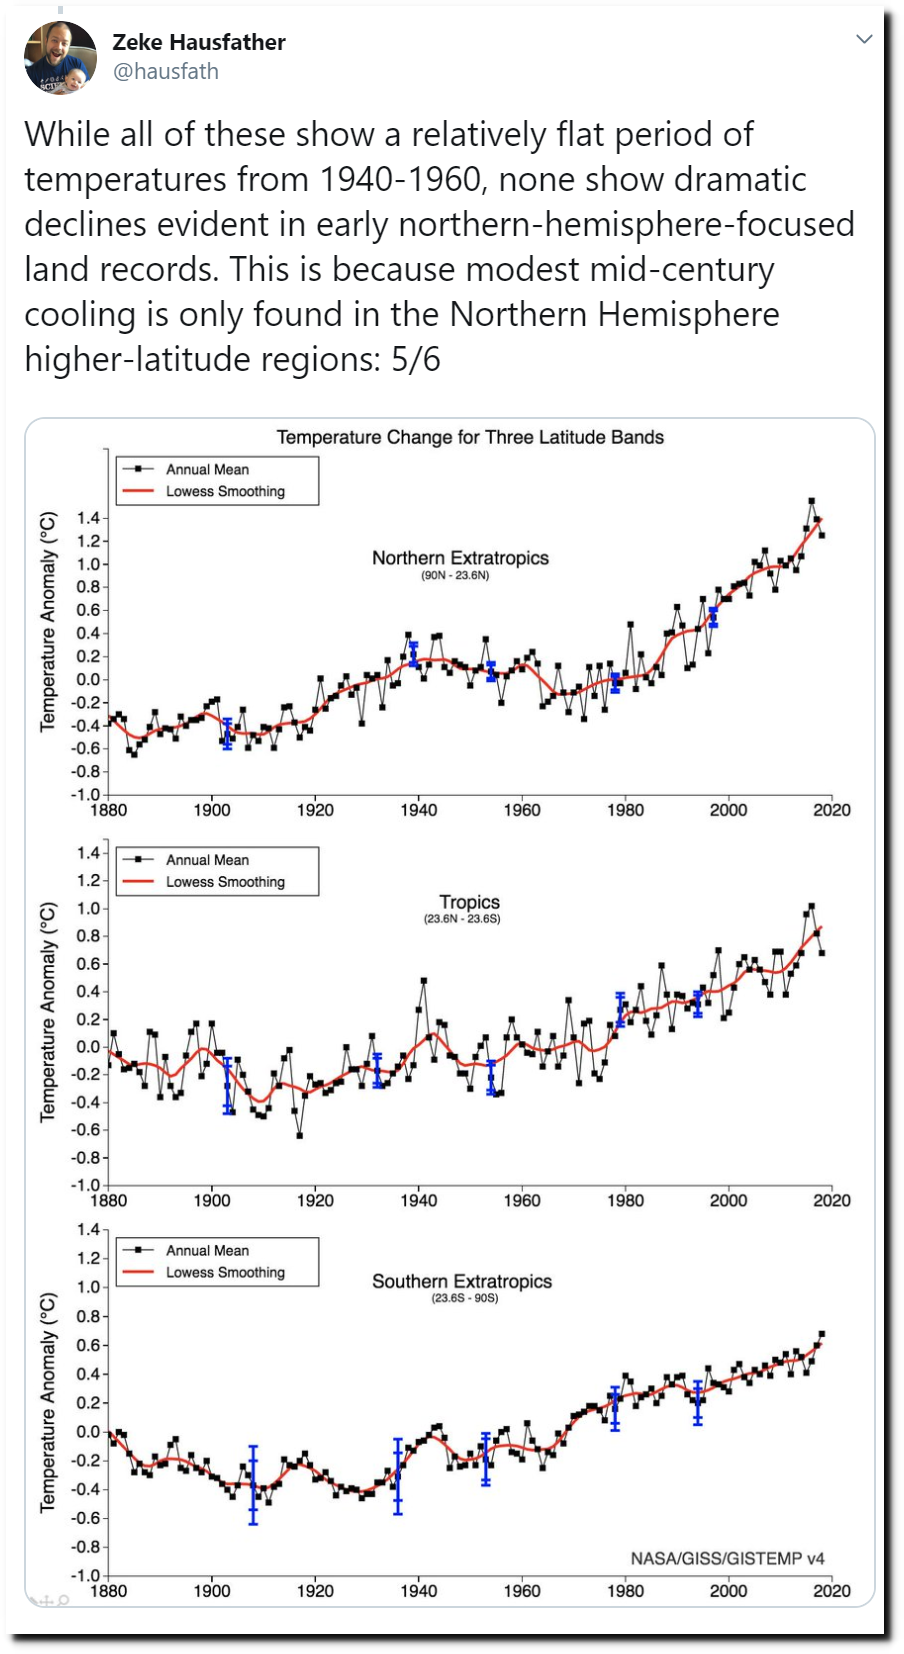
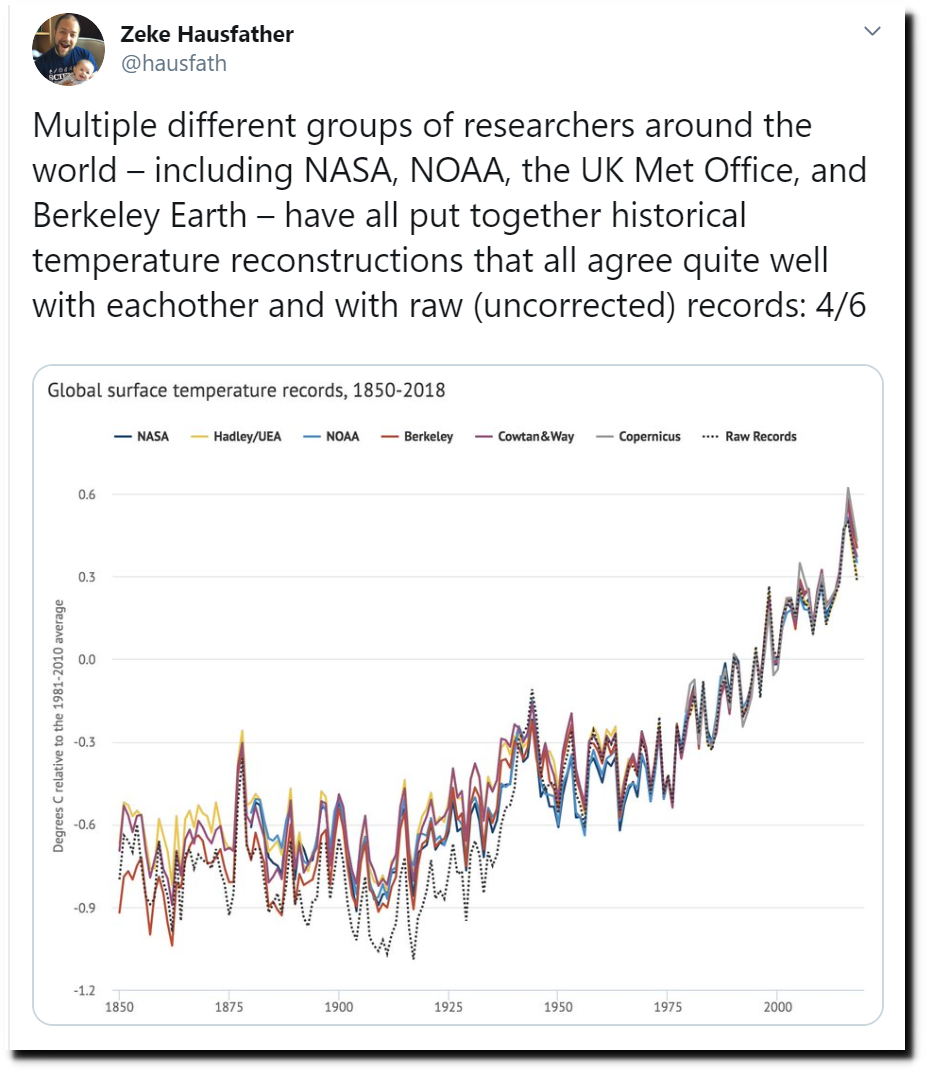
Zeke claims that there was no cooling in the Southern Hemisphere from 1940-1960, and he uses NASA temperature graphs as his evidence.

He also says every group of government researchers around the world agrees about this.

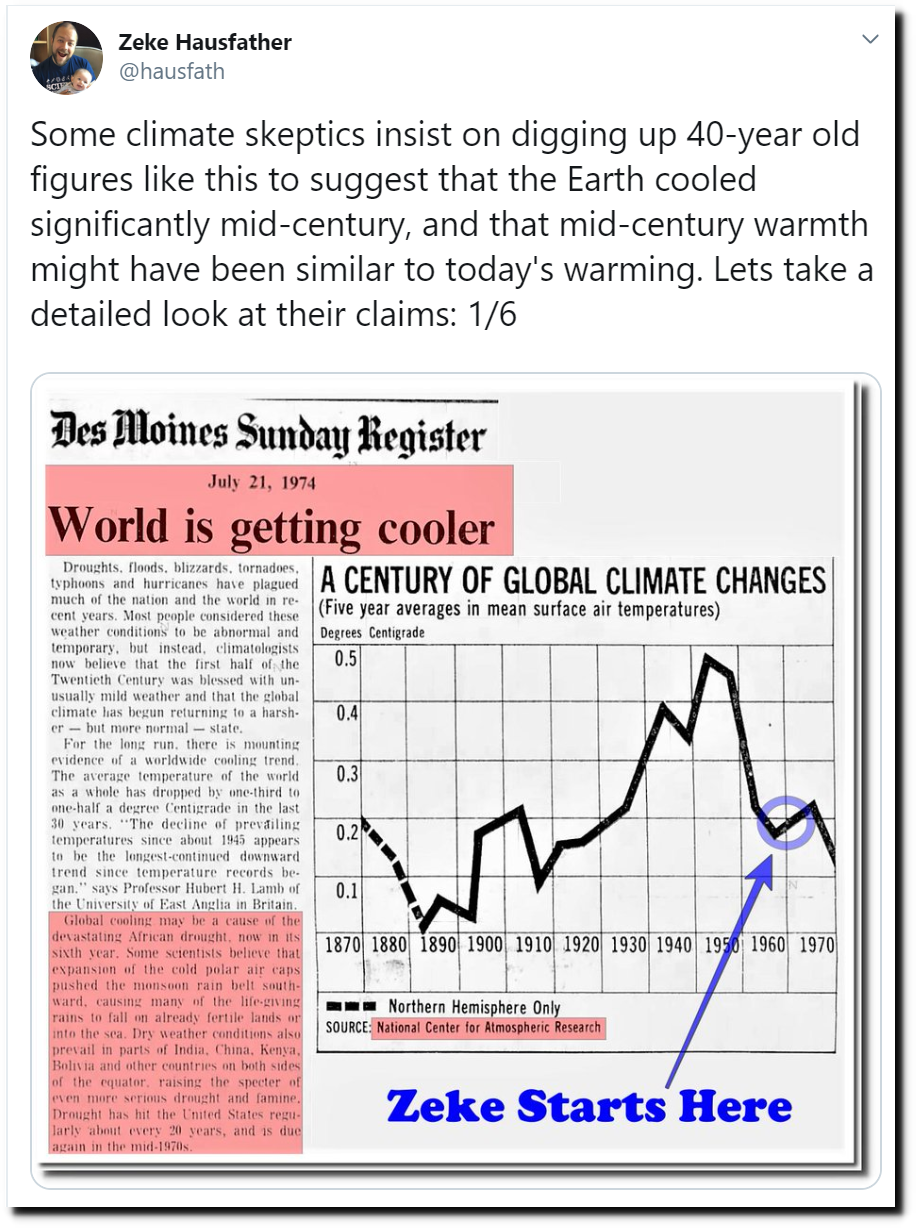
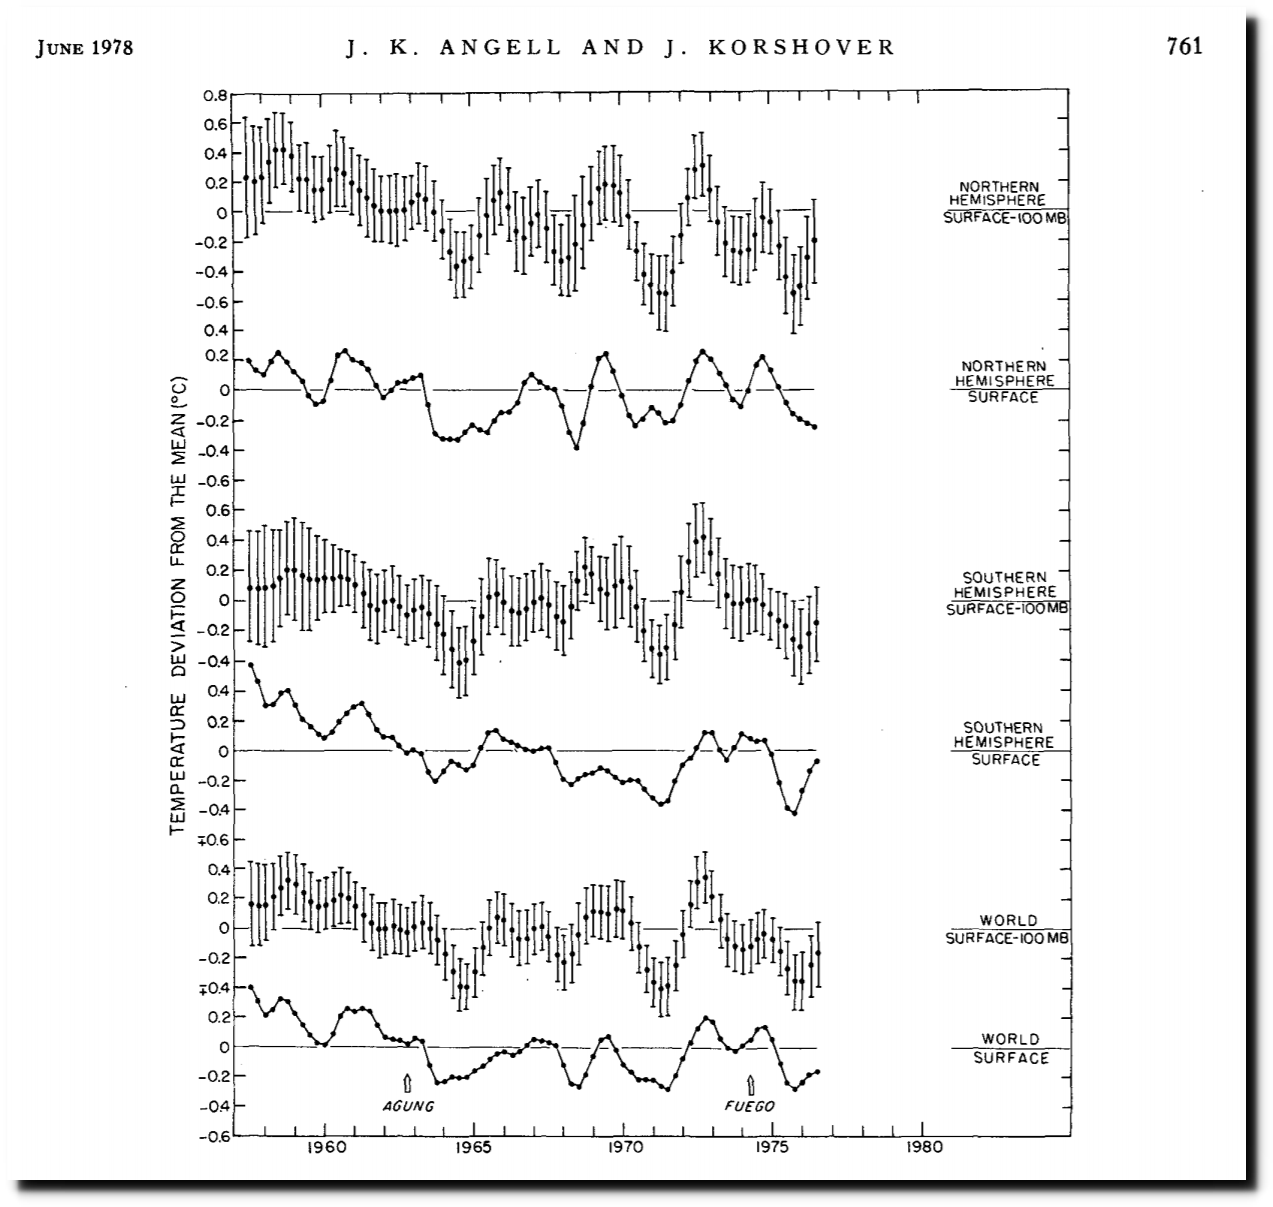
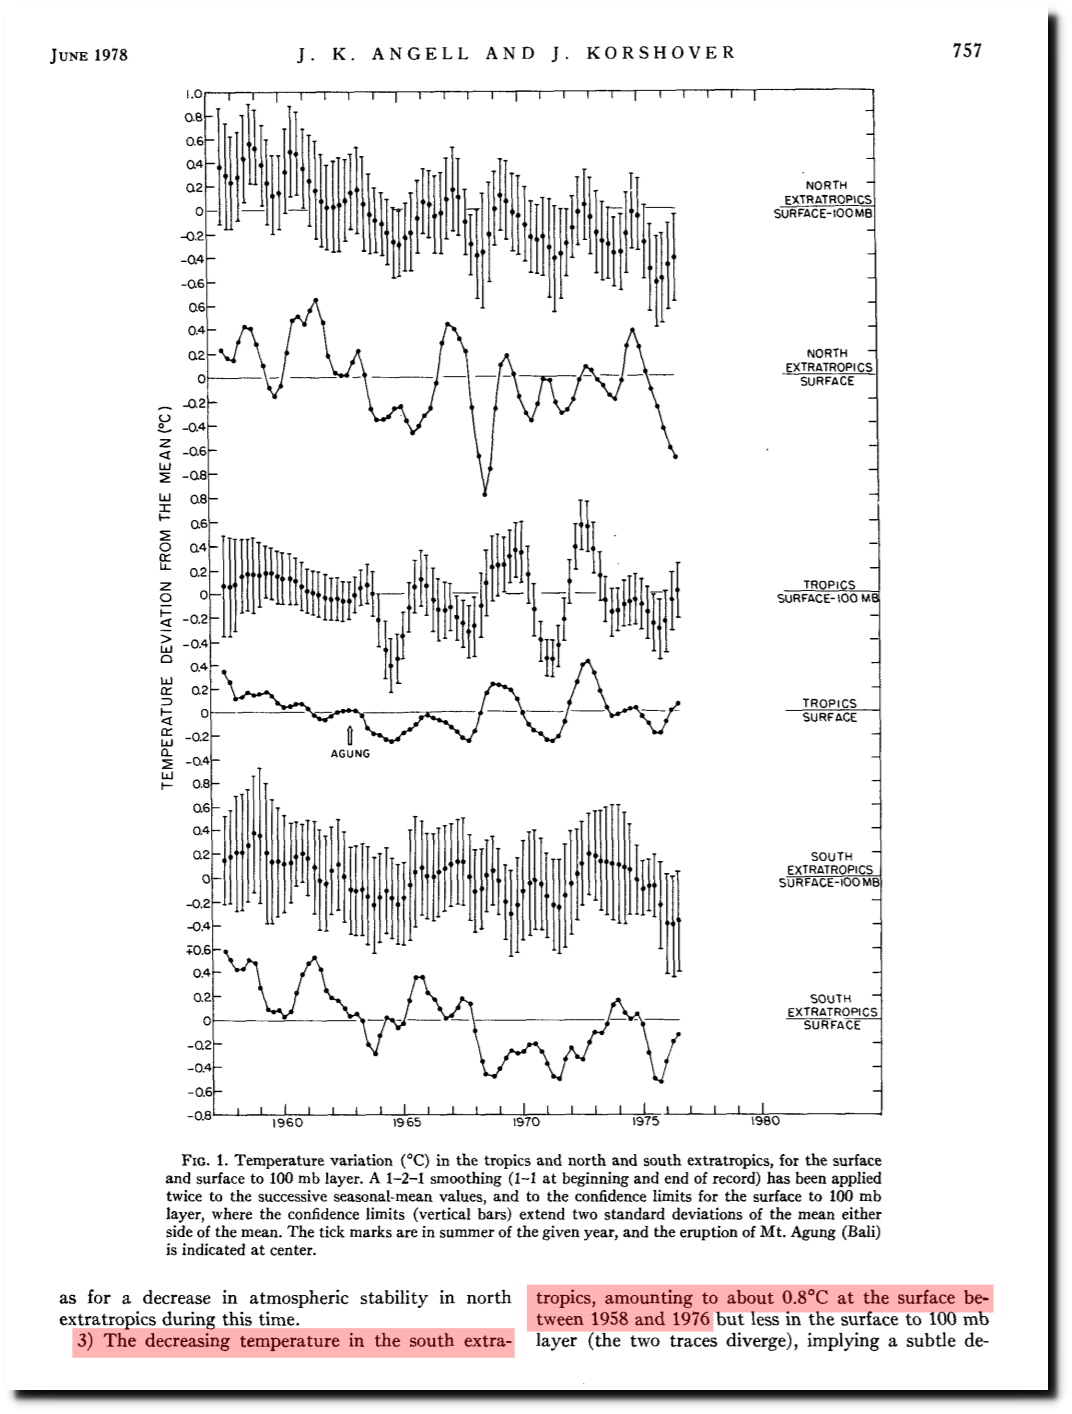
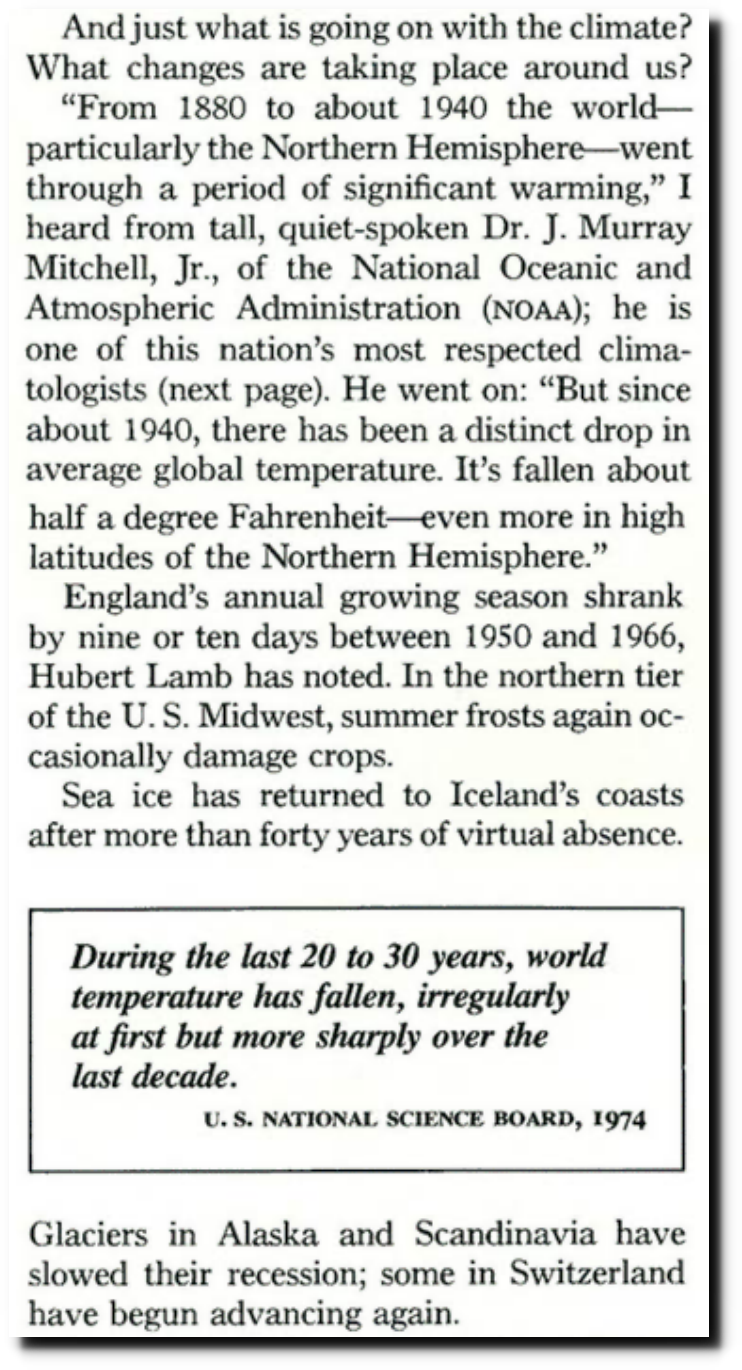
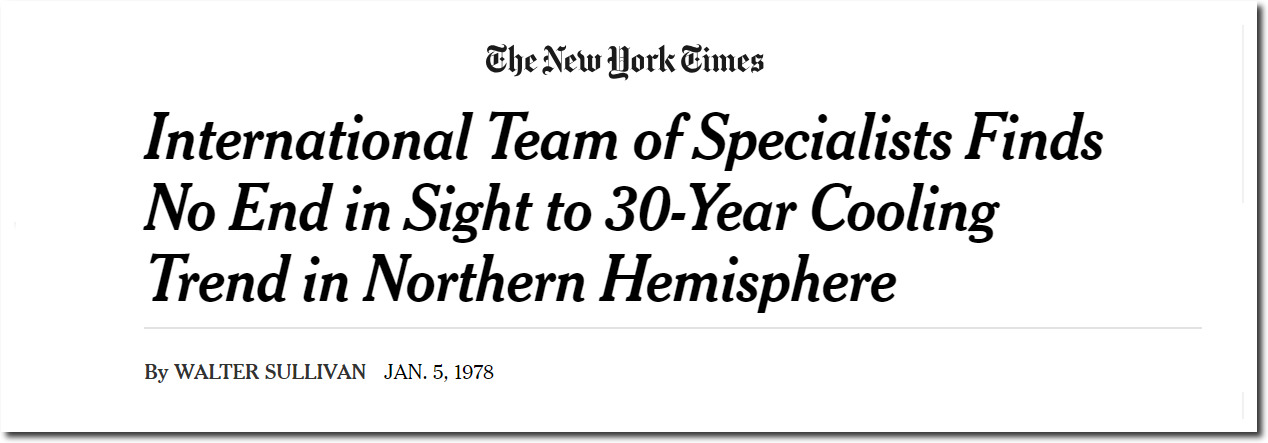
This is in direct contradiction to what NOAA said in 1978, when they showed peak surface cooling in the Southern Hemisphere

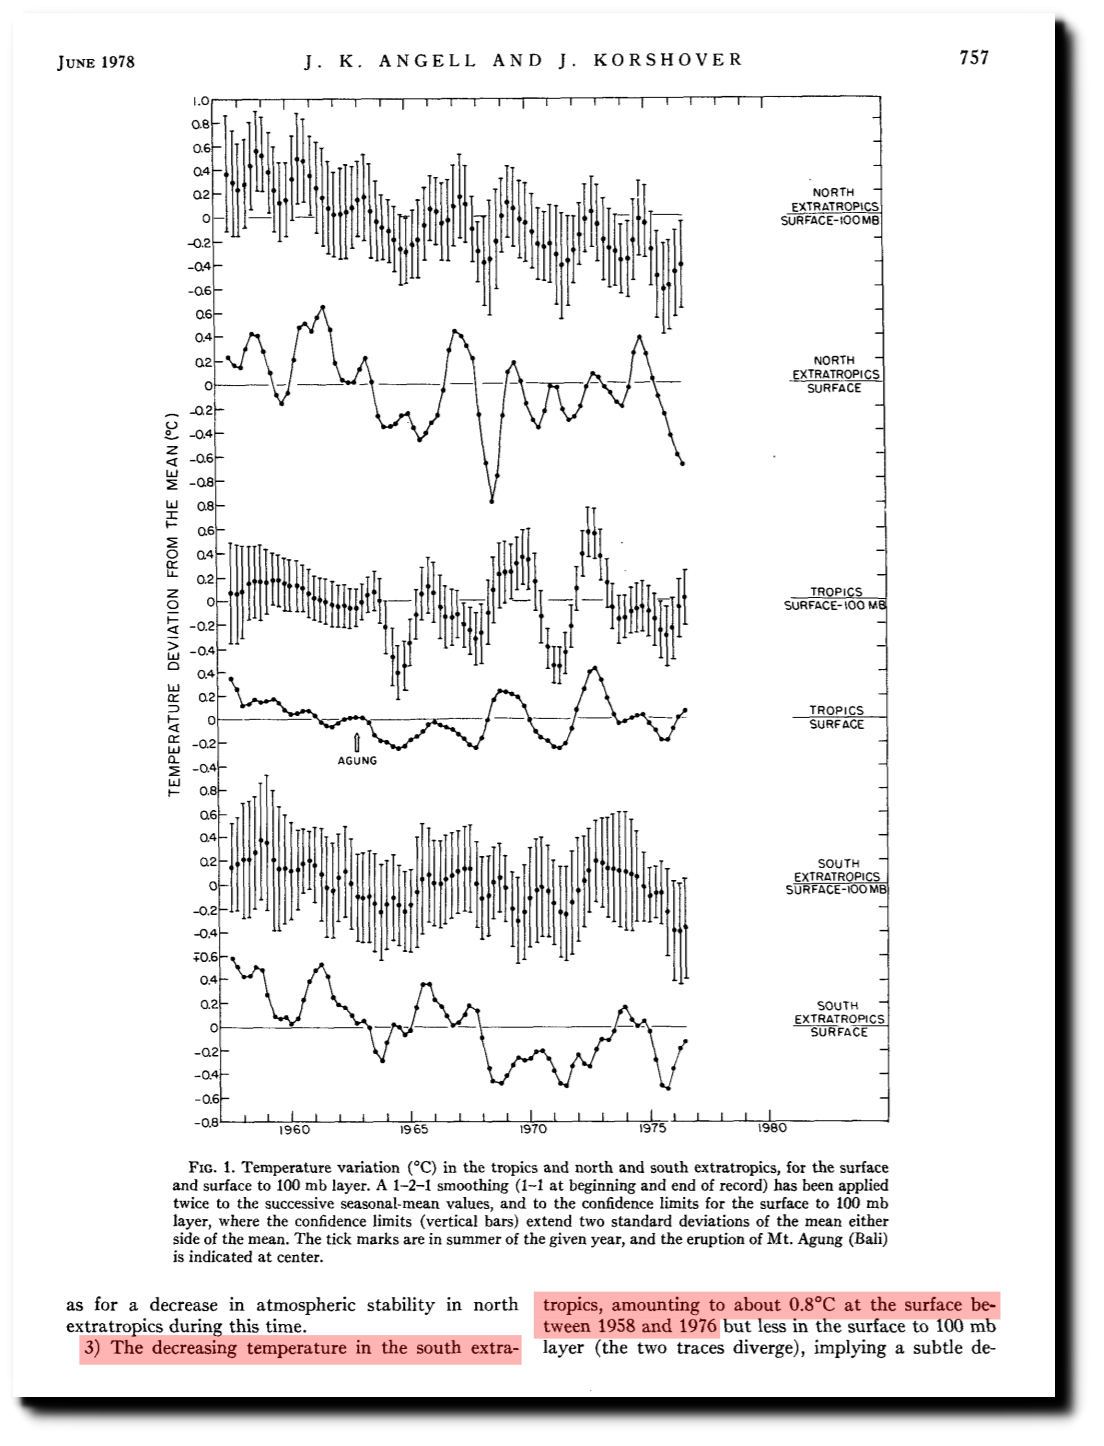
1520-0493(1978)106<0755:GTVSMA>2.0.CO;2

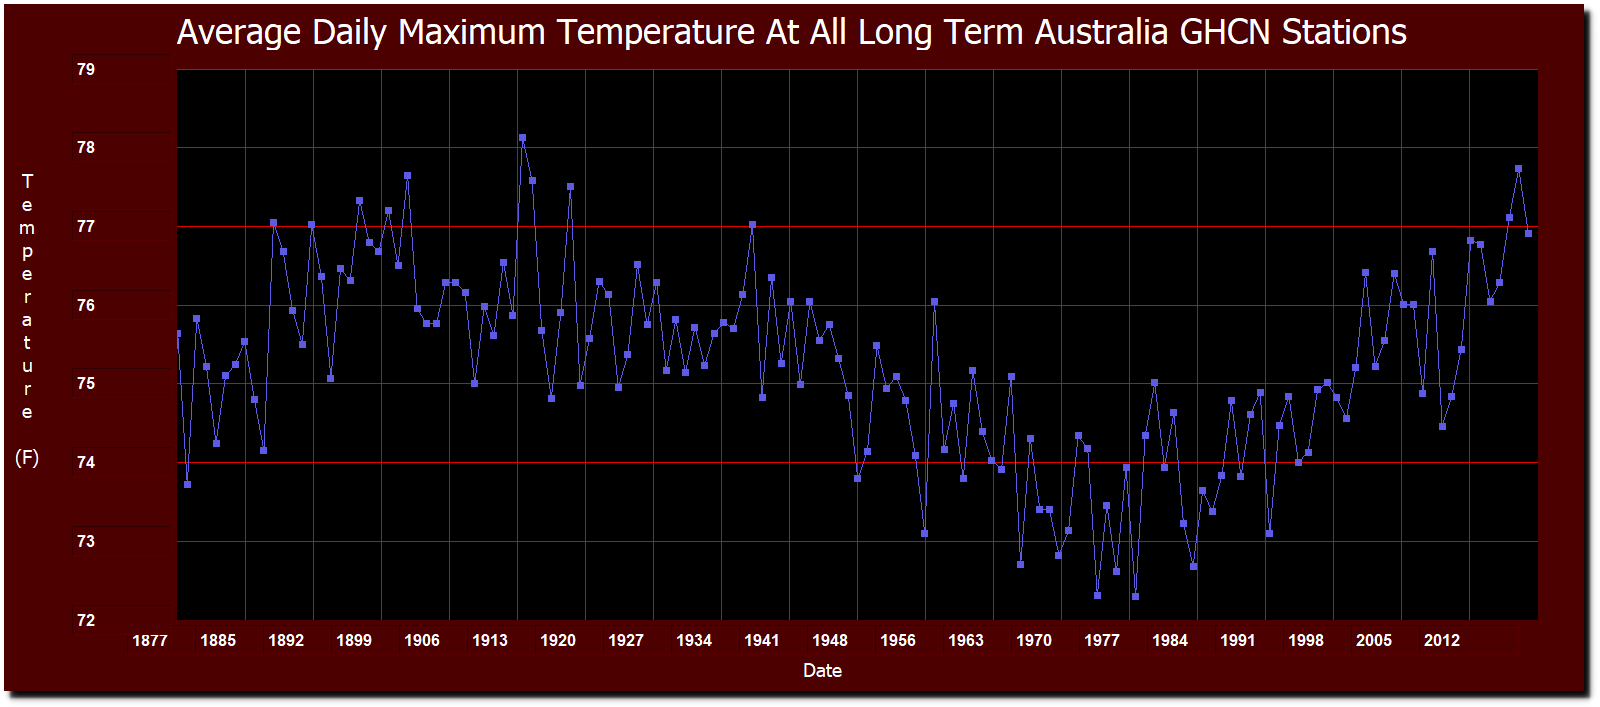
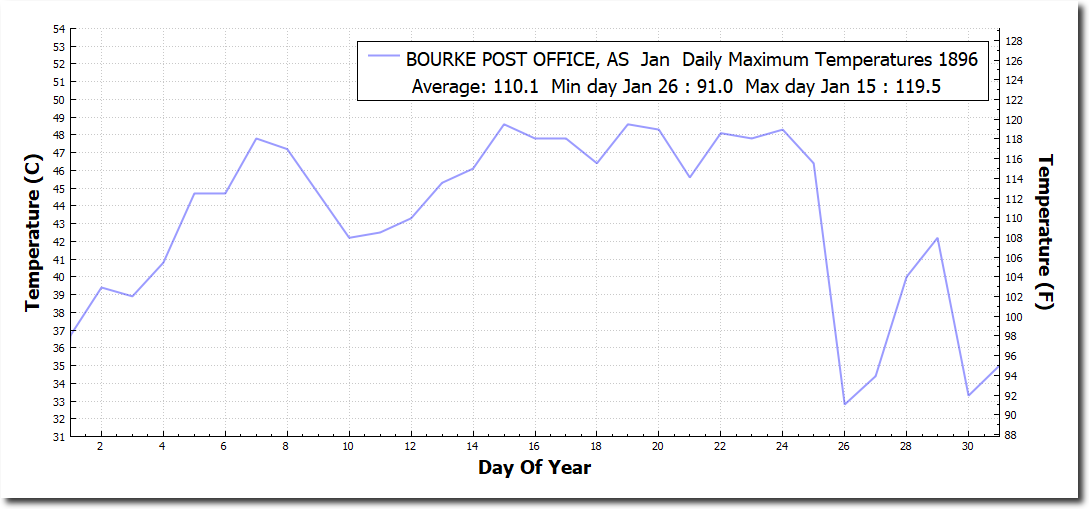
This is easy to test, because there is only one country in the southern hemisphere with coherent long term data. Australia has twenty locations where temperatures have been continuously recorded back to the 1880s.

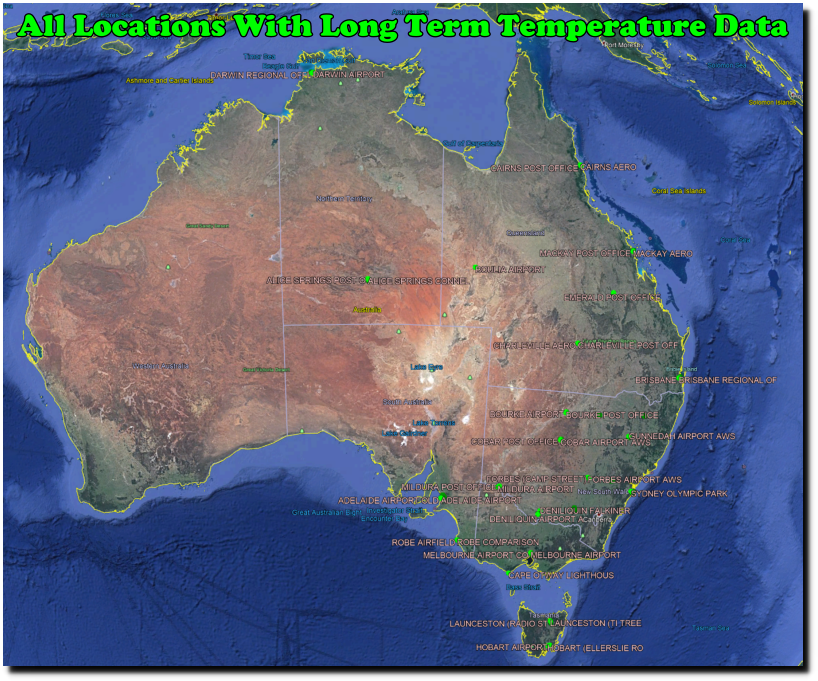
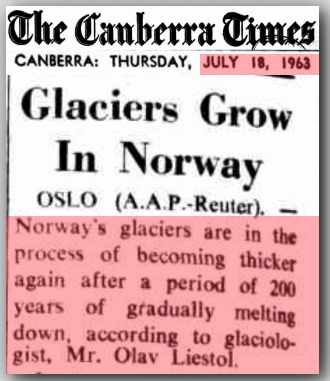
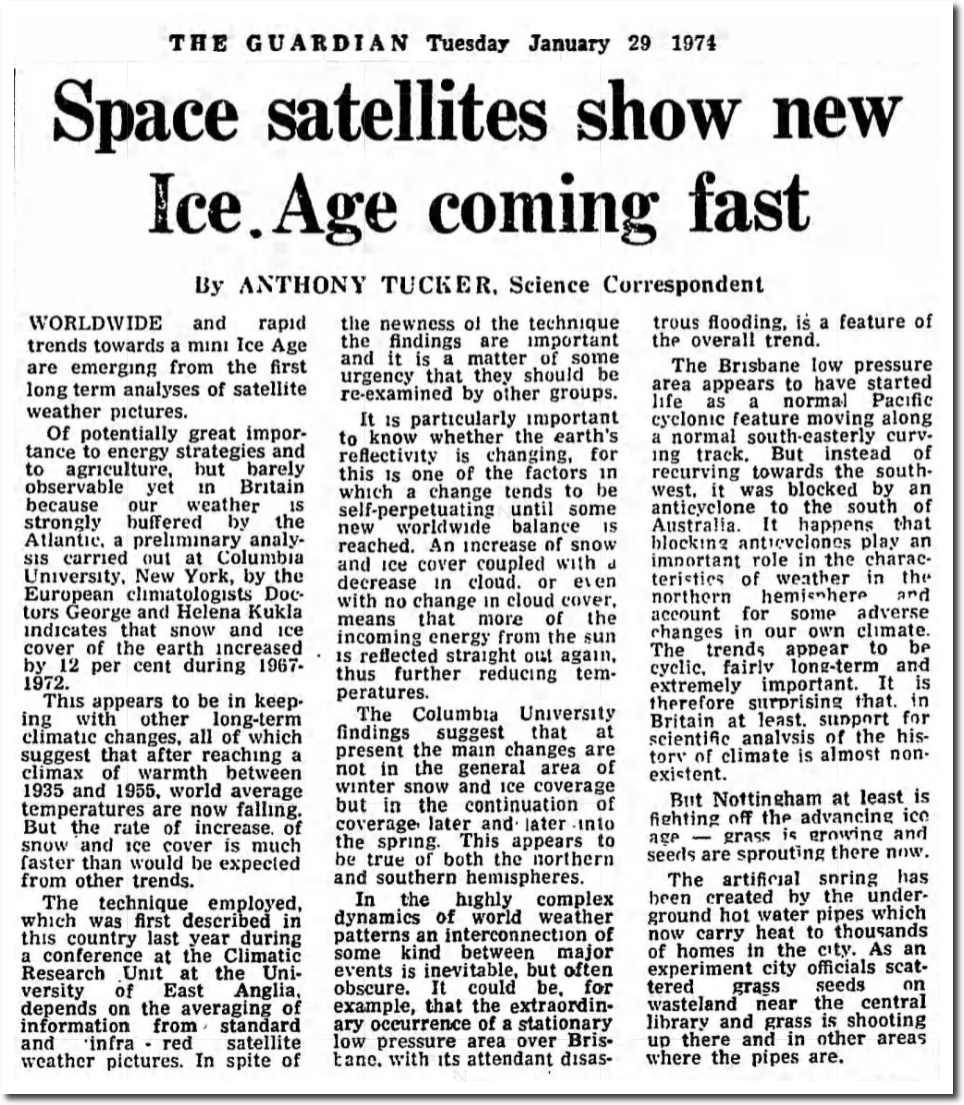
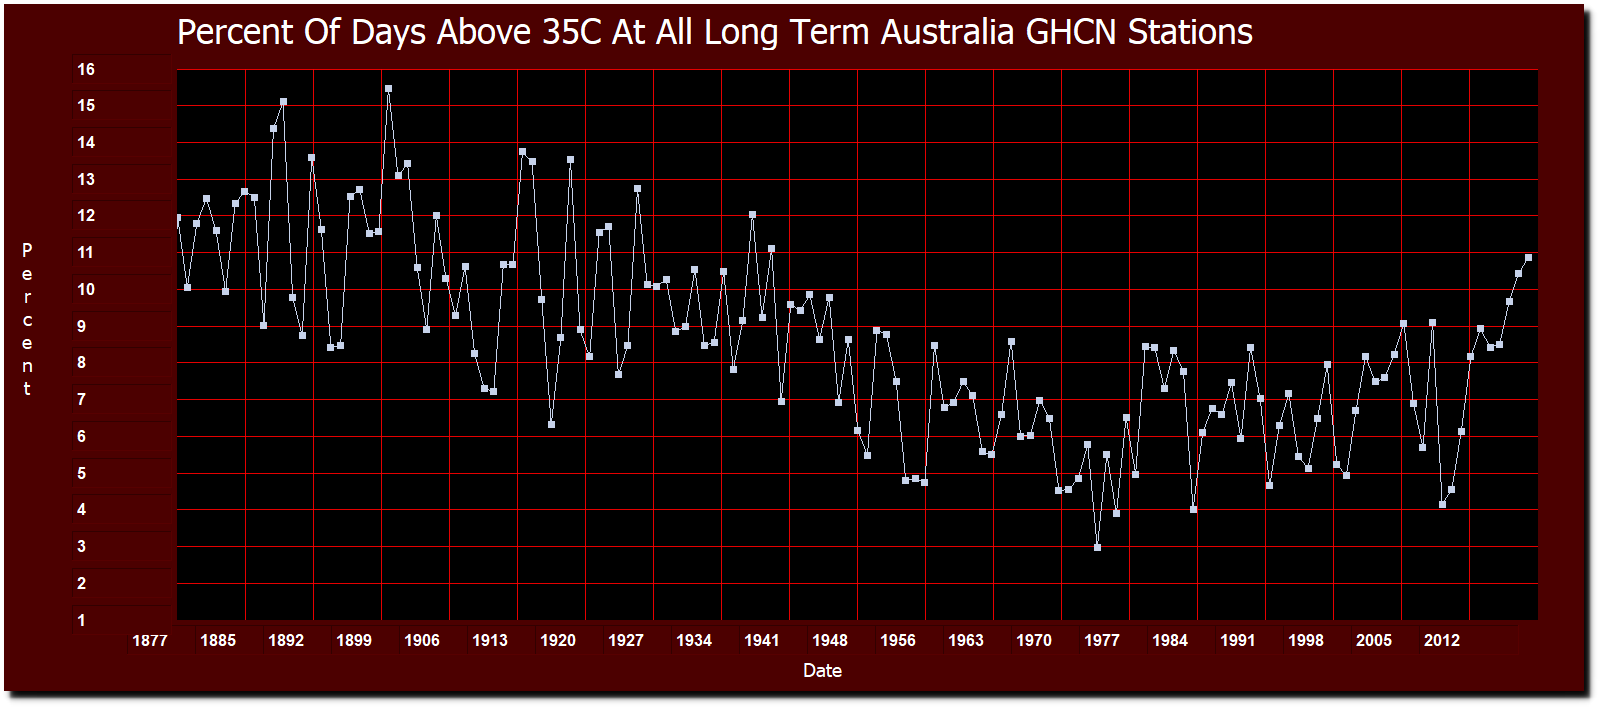
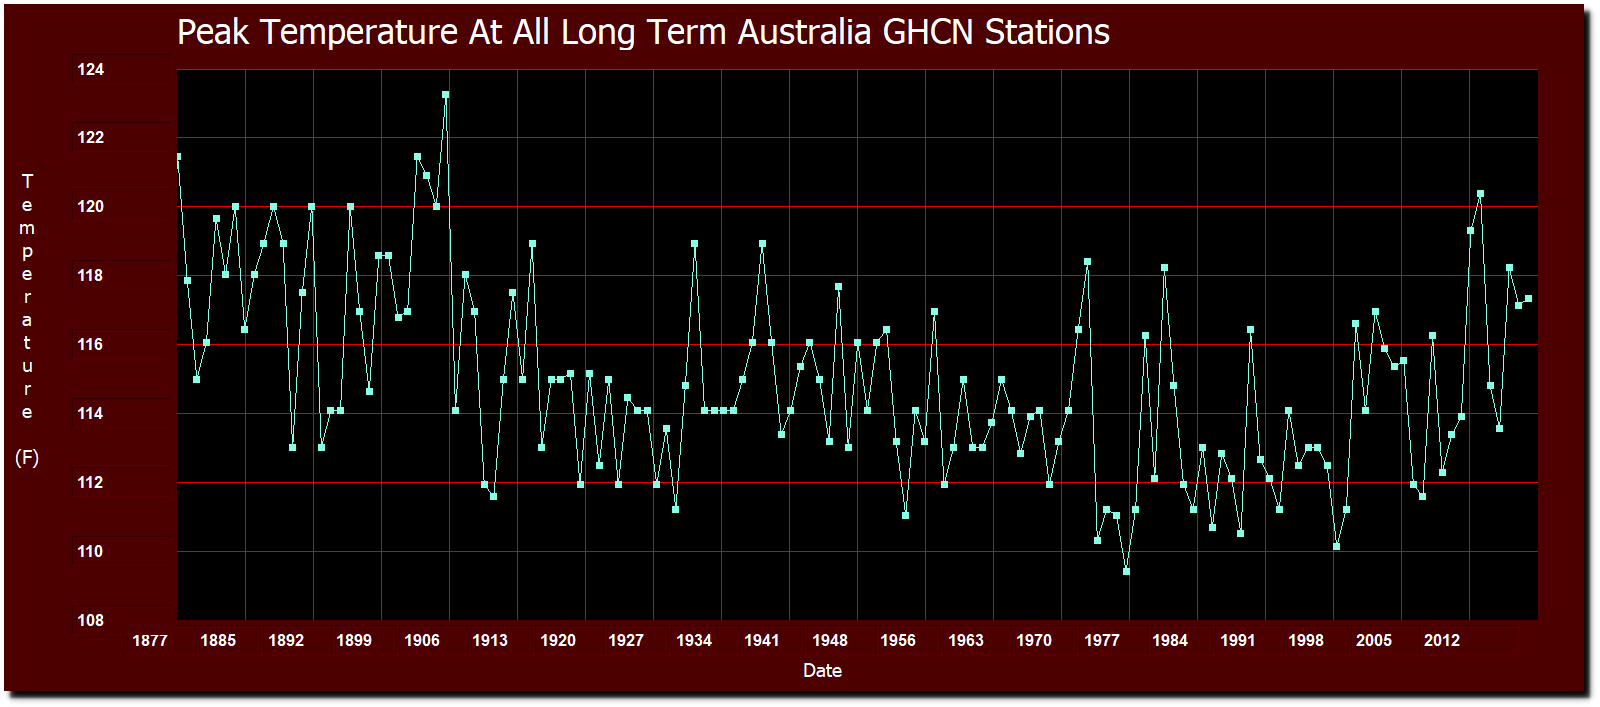
This group of stations shows that Australian temperatures peaked about a century ago, and reached their minimum during the 1970s. All metrics show the same thing.

Here is the list of stations used in this analysis.

ASN00040842.dly BRISBANE AERO   -27.3917 153.129
ASN00040223.dly BRISBANE AERO   -27.4178 153.114
ASN00040214.dly BRISBANE REGIONAL OFFICE   -27.4778 153.031
ASN00031011.dly CAIRNS AERO   -16.8736 145.746
ASN00031010.dly CAIRNS POST OFFICE   -16.9333 145.783
ASN00090015.dly CAPE OTWAY LIGHTHOUSE   -38.8556 143.513
ASN00044021.dly CHARLEVILLE AERO   -26.4139 146.256
ASN00044221.dly CHARLEVILLE AERO COMPARISON   -26.4147 146.261
ASN00044022.dly CHARLEVILLE POST OFFICE   -26.4025 146.238
ASN00048237.dly COBAR AIRPORT AWS   -31.5389 145.796
ASN00048244.dly COBAR COMPARISON   -31.4861 145.828
ASN00048027.dly COBAR MO   -31.484 145.829
ASN00048030.dly COBAR POST OFFICE   -31.5 145.8
ASN00014015.dly DARWIN AIRPORT   -12.4239 130.893
ASN00014040.dly DARWIN AIRPORT COMPARISON   -12.4227 130.884
ASN00014016.dly DARWIN POST OFFICE   -12.4 130.8
ASN00014161.dly DARWIN REGIONAL OFFICE   -12.4667 130.833
ASN00074128.dly DENILIQUIN (WILKINSON ST)   -35.5269 144.952
ASN00074210.dly DENILIQUIN AERO   -35.5333 144.967
ASN00074258.dly DENILIQUIN AIRPORT AWS   -35.5575 144.946
ASN00074039.dly DENILIQUIN FALKINER MEMORIAL   -35.3667 145.05
ASN00035264.dly EMERALD AIRPORT   -23.5694 148.176
ASN00035027.dly EMERALD POST OFFICE   -23.5267 148.162
ASN00065016.dly FORBES (CAMP STREET)   -33.3892 148.008
ASN00065103.dly FORBES AIRPORT AWS   -33.3627 147.921
ASN00055202.dly GUNNEDAH AIRPORT AWS   -30.9537 150.249
ASN00055023.dly GUNNEDAH POOL   -30.9841 150.254
ASN00055024.dly GUNNEDAH RESOURCE CENTRE   -31.0261 150.269
ASN00094029.dly HOBART (ELLERSLIE ROAD)   -42.8897 147.328
ASN00094008.dly HOBART AIRPORT   -42.8339 147.503
ASN00056242.dly INVERELL (RAGLAN ST)   -29.7796 151.112
ASN00056017.dly INVERELL COMPARISON   -29.7783 151.111
ASN00056018.dly INVERELL RESEARCH CENTRE   -29.7752 151.082
ASN00091218.dly LAUNCESTON (ELPHIN)   -41.45 147.167
ASN00091123.dly LAUNCESTON (MOUNT PLEASANT)   -41.4667 147.15
ASN00091049.dly LAUNCESTON (PUMPING STATION)   -41.5 147.2
ASN00091179.dly LAUNCESTON (RADIO STATION 7EX)   -41.45 147.15
ASN00091237.dly LAUNCESTON (TI TREE BEND)   -41.4194 147.122
ASN00091311.dly LAUNCESTON AIRPORT   -41.5492 147.214
ASN00091104.dly LAUNCESTON AIRPORT COMPARISON   -41.5397 147.203
ASN00033045.dly MACKAY AERO   -21.1706 149.179
ASN00033297.dly MACKAY COMPARISON   -21.1183 149.215
ASN00033119.dly MACKAY M.O   -21.1172 149.217
ASN00033046.dly MACKAY POST OFFICE   -21.15 149.183
ASN00086282.dly MELBOURNE AIRPORT   -37.6655 144.832
ASN00086384.dly MELBOURNE AIRPORT COMPARISON   -37.675 144.842
ASN00086071.dly MELBOURNE REGIONAL OFFICE   -37.8075 144.97
ASN00076031.dly MILDURA AIRPORT   -34.2358 142.087
ASN00076077.dly MILDURA POST OFFICE   -34.1833 142.2
ASN00026105.dly ROBE AIRFIELD   -37.1776 139.805
ASN00026026.dly ROBE COMPARISON   -37.1628 139.756
ASN00066062.dly SYDNEY (OBSERVATORY HILL)   -33.8607 151.205
ASN00066037.dly SYDNEY AIRPORT AMO   -33.9465 151.173
ASN00066196.dly SYDNEY HARBOUR (WEDDING CAKE W   -33.8414 151.263
ASN00066195.dly SYDNEY OLYMPIC PARK (SYDNEY OL   -33.8521 151.065
ASN00072151.dly WAGGA WAGGA (KOORINGAL)   -35.1333 147.367
ASN00073127.dly WAGGA WAGGA AGRICULTURAL INSTI   -35.0517 147.349
ASN00072150.dly WAGGA WAGGA AMO   -35.1583 147.457
ASN00074114.dly WAGGA WAGGA RESEARCH CENTRE   -35.1311 147.309
ASN00052088.dly WALGETT AIRPORT AWS   -30.0372 148.122
ASN00052026.dly WALGETT COUNCIL DEPOT   -30.0236 148.122

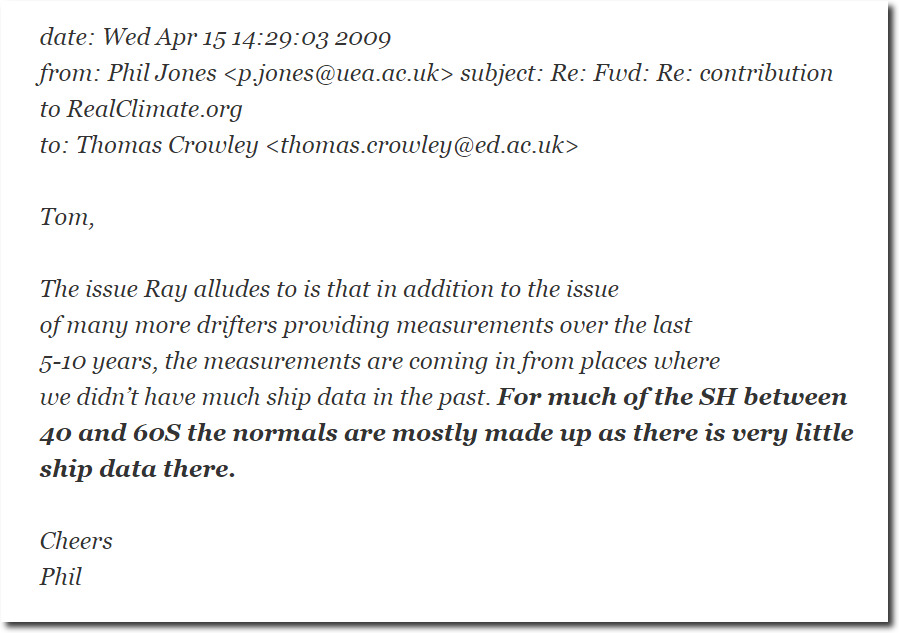
The only plausible explanation for how all the agencies got it wrong, is that they colluded to produce the same graphs – as indicated in this Climategate e-mail

di2.nu/foia/1254108338.txt

The Australian temperature graph from the Bureau of Meteorology is not only fake, but it hides all of the hot temperatures before 1910. It in no way represents Australia temperatures

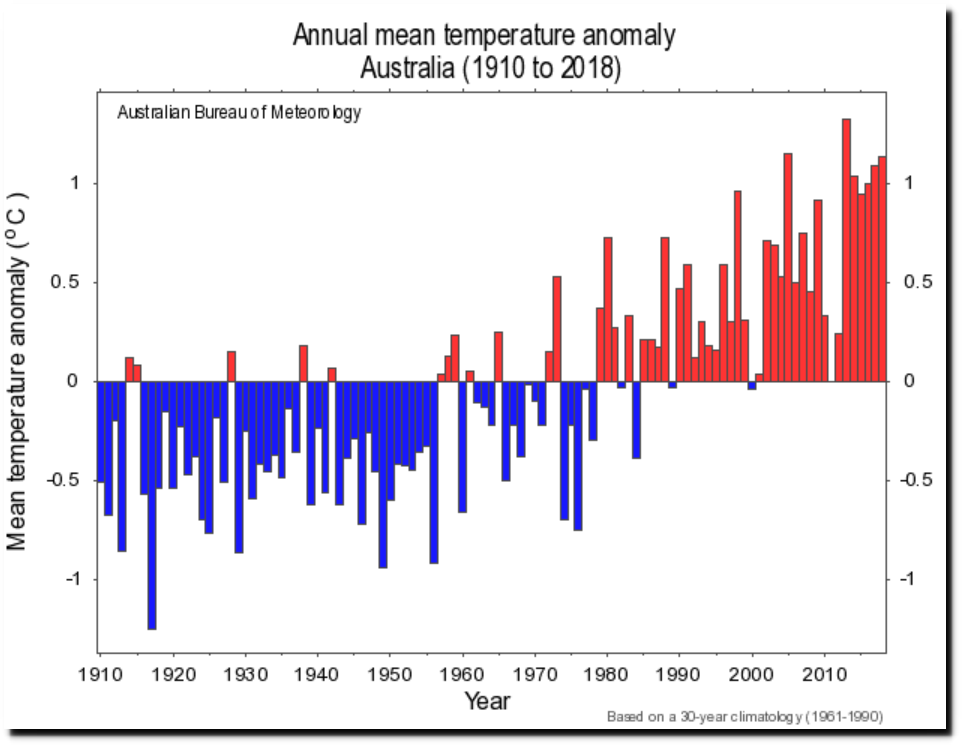
Climate change and variability: Tracker: Australian timeseries graphs

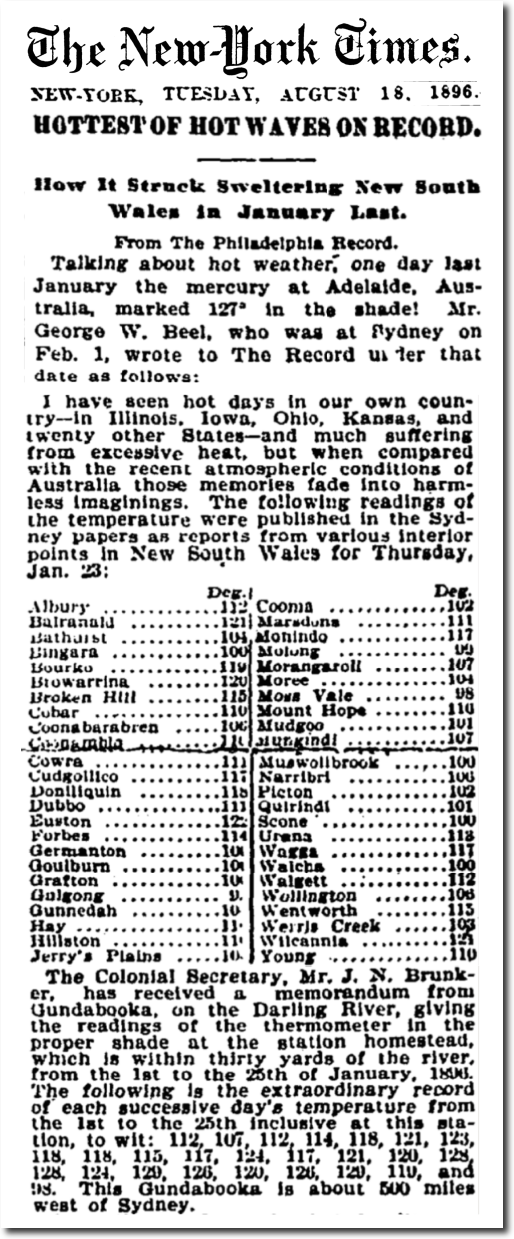
January, 1896 was the hottest month on record in New South Wales, and BOM hides the heat.

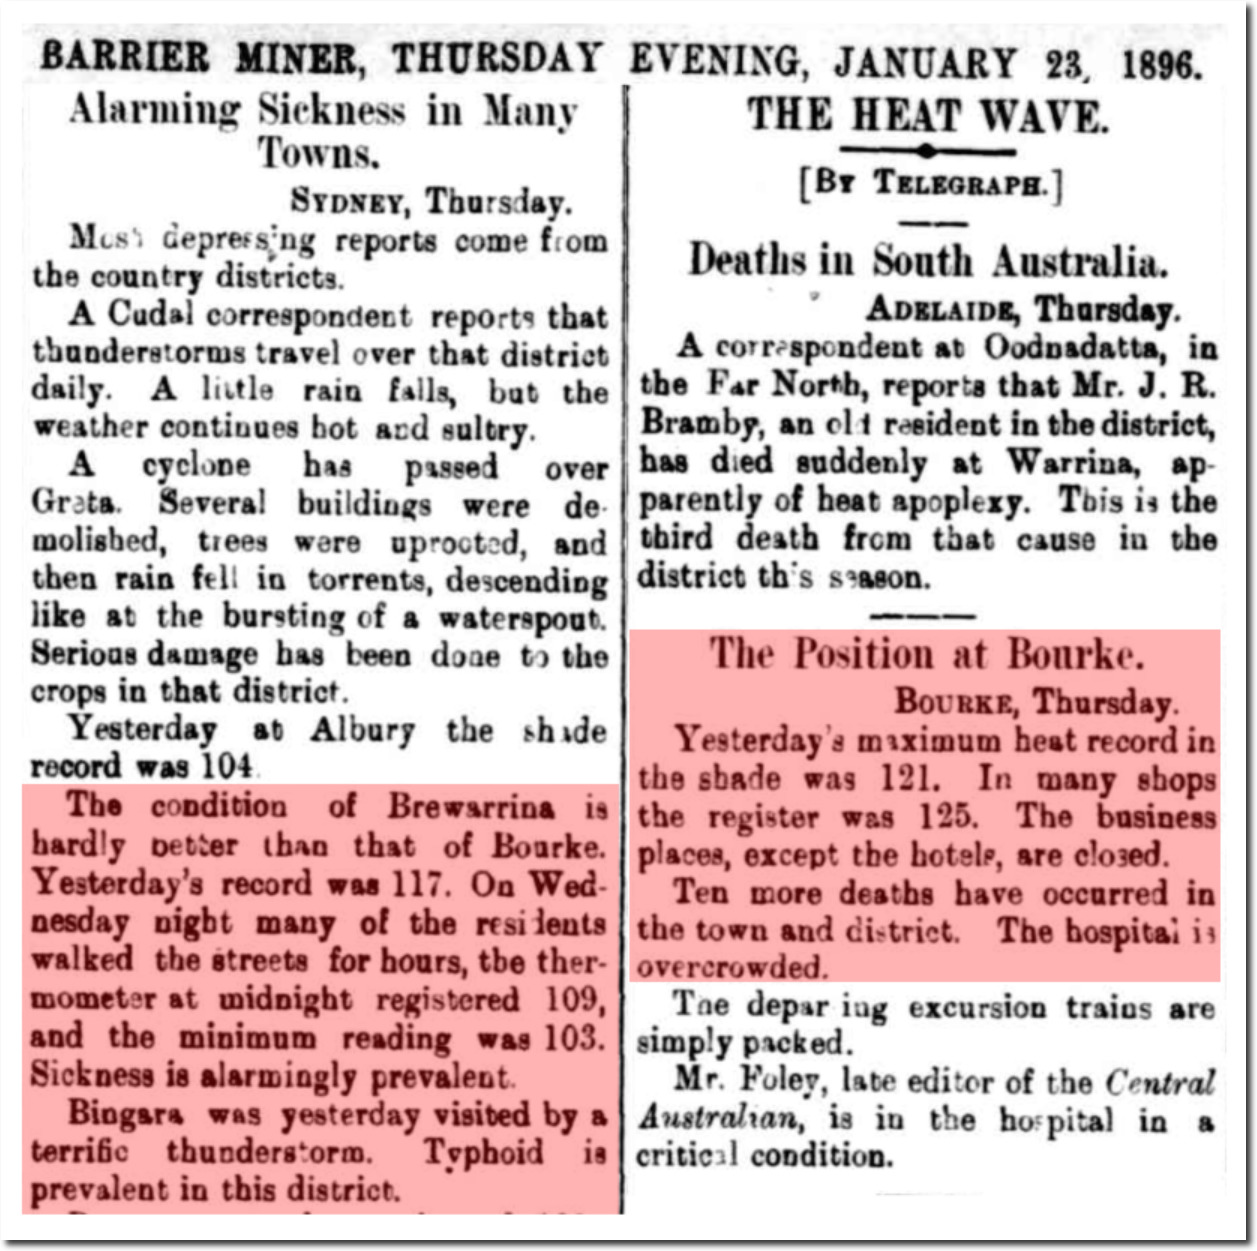
23 Jan 1896 – THE HEAT WAVE. – Trove

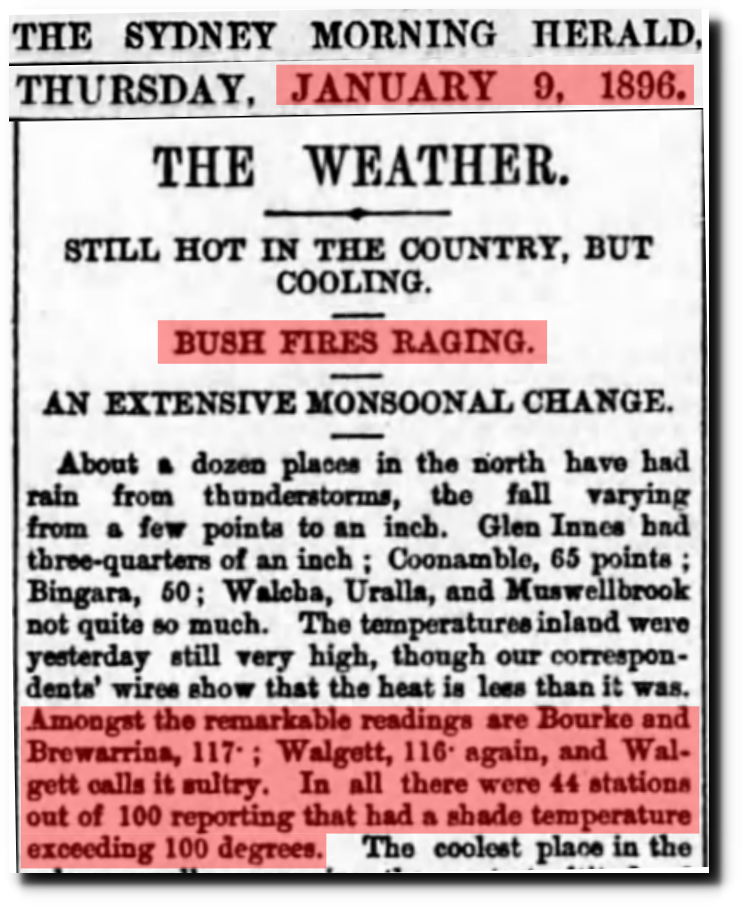
09 Jan 1896, Page 5 – The Sydney Morning Herald at Newspapers.com

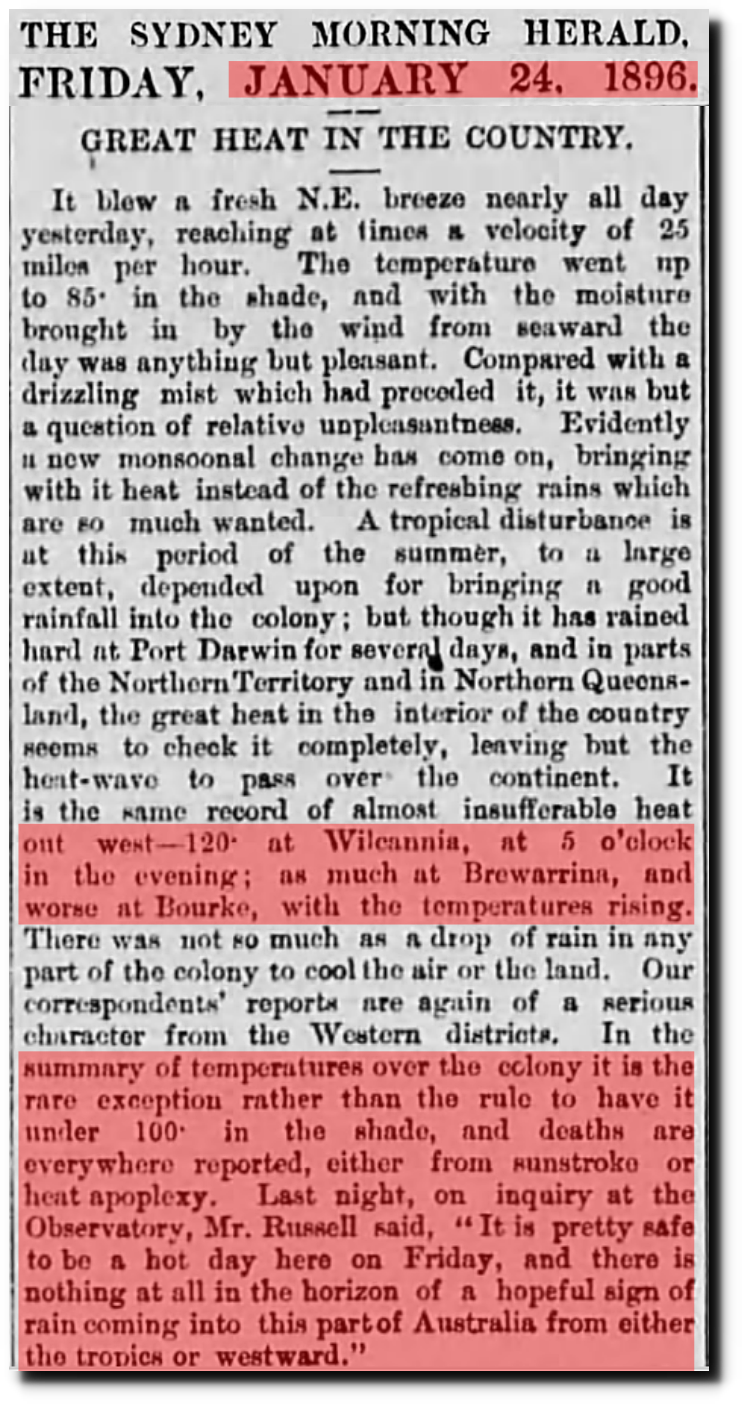
24 Jan 1896, Page 5 – The Sydney Morning Herald at Newspapers.com

TimesMachine: August 18, 1896

It was also hot in Europe in 1896.

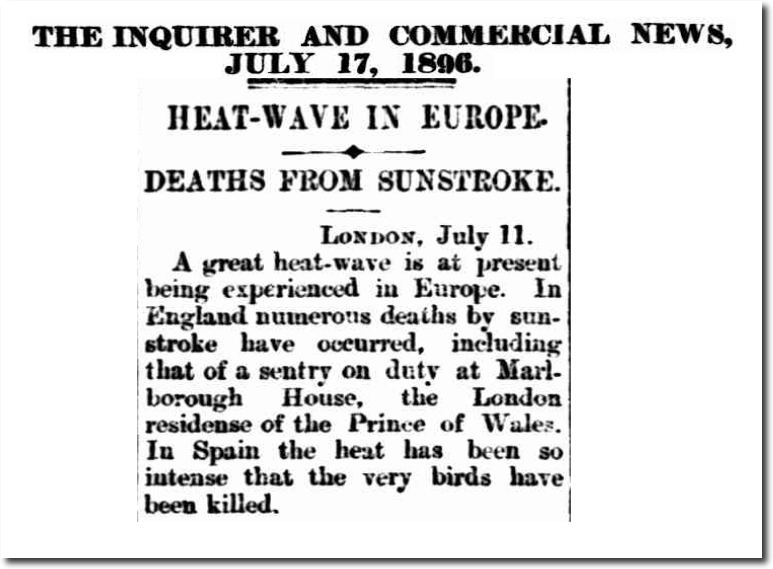
17 Jul 1896 – HEAT-WAVE IN EUROPE.

A ten day heatwave during August 1896 killed thousands of people in the US, many of them in New York.

1896 Heatwave

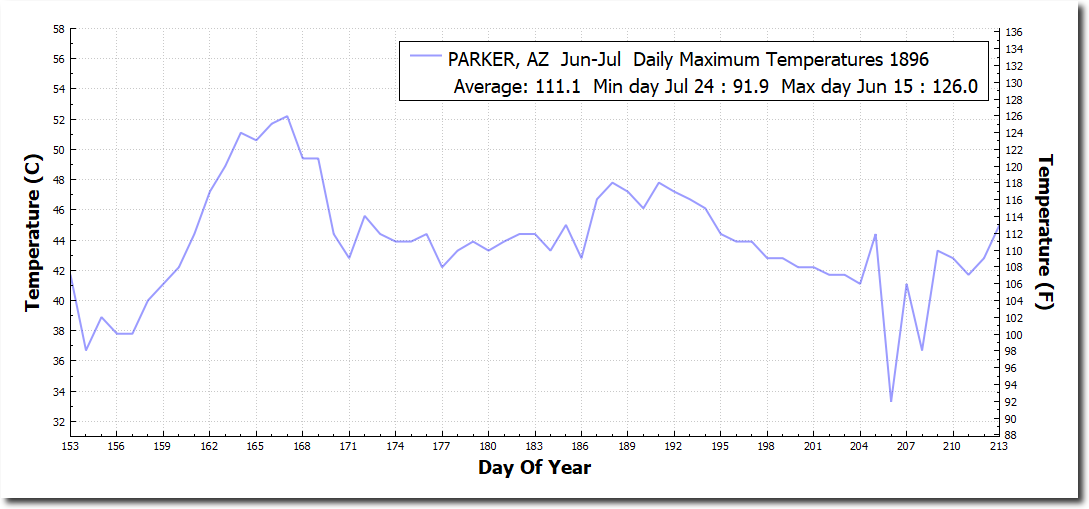
Arizona’s record heatwave over 120F occurred in 1896.

1896 was also a momentous year for climate science, when it started down the path of junk science, superstition and hiding and manipulating data

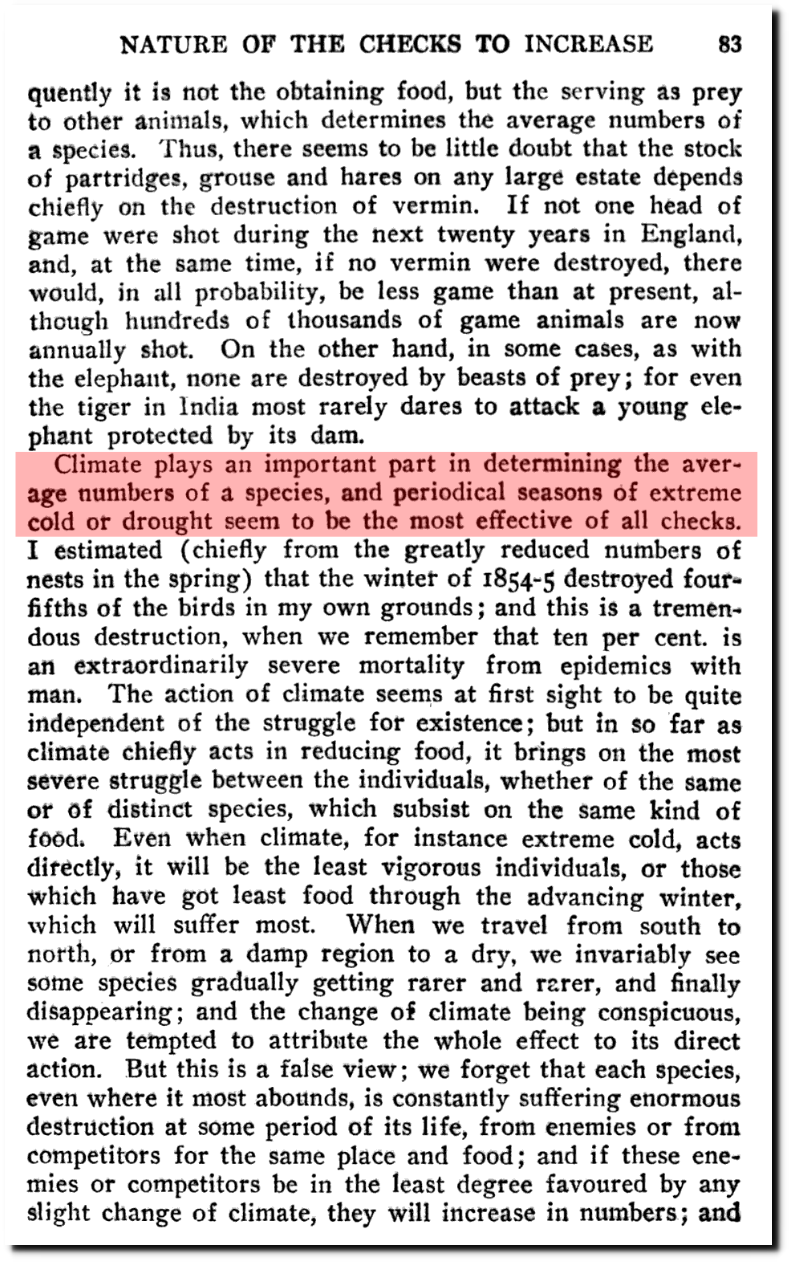
As early as in 1896, Swedish physicist Arrhenius proposed that the presence of atmospheric greenhouse gases may result in warmer surface temperatures on Earth than a simple radiative balance would imply. A comparison between measured surface temperatures and estimated effective temperatures (assuming the planets behave like black bodies and are at radiational equilibrium) of the planets in our solar system has later revealed that planets with thick atmospheres, such as Venus and Earth, have a warmer surface than a simple radiation equilibrium can explain (Houghton 1991). The high surface temperature can be attributed to the greenhouse effect proposed by Arrhenius

40-3-3.14.pdf

The climate science was an actual science, its participants would want to understand the heat of the past – rather than hide it.

Posted in Uncategorized | Leave a comment

Balls Of Fire Fell Like Meteors

On October 8, 1871 the worst fires in US history occurred. Chicago burned to the ground, as did many other towns around Lake Michigan and Lake Huron. Peshtigo, Wisconsin was hardest hit, with more than 1,000 dead.

Balls of fire were observed to fall like meteors in different parts of the town.

It seemed as if the love of God had been withdrawn from the place, and the fury fiends of hell had been loosened to wantonly vex and torment the people.

25 Oct 1871, 1 – Altoona Tribune at Newspapers.com

Posted in Uncategorized | Leave a comment

Record Cold In Boulder

Posted in Uncategorized | Leave a comment

New Video : “A Crime Against The Community”

Posted in Uncategorized | Leave a comment

Nobel Laureate

Posted in Uncategorized | Leave a comment

Time Travelling Climate Scientists

Zeke Hausfather has determined that he knows more about the weather of the 1970s, than all of the scientists who were studying it at the time.

By definition, the temperatures recorded 40+ years ago are at least 40 years old.  Zeke is arguing that history should be ignored, because it is old. He thinks he knows better than the scientists who actually observed the global cooling in the 1970s, like NCAR, the National Academy of Sciences, and NOAA.

National Academy Of Sciences

NOAA showed cooling in both hemispheres from both surface and radiosonde measurements.

NOAA

There was no question earth was cooling sharply after the 1940s. Ice was increasing. Ice doesn’t lie, but climate scientists do.

14 Apr 1973, Page 8 – Iowa City Press-Citizen

U.S. and Soviet Press Studies of a Colder Arctic – The New York Times

18 Jul 1963 – Glaciers Grow In Norway

29 Jan 1974, 5 – The Guardian at Newspapers.com

The National Geographic Archive | November 1976 | page 1

March 1, 1975 | Science News

International Team of Specialists Finds No End in Sight to 30?Year Cooling Trend in Northern Hemisphere – The New York Times

Forty-two top American and European researchers sent a letter to the president warning that the current rate of cooling would lead to a new ice age in about a century.

THE ROLE OF NOAA’S CLIMATE PREDICTION CENTER IN THE DEVELOPMENT OF CLIMATE SERVICES

This Climategate email shows that scientists at multiple agencies and different countries colluded to remove the warmth of the 1940s, and subsequent cooling.

di2.nu/foia/1254108338.txt

Zeke brags that they are using a lot more stations now, but note that there has been essentially no change in historical coverage.  All they have done is add a lot of fragmented, low quality data which scientists 40 years ago were wise enough to ignore. In the 1970s they used only high quality data, because they were actual scientists.

The only thing Zeke has accomplished is he has added a huge number of broken, fragmented stations.  Here is every single daily temperature record for Brazil, Argentina and Uruguay in the GHCN database. The vast majority of these stations should never have been used.

Zeke claims they have millions of ocean temperatures from the “mid-century period”

In this Climategate e-mail, Phil Jones said much of the Southern Hemisphere data was “made up.”

di2.nu/foia/foia2011/mail/2729.txt

NASA didn’t even pretend to have usable pre-1950 ocean data until about 15 years ago.

2001 GISS Land/Ocean Data

The methodology for collecting ocean data has created an error bar which is much greater than the claimed trend.

Zeke claims that all of these independent agencies agree, but when Gavin Schmidt at NASA was confronted obviously fraudulent temperatures in Iceland, he responded by saying his data comes from NOAA. There is nothing independent about the data.

Senator Malcolm Roberts confronted Schmidt about this data tampering.

Gavin responded with this ad hominem attack.

NASA chief slaps down climate sceptic senator Malcolm Roberts: ‘You hold a number of misconceptions’

Then he responded by saying that NASA data actually comes from NOAA. So there is nothing independent about the data sets.

robertsnasags.pdf

Zeke claims there were no cooling outside of the Northern Hemisphere higher-latitude regions

The US is the only large area with a high quality long term temperature record, and it shows sharp cooling into the 1970s, and temperatures no warmer now than 80 years ago.

Summers were much hotter in the US 80 years ago.

Zeke says he has explained his BS to “folks like me” time and time again, and that he knows better than all of the scientists who lived through and studied the warmth of the 1940s and subsequent cooling.

Then Scott Denning at CSU jumped in with a spectacular and disgusting ad hominem attack.  I have no relationship with Ned Nikolov or any Kardashian.  I did however have a relationship with Denning’s far more accomplished colleague Dr. Bill Gray, who asked me on his deathbed to carry on his climate legacy. I tried for nearly a year to get Denning to join Bill and myself for lunch in Fort Collins, and Scott found an excuse to chicken out at the last minute every time. Bill is gone now and I intend to ramp up my effort to expose climate misinformers like Denning and Hausfather.

Bill Gray: A Towering Figure in Hurricane Science | Dr. Jeff Masters’ WunderBlog

Speaking of which, I attended a lecture at CSU about ten years ago, which I believe was given by Denning. A woman asked him if global warming would produce more extreme weather.  He gave an emphatic no, other than the possibility that some hurricanes may get stronger.

Posted in Uncategorized | Leave a comment

Darwin – Extreme Drought An Important Part Of Evolution

Origin Of Species

Apparently the earth had extreme cyclical weather before the SUV was invented. Darwin was one of the early climate deniers.

Posted in Uncategorized | Leave a comment

New Video : A Very Ugly Rewrite Of Climate History

Posted in Uncategorized | Leave a comment

Hansen : 6+ Feet Of Sea Level Rise “Almost Dead Certain” This Century

we assert that multi-meter sea level rise on the century time scale are not only possible, but almost dead certain.

Must-read Hansen and Sato paper: We are at a climate tipping point that, once crossed, enables multi-meter sea level rise this century – ThinkProgress

This is of course wrong, because the planet will be destroyed in just over eleven years.

Ocasio-Cortez says the world will end in 12 years. She is absolutely right. – The Washington Post

Posted in Uncategorized | Leave a comment

The Worthless Temperature Record From South America

Posted in Uncategorized | Leave a comment