Arctic Sea Ice Volume Highest In Eleven Years

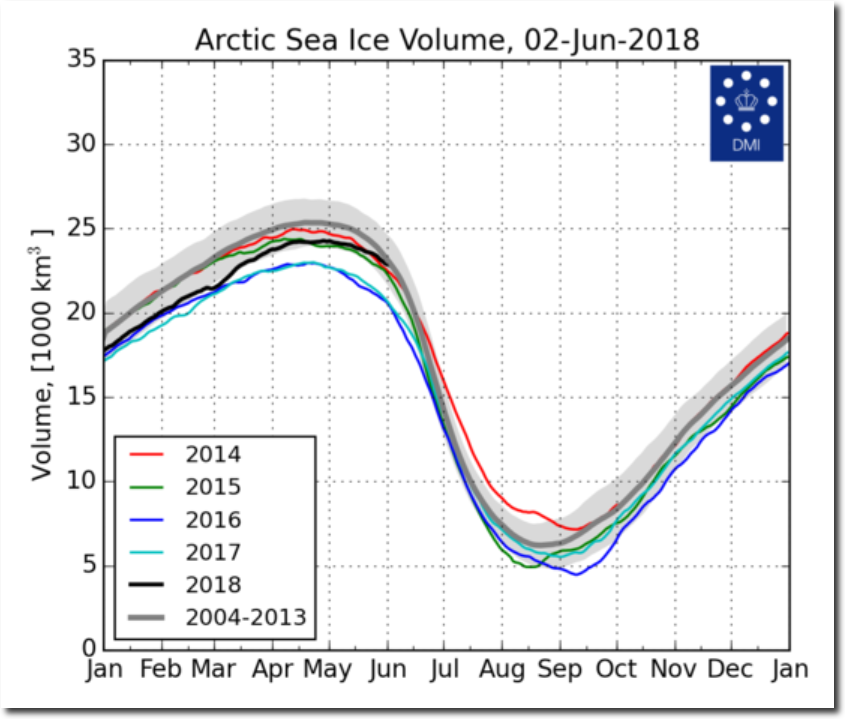
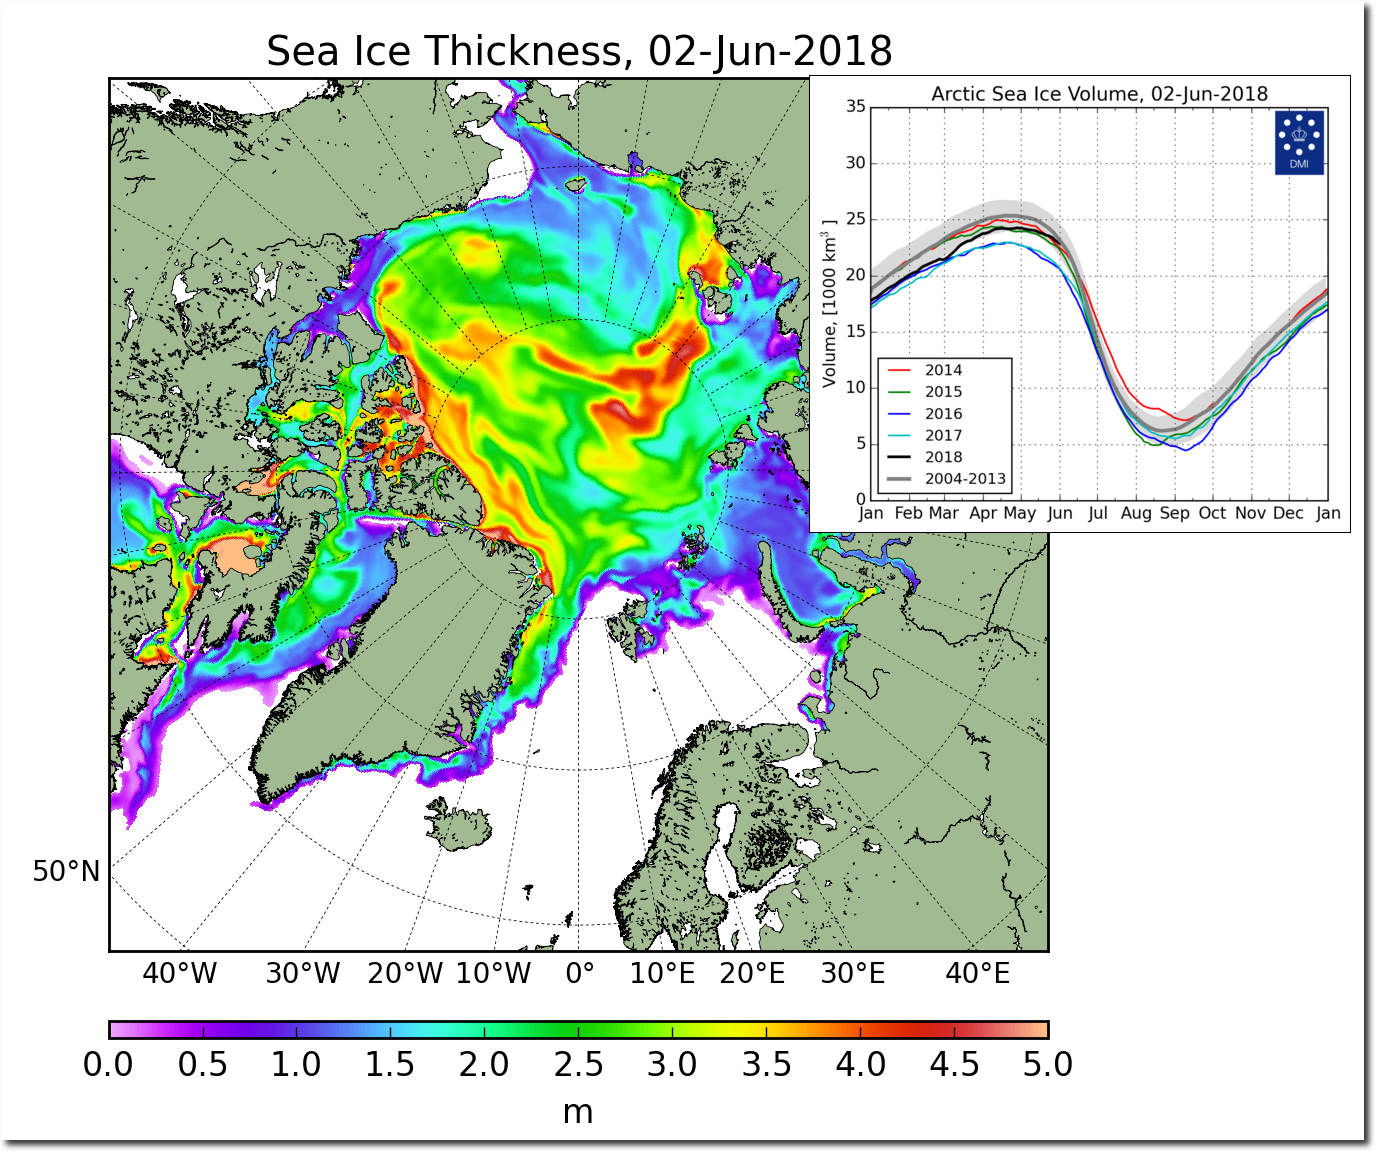
According to the Danish Meteorological Institute, Arctic sea ice volume is highest for the past eleven years and above the fifteen year mean since the start of DMI records in 2003.

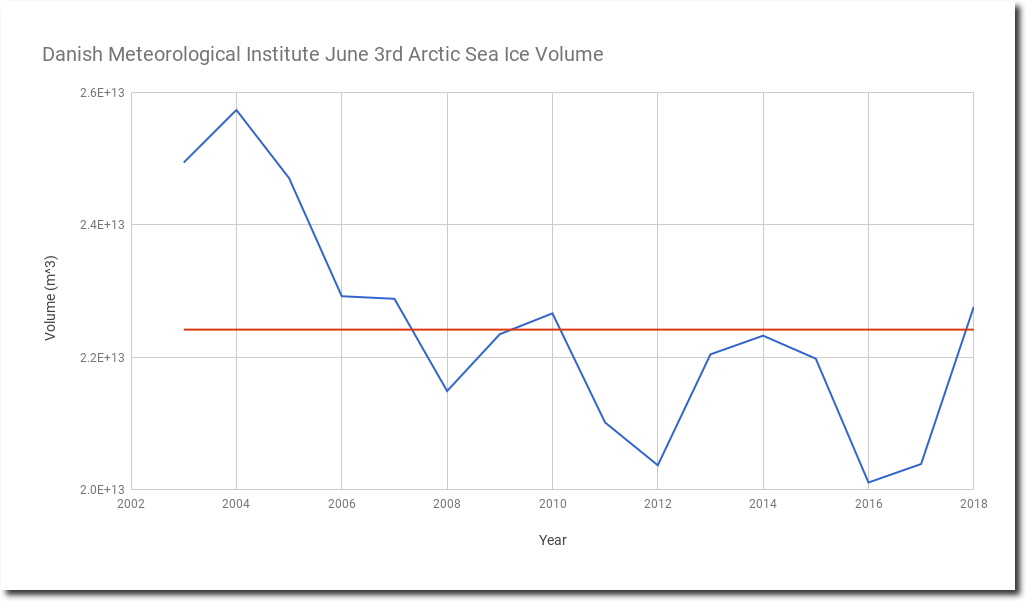
http://ocean.dmi.dk/arctic/icethickness/txt/IceVol.txt    Spreadsheet

FullSize_CICE_combine_thick_SM_EN_20180603.png (1337×1113)

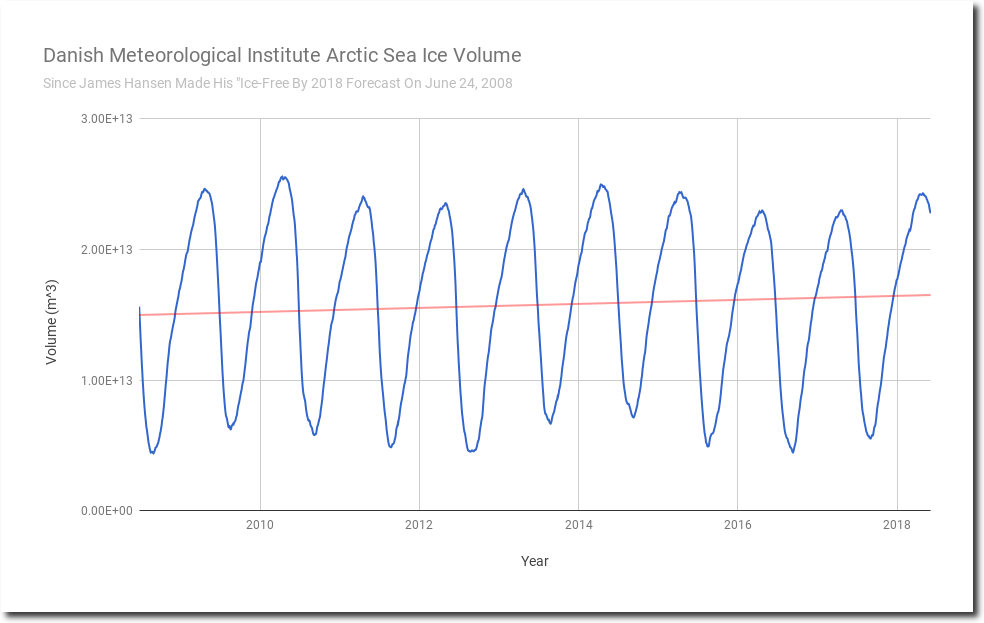
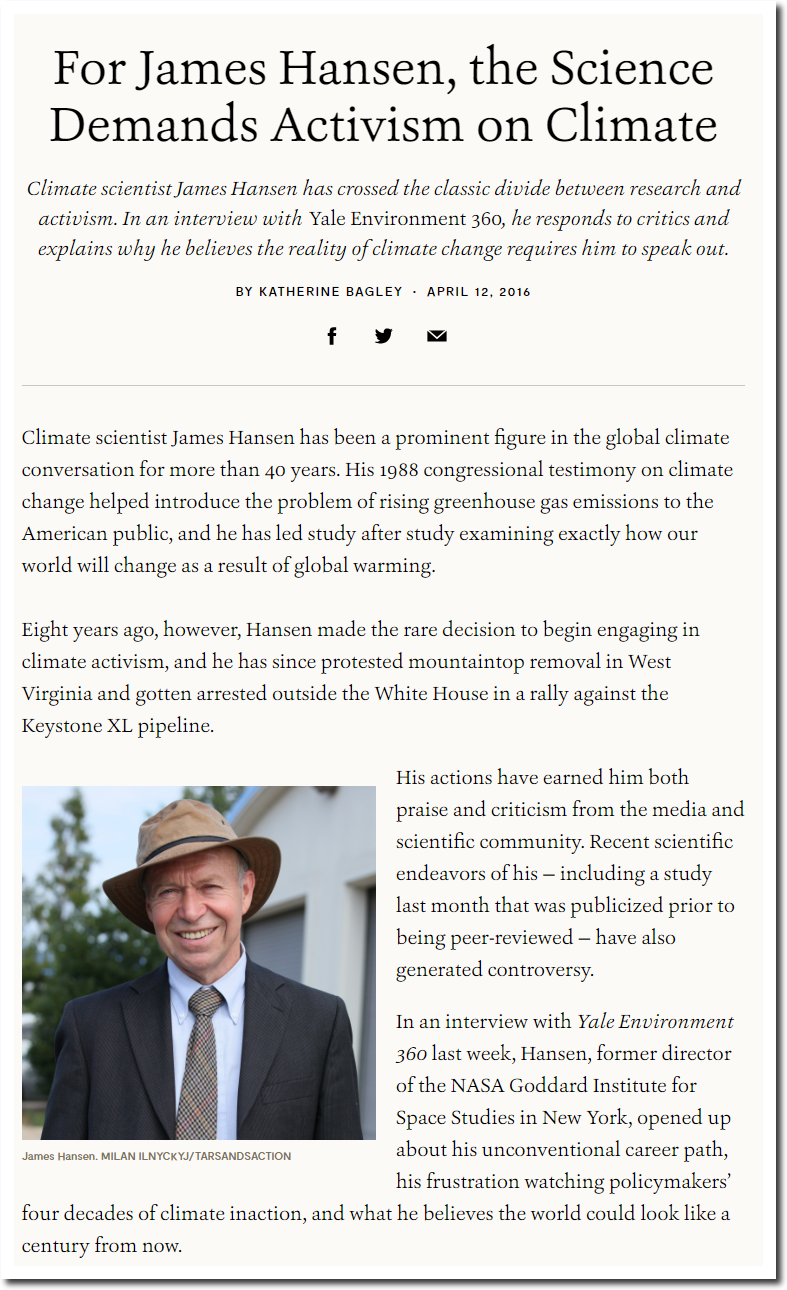
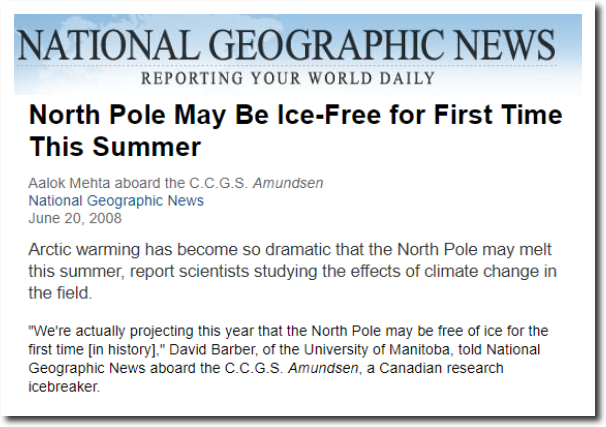
But fear not climate alarmists.  Your #1 prophet says the Arctic will be ice-free in a few weeks. He only needs to melt 22.8 trillion cubic meters of ice, with temperatures far below normal, and far below the freezing point.

The Argus-Press – Google News Archive Search

Here is what Arctic sea ice volume has done since the day Hansen made that prophecy – “echoing work by other scientists.

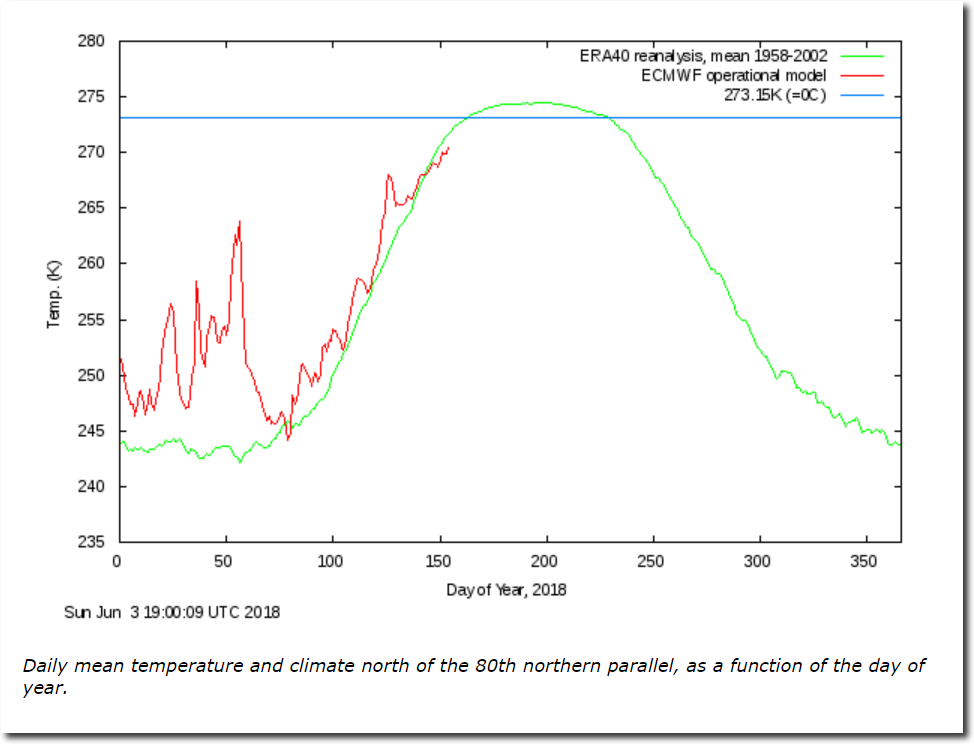
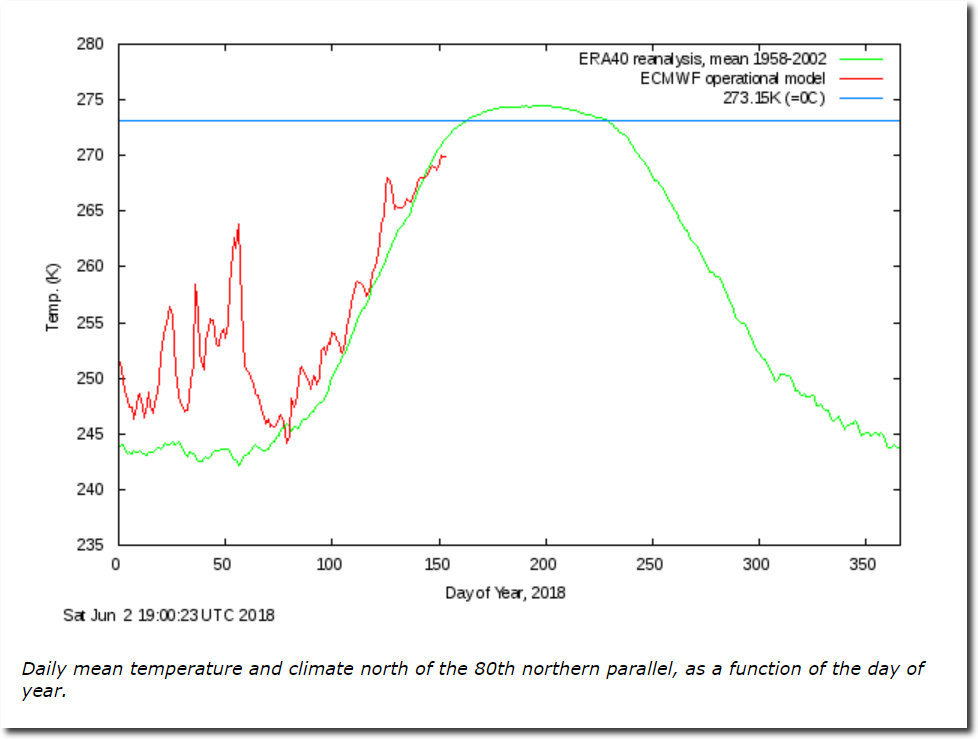
The North Pole normally starts melting this week for 70 days, but looks like melt will be delayed again this year due to below freezing temperatures.

Ocean and Ice Services | Danmarks Meteorologiske Institut

And with Reggie’s current legal problems, he probably won’t be able to help out with his blowtorch.

Posted in Uncategorized | Leave a comment

No Sea Level Rise – A Mortal Threat To California

Government climate fraudsters say near-zero sea level rise at Alameda, California is a huge threat.

Sea level is lower there now than it was in the 1930’s.

Sea Level Trends – NOAA Tides & Currents

Not to be outdone, Jerry Brown has made it a crime to stay clean in California.

It’s Now Against The Law In California To Shower And Do Laundry On The Same Day | Zero Hedge

California has plenty of water, but they use almost two-thirds of it to protect Snail Darters and similar critters. Cities use less than 10% of the water.

Water Use in California – Public Policy Institute of California

Why any sane person votes for Democrats is beyond my comprehension. However the same could be said about many Congressional Republicans.

Posted in Uncategorized | Leave a comment

And Then There Was 1933 ….

Normally when talking about the hot 1930’s, 1933 gets ignored – but the summer of 1933 also brought some incredibly hot weather. On June 5, 1933, McCook, Nebraska was 112 degrees.  June 1933 was much hotter in Nebraska than the US record hot year of 1934.

We are now used to a pattern where hot weather is confined to the desert southwest, but 80 years ago hot weather was very common across much of the country east of the Rocky Mountains.

During 1936, almost 80% of USHCN stations reached 100 degrees. Since then the coverage and frequency of hot weather has plummeted.

This of course doesn’t stop government climate fraudsters from generating fake graphs in an attempt to influence policy.

U.S. Climate Extremes Index (CEI): Graph | Extremes | National Centers for Environmental Information (NCEI)

The entire point of government climate science is to influence policy. It has nothing to do with science or climate.

For James Hansen, the Science Demands Activism on Climate – Yale E360

Posted in Uncategorized | Leave a comment

The Most Fraudulent Climate Data

Essentially all government temperature graphs are fraudulent, but none more so than the NOAA Climate Extremes Index (CEI) – which shows summer maximum temperatures getting hotter and passing the heat of the 1930’s.

The sum of (a) percentage of the United States with maximum temperatures much below normal and (b) percentage of the United States with maximum temperatures much above normal.

U.S. Climate Extremes Index (CEI): Graph | Extremes | National Centers for Environmental Information (NCEI)

There is no basis for the NOAA claims – summer maximum temperatures have plummeted in the US to record or near record lows. The shape (but not the magnitude) of the CEI graphs is approximately correct prior to 1960, but after 1960 the NOAA data is completely fraudulent and has no basis in reality.


Most government climate fraudsters at least make some attempt at plausible deniability, but not so with NOAA’s climate extremes index. Even some people at the EPA seem to understand that summers in the 1930’s were much hotter.

Climate Change Indicators: High and Low Temperatures | Climate Change Indicators in the United States | US EPA

Posted in Uncategorized | Leave a comment

Burying The 1896 Heat

The two most intense heatwaves in Arizona history occurred in 1896 and 1905

January, 1896 was the hottest month on record in New South Wales.

09 Jan 1896, Page 5 – The Sydney Morning Herald at Newspapers.com

24 Jan 1896, Page 5 – The Sydney Morning Herald at Newspapers.com

TimesMachine: August 18, 1896

Hot in Europe

17 Jul 1896 – HEAT-WAVE IN EUROPE.

A ten day heatwave during August 1896 killed thousands of people in the US, many of them in New York.

1896 Heatwave

Climate science was destroyed by Arrhenius in 1896, and never recovered.

As early as in 1896, Swedish physicist Arrhenius proposed that the presence of atmospheric greenhouse gases may result in warmer surface temperatures on Earth than a simple radiative balance would imply. A comparison between measured surface temperatures and estimated effective temperatures (assuming the planets behave like black bodies and are at radiational equilibrium) of the planets in our solar system has later revealed that planets with thick atmospheres, such as Venus and Earth, have a warmer surface than a simple radiation equilibrium can explain (Houghton 1991). The high surface temperature can be attributed to the greenhouse effect proposed by Arrhenius

40-3-3.14.pdf

If climate scientists were actual scientists, they would want to understand the record heat of 1896. Instead they simply try to make it disappear.

Posted in Uncategorized | Leave a comment

Arctic Alarmist Meltdown Continues

On May 1st I warned : “This summer is shaping up to be a complete disaster for the climate mafia” 

The summer is unfolding exactly as I expected.  The ice is melting very slowly, sea ice volume is normal, and is the highest in five years.  Volume is much higher than ten years ago and about the same as twelve years ago.


FullSize_CICE_combine_thick_SM_EN_20180602.png

The ice is much thicker than ten years ago across most of the Arctic.

FullSize_CICE_combine_thick_SM_EN_20080602.png

As with all recent summers, temperatures near the pole are very cold and below normal.

Ocean and Ice Services | Danmarks Meteorologiske Institut

This is what highly paid Arctic experts were saying ten years ago :

North Pole May Be Ice-Free for First Time This Summer

North Pole could be ice free in 2008 | New Scientist

Expert: Arctic polar cap may disappear this summer_English_Xinhua

BBC NEWS | UK | Swimmer aims to kayak to N Pole

This is what I was saying ten years ago :

Arctic ice refuses to melt as ordered • The Register

Climate experts have shown zero skill or integrity, which is why they are so widely acclaimed by the political left, press and Democratic Party – who also have no skill or integrity.  But fear not members of the climate religion – your prophet says the Arctic will be ice-free this summer.

The Argus-Press – Google News Archive Search

Posted in Uncategorized | Leave a comment

Locating The Missing Cold

The rocks may melt, and the sea may burn.

– Tom Petty

Less than a year ago, scientists located another canary in the coal mine. Warm sea surface temperatures west of Africa were “the most powerful evidence climate scientists have of global warming.”

The Most Powerful Evidence Climate Scientists Have of Global Warming | InsideClimate News

Sea surface temperatures west of Africa have plummeted and now are more than 2C below normal.

sst_anom.gif (800×600)

Climate science is populated by ignorant hacks with no understanding of science, ethics or reality – which is why Democrats and the press love them so much.

Posted in Uncategorized | Leave a comment

NCAR 1974 : Global Cooling/Climate Disasters The New Normal

In case you forgot why climate scientists pretend they don’t have Arctic sea ice satellite data before 1979.

Wayback Machine

Posted in Uncategorized | Leave a comment

It Is The Data Tampering, Stupid

One of the many excuses used by climate alarmists (and some skeptics) to ignore my data tampering graphs, is that I don’t grid the data. What I do is take a straight numerical average of temperatures at all stations, which is the cleanest and easiest way to understand and interpret the data. The graph below compares my numerical USHCN average vs. NCDC gridded US temperatures. The trends are nearly identical.

As you can see, gridding has very little effect on the trend.

What alarmists choose to ignore is the data tampering, which makes a huge difference.

Spreadsheet

So why doesn’t gridding matter? Because USHCN stations are relatively evenly spaced around the country.

Climate alarmists can’t stand clean, unadjusted data – and the fact is that gridding obfuscates and contaminates data and hardly makes any difference to the trend.

Posted in Uncategorized | Leave a comment

Greens Destroying The Environment

The gods of the climate change superstition demand that greens destroy the environment.

Millions of trees chopped down to make way for Scottish wind farms – Telegraph

Scottish greens believe this is necessary to stop imaginary sea level rise.

Sea Level Trends – NOAA Tides & Currents

Posted in Uncategorized | Leave a comment