On May 1st I warned : “This summer is shaping up to be a complete disaster for the climate mafia”
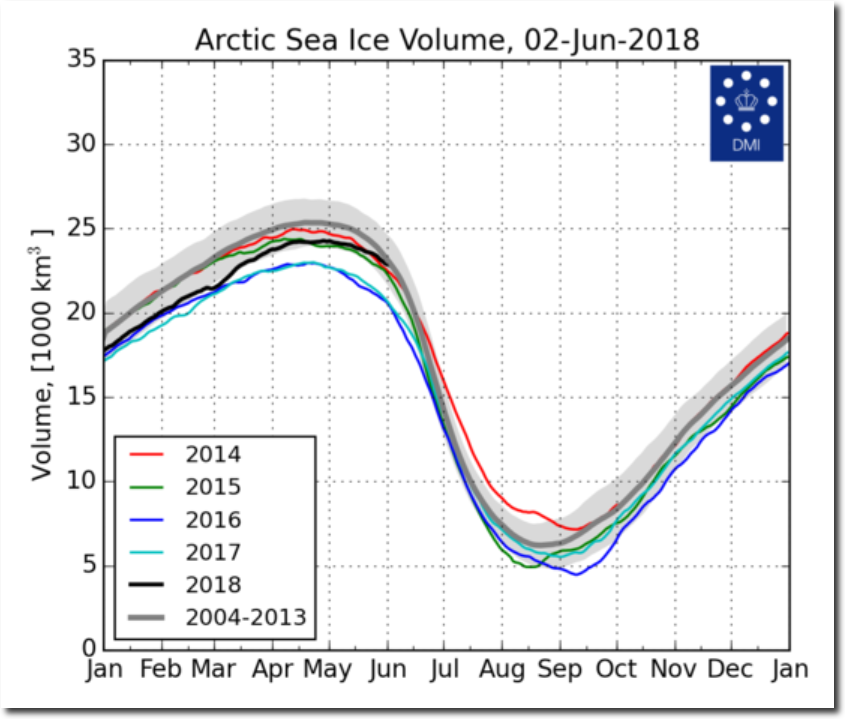
The summer is unfolding exactly as I expected. The ice is melting very slowly, sea ice volume is normal, and is the highest in five years. Volume is much higher than ten years ago and about the same as twelve years ago.
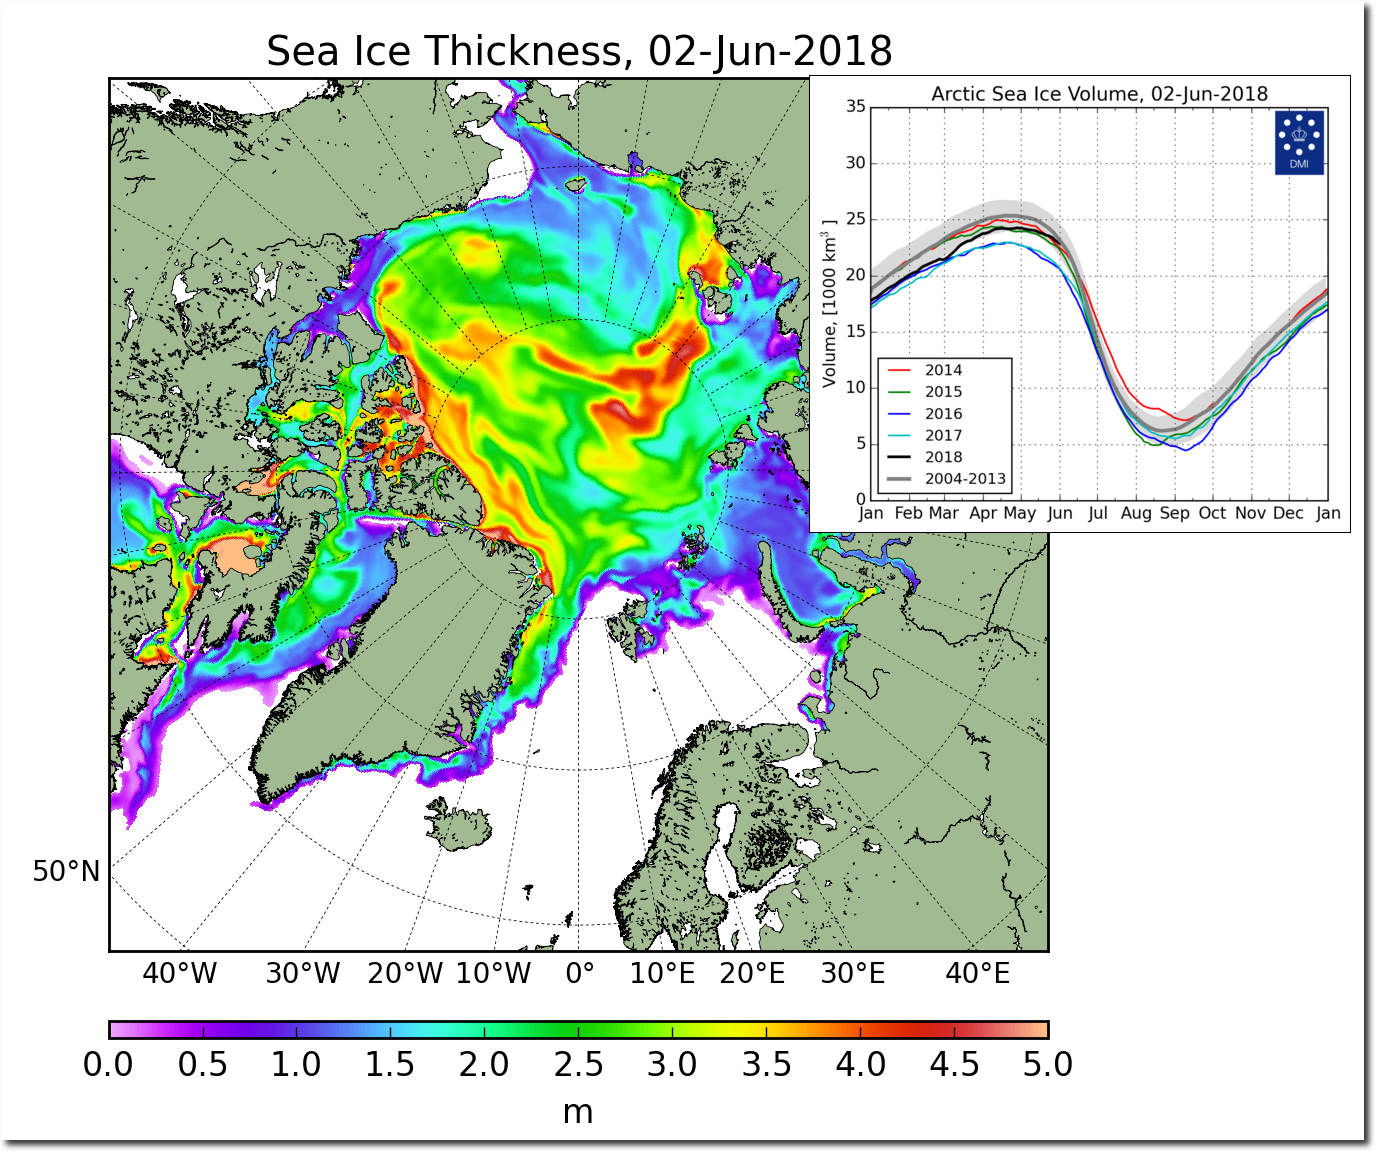
FullSize_CICE_combine_thick_SM_EN_20180602.png
The ice is much thicker than ten years ago across most of the Arctic.
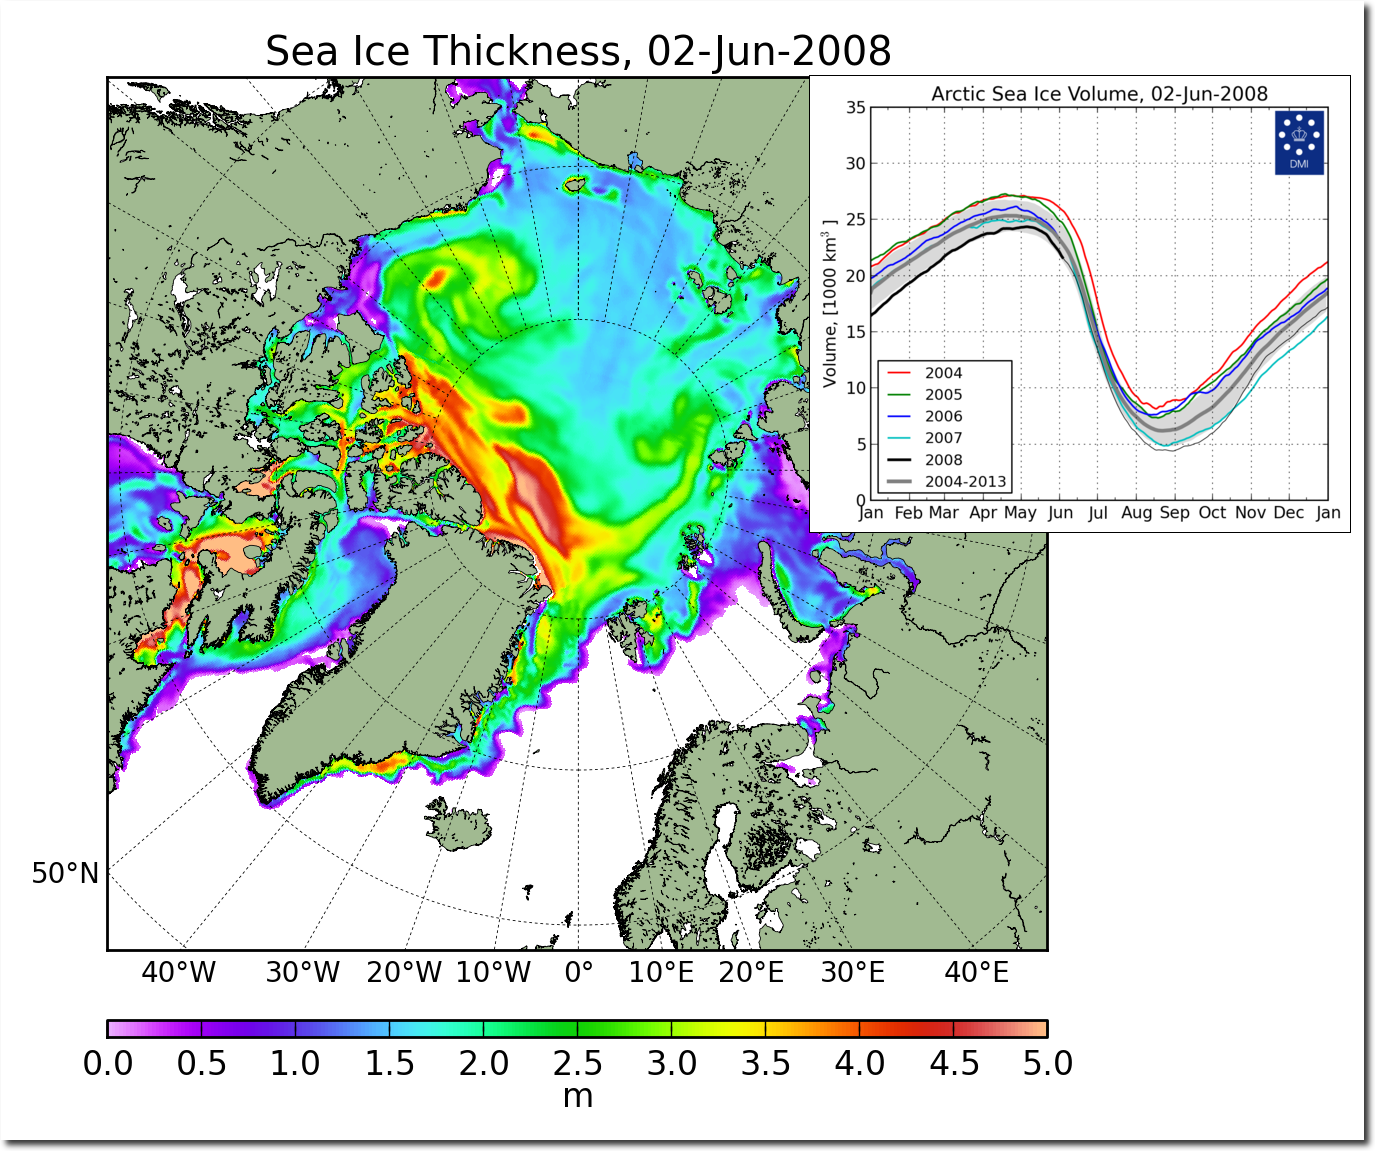
FullSize_CICE_combine_thick_SM_EN_20080602.png
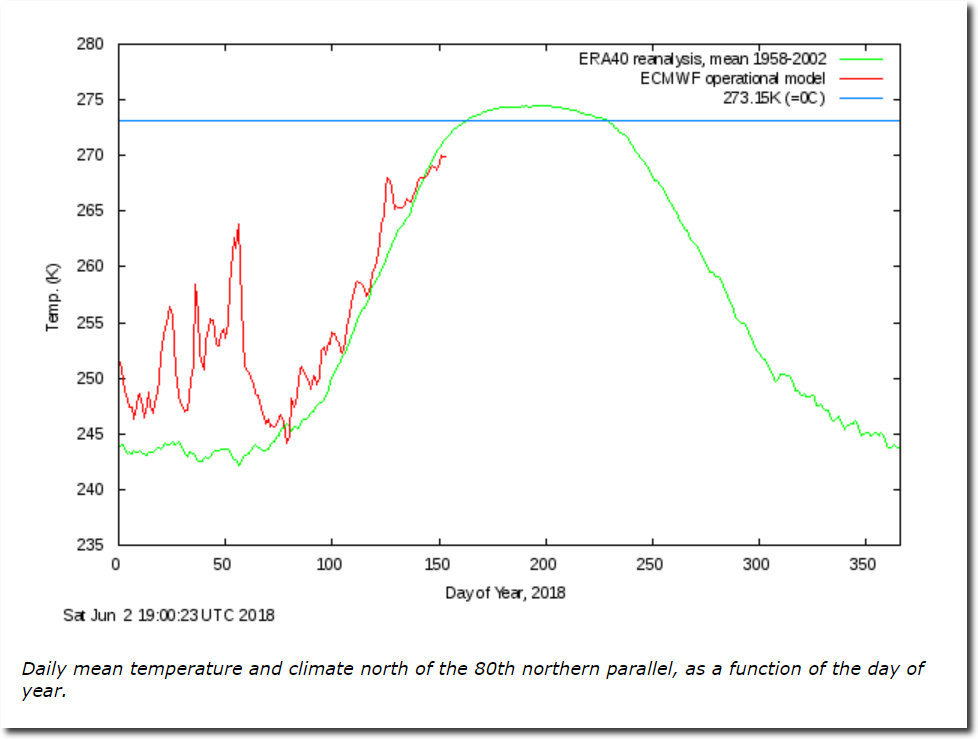
As with all recent summers, temperatures near the pole are very cold and below normal.
Ocean and Ice Services | Danmarks Meteorologiske Institut
This is what highly paid Arctic experts were saying ten years ago :
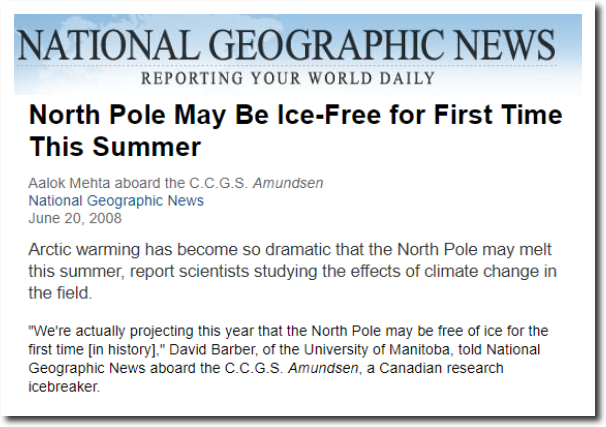
North Pole May Be Ice-Free for First Time This Summer
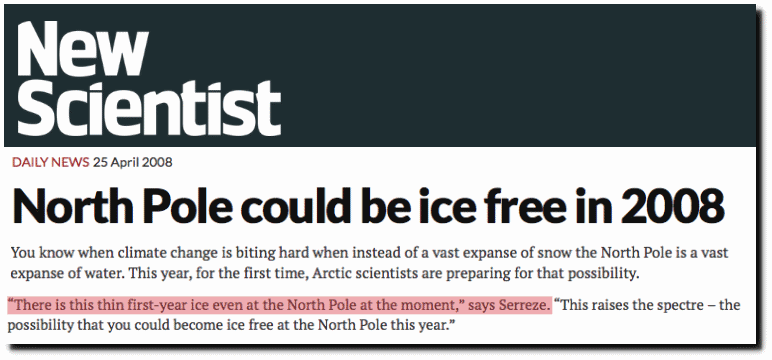
North Pole could be ice free in 2008 | New Scientist
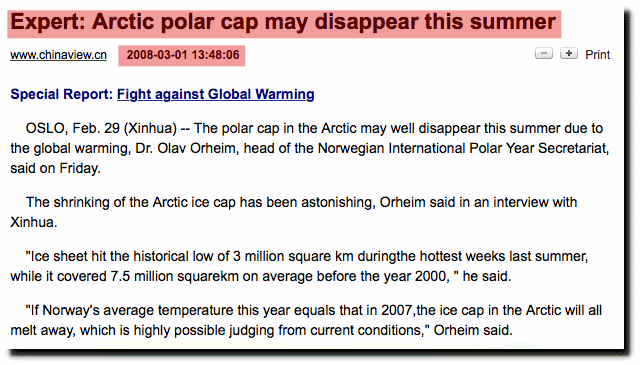
Expert: Arctic polar cap may disappear this summer_English_Xinhua
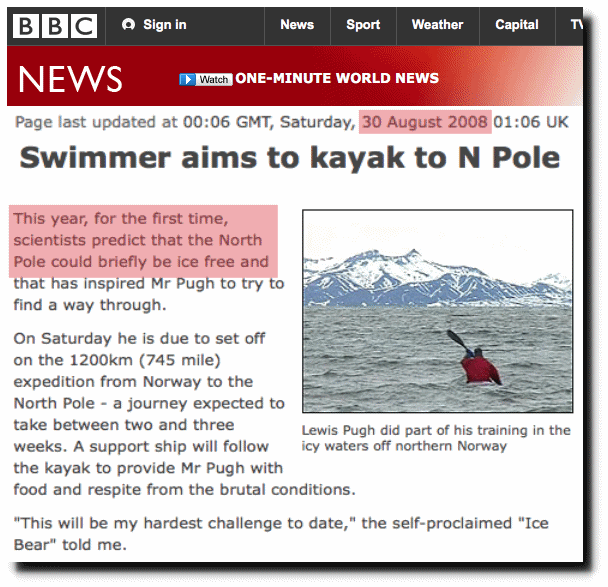
BBC NEWS | UK | Swimmer aims to kayak to N Pole
This is what I was saying ten years ago :
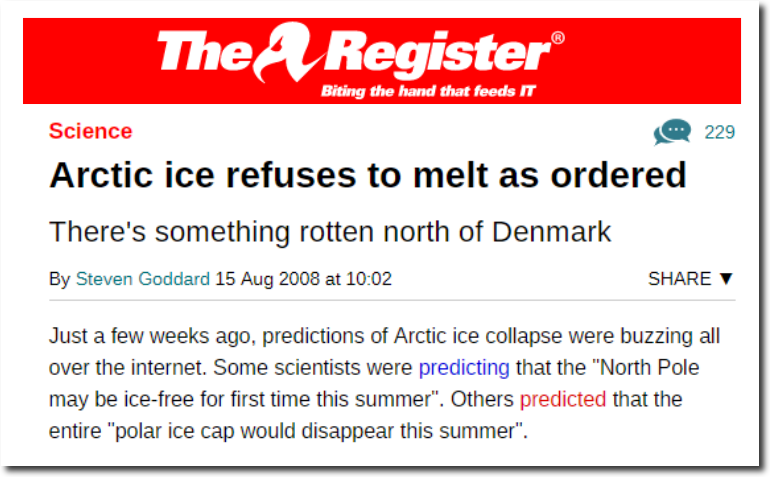
Arctic ice refuses to melt as ordered • The Register
Climate experts have shown zero skill or integrity, which is why they are so widely acclaimed by the political left, press and Democratic Party – who also have no skill or integrity. But fear not members of the climate religion – your prophet says the Arctic will be ice-free this summer.
DMI ice volume is now above ALL years back to , and including, 2008
Where is that data located?
Here, tony:
http://ocean.dmi.dk/arctic/icethickness/txt/IceVol.txt
2018 DMI ice volume now #6, at 100.62% of average of the 16 years, and 100.30% of the charted 2004-2013 period.
Thanks Steven.
We are both obviously tracking from the same data :-)
I concur with both your calcs .
Not far to go until it crosses over above 2006, 2007 as well.
AndyG55: I think so too.
2014 will be an interesting year for comparison. The slope of the decline that year was above The average, resulting in a very high minimum that year.
With the Arctic temperatures below average, it will be interesting to see where things go for the next several days.
Hey Steven, Tony, Calculate the “decrease from maximum” for each year in DMI vloume.
Very interesting !!
According to my calculations, post wine… ;-)
2018 is slowest decrease by far, apart from 2004
2004: 1.35
2018: 1.52
2007: 2.11
2009: 2.30
2015: 2.41
and they just keep climbing.
Someone want to check these, please.
Griff apparently found somewhere else to be. Good move, because it is most likely only going to get worse for her predictions of less ice this summer. Especially in the extent metric she likes to worry so much about.
I think/hope that he/she may be becoming disillusioned.
A tireless, disillusioned Griff type would be one of our greatest allies.
But but but….it’s all “new” ice according to AFI….Griff
(Arctic Fraud Index)
Seems someone secretly replaced overnight
the ice from the past years with new ice from this year.
That#s the only way multiyearice can disappear without a completely ice free arctic.
arn: responding to your last sentence, there’s a tremendous amount of multi your ice which gets pumped down the Eastside of Greenland each year. It’s one of the mechanisms the earth uses to keep ice from accumulating in the arctic
“Blowtorch” Reggie disappeared after his “blowtorch” failed to ignite and good riddance, that guy was a nutbar. On the other hand, I am in favour of Griff staying as she(?) is relatively polite, rational and and not too condescending.
In Griff’s mind the arctic is ice free so it has probably moved there.
The latest edition of Time Magazine has a 2017 photo of a polar bear swimming between ice floes as proof that there is no more ice up there. Help a denier explain that to my carbon tax loving friends and family. Are there not pictures of the ice I can show Them?
Susan, pollie beers hunt around the edge of the sea ice.. that is where the seals are.
Pollie beers are also exceptionally good swimmers.
So pictures of them swimming between ice floes are totally meaningless as proof for “no more sea ice”, that is their natural hunting area.
You want a picture of ice and snow, here is one from 15-21st May
Thanks!
Susan
I think that this Arctic temperature above 80 deg. N latitude graph may be of some help to you despite the metric being in Kelvin.
The blue line is freezing or 32 deg Fahrenheit = 273.15 Kelvin.
The green line is the 1958 to 2000 mean.
The red line the current temp in K (kelvin)
http://ocean.dmi.dk/arctic/meant80n.uk.php
The point being just how much melting do they think is going on when the air temperature is below freezing?
On the left you will see where you can look at past years. Clicking on the recent years of the past will show that the Arctic air temperature, while higher than the mean during the winter months has been running at or lower than the mean during the summer months which is when the melting occurs.
Facts about the abilities of Polar bears to swim vast distances.
https://polarbearfacts.net/how-fast-can-polar-bear-swim/
Their fur is made up of hollow tubes that in fact makes them the equivalent of a life vest, they float.
“Scientists recorded the maximum time ever taken by a polar bear were 9 days. A female bear swam for about 9 days (or 216 hours) in the Bering Sea without resting”
Scientists recorded the maximum time ever taken by a polar bear were 9 days. A female bear swam for about 9 days (or 216 hours) in the Bering Sea without resting.
According to his web page, Lewis Pugh is an “ocean advocate” and inspirational speaker who swam to (or at) the North Pole. Doesn’t say anything about the kayak trip that I could see. Looks like saving the ocean from plastic is the new goal, now that the global warming hysteria is waning.
That’s because he would rather others forget the miserable failure of that attempt. But I’m sure he will never forget it because he literally almost froze his ass off. He only got 138 k before he had to quit. Said the ice was blocking the remaining 1,000 k to the pole. So he planted flags on ice over 600 miles from the pole to emphasize how it was melting.
Wish we could jump forward to being told all the multi-year ice has vanished.