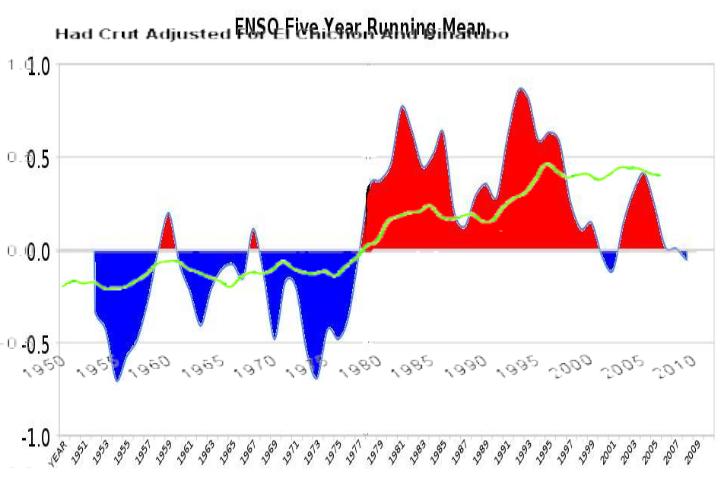
Reader “J” suggested that I try out HadCrut with volcanic adjustments. I used Dr. Hansen’s paper about volcanic effects as a guideline for the eruptions of El Chichón and Pinatubo. The green line above is the five year running mean of HadCrut (adjusted for volcanoes from 0-5 years after the eruption) and the red/blue is the five year running mean of ENSO.
Disrupting the Borg is expensive and time consuming!
Google Search
-
Recent Posts
- Gaslighting 1924
- “Why Do You Resist?”
- Climate Attribution Model
- Fact Checking NASA
- Fact Checking Grok
- Fact Checking The New York Times
- New Visitech Features
- Ice-Free Arctic By 2014
- Debt-Free US Treasury Forecast
- Analyzing Big City Crime (Part 2)
- Analyzing Big City Crime
- UK Migration Caused By Global Warming
- Climate Attribution In Greece
- “Brown: ’50 days to save world'”
- The Catastrophic Influence of Bovine Methane Emissions on Extraterrestrial Climate Patterns
- Posting On X
- Seventeen Years Of Fun
- The Importance Of Good Tools
- Temperature Shifts At Blue Hill, MA
- CO2²
- Time Of Observation Bias
- Climate Scamming For Profit
- Climate Scamming For Profit
- Back To The Future
- “records going back to 1961”
Recent Comments
- Bob G on Gaslighting 1924
- Bob G on Gaslighting 1924
- conrad ziefle on Gaslighting 1924
- Bob G on Gaslighting 1924
- Bob G on Gaslighting 1924
- arn on Gaslighting 1924
- conrad ziefle on Gaslighting 1924
- Gordon Vigurs on Gaslighting 1924
- conrad ziefle on Gaslighting 1924
- Robertvd on Gaslighting 1924


Volcanoes have only been minor disruptions in natural ocean atmosphere long term weather patterns, Climate, that last for at most a few years. If the timing is right a major volcano event could tip the patterns a bit sooner than would have happened naturally but over the millennial scale the patterns seem to restore their rhythm. The information is to course going back more than a few million years to determine if a longer term pattern also exists over and above the current Glacial/ Interglacial pattern we are experiencing.
Thank you Steve.
My own plot with AMO and PDO, used a detrend on HadCRUT:
http://img253.imageshack.us/img253/4108/amopdo.jpg
Only thing worth explaining, seems to be the quite monotonic 0.72K/century trend seen on residuals which isnt alarming at all imo. A lot of it could be attributed on a longer cycle or period, returning from the LIA, errors, etc.
Also what is seen from the PDO and AMO that there is a 1.1C difference between the maximums and minimums. That counts as 6W/m2 on the surface radiation, might have a quess how that extra 6W/m2 is explained in the climate models (propably as a feedback while it has nothing to do with it).
Volcanoes indeed have a small impact on a longer scale but the point doing the adjustment is to visualize why Tsurf doesnt seem to correlate very well with AMO and PDO in the 80’s and 90’s. Without those we would have seen a rapid rise in the beginning of 80’s following almost a flat trend ever since.
The adjustment is not very necessary though, you can see the close correlation even without it, if you just remember it.