Your team is losing the game with five minutes to play, and no hope in sight. How do you win?
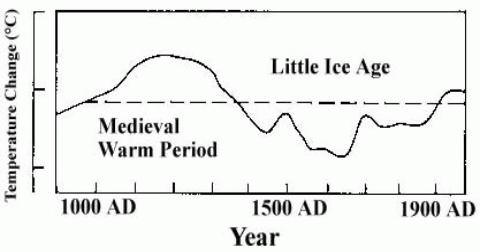
The graph above was the IPCC view of the world in 1990. Nothing scary there, and that simply needed more research to get sorted out properly.
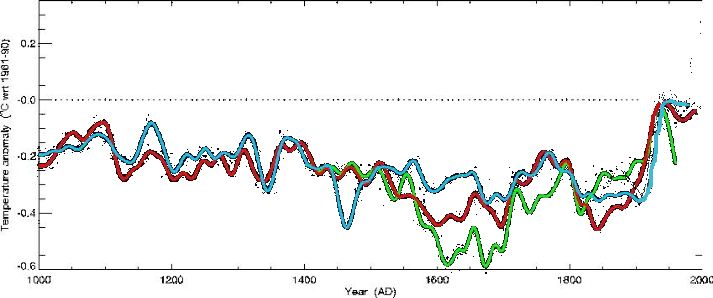
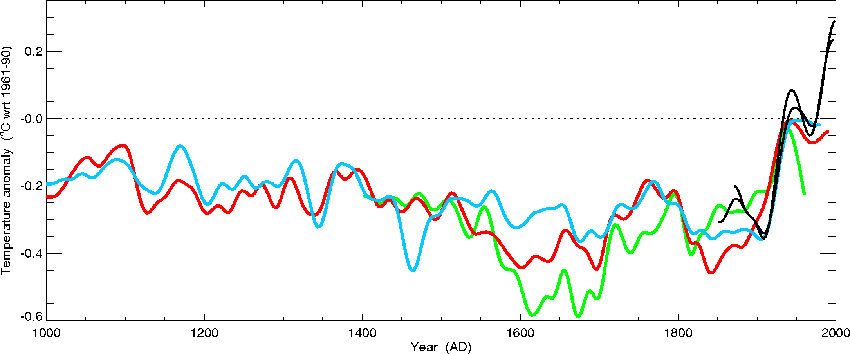
So their careful studies killed off that nasty MWP, and started to build the hockey stick using temperature proxies. Temperature proxy studies commonly use tree rings to measure past temperatures. This method worked really well until the trees apparently went on strike in 1960. Briffa in green, Jones in red, and Mann in blue.
The MWP had disappeared, but they still had a problem. They had to do something about that inexplicable “decline” in temperatures after 1960.
One of the three temperature reconstructions was based entirely on a particular set of tree-ring data that shows a strong correlation with temperature from the 19th century through to the mid-20th century, but does not show a realistic trend of temperature after 1960. This is well known and is called the ‘decline’ or ‘divergence’. The use of the term ‘hiding the decline’ was in an email written in haste. CRU has not sought to hide the decline. Indeed, CRU has published a number of articles that both illustrate, and discuss the implications of, this recent tree-ring decline, including the article that is listed in the legend of the WMO Statement figure. It is because of this trend in these tree-ring data that we know does not represent temperature change that I only show this series up to 1960 in the WMO Statement.
http://www.americanthinker.com/2009/12/understanding_climategates_hid.html
Those wicked trees just started misbehaving after 1960. After doing a fine job for a thousand years, the trees apparently just said enough is enough – “we are not going to cooperate any more.”
At that point, the only sensible approach was to throw away the tree’s deviant data. In order to compensate for the tree’s bad behaviour, Mike had to come up with a “nature trick.” So they shot the trees in the head, and turned the post 1960 temperatures over to the reliable folks who do the thermometer adjustments. And there you have it – the hockey stick!
http://www.americanthinker.com
In less than 20 years, the IPCC rewrote most of the climate history of the modern world, going from this :
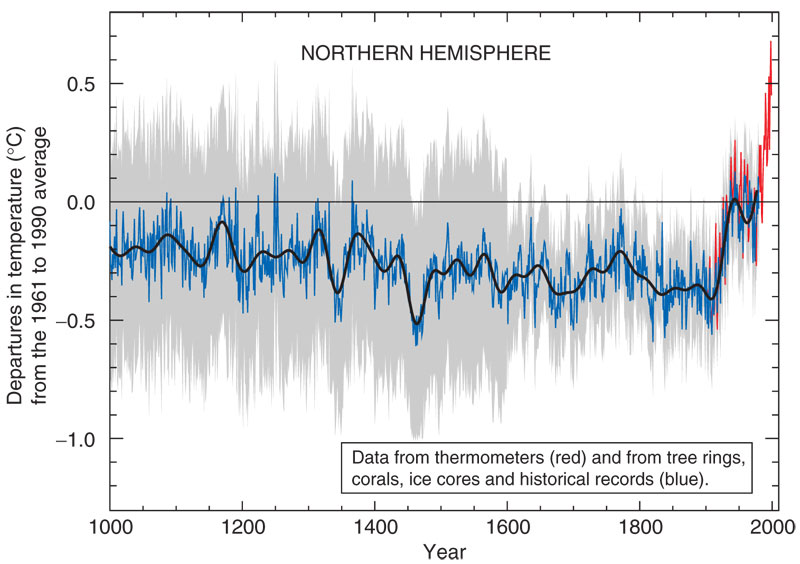
to this.
Sometimes, all you need to win is a new hockey stick!
Now, aren’t you glad that engineers don’t throw away inconvenient data when they build bridges?


I’d really like to see the last chart with the satellite record separated from the thermometer record. And the thermometer record’s adjustments heavily audited before splicing.
Hmmm … one set of tree ring data that declines from 1960 whilst thermometers, satellites, sediment core samples and other tree ring data measure an incline.
Why would you trust the one set of tree ring data over everything else.
And if the MWP was global in extent, and warmer than today, that means our climate is really very sensitive to radiative forcings.
Was that peer reviewed?
Why would you trust the one set of tree ring data over everything else.
The global warming believers trust it. Is that what you meant?
How come they say the “Medieval warming” was “Localized”. But it’s ok to use a tree ring in one spot??? Maybe that tree ring temperature is “localized too”?
Why would you trust the one set of tree ring data over everything else.
What was this question suppose to mean Brendon?
They all decline – by different amounts.
Nice guess but you are wrong.
http://www.ldeo.columbia.edu/res/fac/trl/downloads/Publications/%20cook2004.pdf
Brendon
I just looked at the graph again—they all decline. I added arrows to make it easier to see:
http://img580.imageshack.us/img580/7141/decline.jpg
Why did you say they don’t? Where you talking about proxies that aren’t even in the post? If so, why?
The thermometer temps at the time were declining. The Northern tree ring data declines further whereas the Southern tree ring data supports thermometer records.
Brendon says:
October 21, 2010 at 12:21 am
Hmmm … one set of tree ring data that declines from 1960 whilst thermometers, satellites, sediment core samples and other tree ring data measure an incline.
Why would you trust the one set of tree ring data over everything else.
What do those proxies you bring up show in regards to the Medieval Warm Period?
Do satellite and thermometers go back as far as the Hockey Stick proxy? Do you understand why that is an important question?
Brendon says:
October 21, 2010 at 12:21 am
Hmmm … one set of tree ring data that declines from 1960 whilst thermometers, satellites, sediment core samples and other tree ring data measure an incline.
Why would you trust the one set of tree ring data over everything else.
That would be a question for the IPCC and Michael Mann, wouldn’t it?
Didn’t they say that CO2 was bad for trees, so actually they were growing more but the CO2 went up so they cut down. So essentially the previous temperature was lower because the trees should have grown more but were restricted by that toxic gas CO2 and couldn’t grow properly since trees prefer to use O2 instead like humans…
“Why would you trust the one set of tree ring data over everything else.”
Ask “The Team” why they placed so much trust on the data. Let us know if you get an answer from them.
….using temperature proxies….
They also used proxies to hide the incline in solar activity after 1975.
James Cameron – HYPOCRITE
http://www.youtube.com/watch?v=TKZ4RolQxec
Gee I need to cut down my things, I have 30 motorcycles and a few yachts and 8 mansions I might need to cut down to James’s levels so I can save the planet with him.
Covering up the truth
Who’s in Climate Denial Again? The New York Times
With all due respect but we have no intentions to surrender to a fraud.
http://somewhatreasonable.com/2010/10/whos-in-climate-denial-again-the-new-york-times/
http://climate.nasa.gov/ClimateTimeMachine/climateTimeMachine.cfm
Check out NASA’s “Time Machine” using the hockey stick to make a map of the world since 1880
Also check out the effects of a 6m ice melt (the whole of Greenland melting) will that be happening next week or next month or in 4560?
Or, never?
Yep never I don’t think Greenland has ever been ice free or ever will unless continetial drift moves it to the equator
A handy map at JoNova
http://joannenova.com.au/2009/12/fraudulent-hockey-sticks-and-hidden-data/
adapted from CO2Science
http://www.co2science.org/data/timemap/mwpmap.html
CO2Science (run by Idso using Exxon funds) changes the timeframe defining the MWP in order to claim the warming in the data.
For one paper they will say the MWP as 1000-1300 AD, for another paper they say it is centered 1300 AD and in both cases they avoid the lower parts of the temp.
The papers they look at may be good science, but the way CO2Science perform analysis on those papers is absolute rubbish.
And if the MWP was warmer than today, that also means the climate is more sensitive to radiative forcing.
http://www.skepticalscience.com/Do-critics-of-the-hockey-stick-realise-what-theyre-arguing-for.html
Do you ever put gas in your car, or use any other form of energy?
Can you name anyone alive that does not use a “form of energy”?
Oh, this has been pointed out to Jo Nova several times.
She ignores the comments and continues to promote CO2Science fully aware that their analysis method is flawed.
Links here for the two papers I mention in the above post.
http://pages.science-skeptical.de/MWP/Sicre-2008.html – CO@S define the MWP defined as the 1000-1200 section. looking at the accepted period 950-1200 shows that for most of the time it is no warmer than today.
http://pages.science-skeptical.de/MWP/Paulsen-2003.html – they shift the MWP closer to the warm patch in the data, yet even then the CWP is warmer.
Have you ever thought how bad your life would suck without oil companies?
Is that why you post Steve?
That comment is so ridiculous on so many levels…
Steve how do you know that their lives don’t suck even with the oil based products that they rely on to live and blather on your blog (I doubt their computers are made of 100% hemp)? If they really wanted to save the planet they should be trying to throw pies in Al Gore’s face as his carbon foot print alone must have already led to the death of thousands of humans and Polar bears. lol
Unless you grow your own food and have your own clean water supply, you aren’t going to last very long without oil companies.
Brendon,
Why not read the published articles and refute them directly instead of generalizing and applying logical fallacy?
There are many more recent studies supporting the MWP being similar to or warmer than CWP.
C3 collates some of them here:
http://www.c3headlines.com/climate-history/
How was the graph at the top of the article constructed? I have a book on the Lost Villages of Britain, and the graph appears in the chapter which deals with the beginning of the LIA, with the consequent drop in agricultural output, and the abandonment of villages on land which rapidly became marginal. The author attributed it to M.L.Parry, but didn’t give any more reference than that. However the said M.L.Parry looks like an enthusiastic warmist – this is an extract of his career, from his website:
Professor Parry is Visiting Professor at The Centre for Environmental Policy, Imperial College London, and also Visiting Research Fellow at The Grantham Institute at the same university. Until September 2008 he was Co-Chair of Working Group II (Impacts, Adaptation and Vulnerability), of the Intergovernmental xPanel on Climate Change (IPCC) based at the Hadley Centre for Climate Prediction and Research, U.K. Meteorological Office. Previously he was Director of the Jackson Environment Institute (JEI), and Professor of Environmental Science at the University of East Anglia (1999-2002).
Can anybody throw any light on this?
That was the IPCC graph before they adopted the hockey stick.