Disrupting the Borg is expensive and time consuming!
Google Search
-
Recent Posts
- Gaslighting 1924
- “Why Do You Resist?”
- Climate Attribution Model
- Fact Checking NASA
- Fact Checking Grok
- Fact Checking The New York Times
- New Visitech Features
- Ice-Free Arctic By 2014
- Debt-Free US Treasury Forecast
- Analyzing Big City Crime (Part 2)
- Analyzing Big City Crime
- UK Migration Caused By Global Warming
- Climate Attribution In Greece
- “Brown: ’50 days to save world'”
- The Catastrophic Influence of Bovine Methane Emissions on Extraterrestrial Climate Patterns
- Posting On X
- Seventeen Years Of Fun
- The Importance Of Good Tools
- Temperature Shifts At Blue Hill, MA
- CO2²
- Time Of Observation Bias
- Climate Scamming For Profit
- Climate Scamming For Profit
- Back To The Future
- “records going back to 1961”
Recent Comments
- Bob G on Gaslighting 1924
- Bob G on Gaslighting 1924
- conrad ziefle on Gaslighting 1924
- Bob G on Gaslighting 1924
- Bob G on Gaslighting 1924
- arn on Gaslighting 1924
- conrad ziefle on Gaslighting 1924
- Gordon Vigurs on Gaslighting 1924
- conrad ziefle on Gaslighting 1924
- Robertvd on Gaslighting 1924
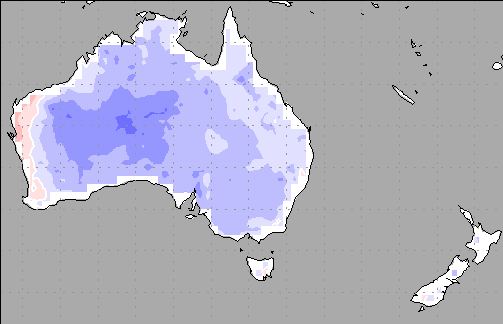
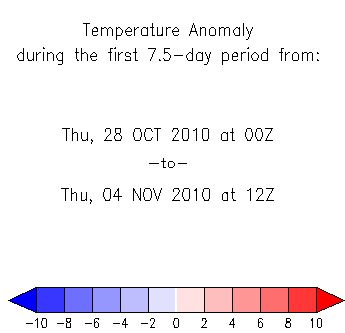
Hottest Year Ever : Australia Continues To Bake
This entry was posted in Uncategorized. Bookmark the permalink.


WOW. Could cherry pick a shorter amount of time if you tried.
(Rhetorical question in case you didn’t guess)
Got to admit its funny.
October has been pretty cool. ABC News weatherperson said it was above average only 3 days in whole of October so far (this was on Tuesday night). La Nina plus the IOD have been dumping rain on us in bucket loads.
Meanwhile about $10b worth of “we must drought-proof the country” useless desal plants are sitting idle. At least I hope they are.
Funny? In a tragic kind of way.
Lucky he didn’t cherry pick yesterday, it had plenty of warming anomaly.
Funny Brendon should bring up WA. JoNova has something to say about that area.
Have a read:
http://joannenova.com.au/2010/10/bom-giss-have-record-setting-bugs-affecting-a-million-square-miles/
Fun reading.
Funny, but not surprising, that Jo, the “would-be” scientist, made several embarrassing mistakes too – post 36.
Please reply to the issue that Steve raised, instead of changing the subject.
Please reply to the issue that Steve raised, instead of changing the subject.
I assume you’re talking to steve384, not Brendon, since his first two comments were directly on topic and the third was a response to steve 384.
Here we go ChrisD and Brendon the would-be-twats. Actually not would-be, you are twats. Experts on Australia now? What part are you from? The cold and rain ravaged east, where the drought has ended and dams over 100% full. Or the west where we broke records for cold nights. Quoting BOM, you might as well quote Gore. You 2 must have sad lives to troll sites you clearly disagree with.
Shockingly, you don’t actually have to be an expert on Australia to know that regional weather over a one-week period has no more to say about global climate than today’s temperature on Aldebaran does.
Sorry if this confuses you.
From comment #42
check out
http://kenskingdom.wordpress.com/2010/09/14/the-australian-temperature-re cord-part-9-an-urban-myth/
and check out the link to part 8,
his conclusion:
One thing we do know:- the High Quality data does NOT give an accurate record of urban Australian temperatures over the last 100 years. BOM’s reconstruction of the temperature record is at best a guess. High Quality is an urban myth.
Conclusion
This study shows a number of problems with the Australian High Quality Temperature Sites network, on which the official temperature analyses are based. Problems with the High Quality data include:
» It has been subjectively and manually adjusted.
» The methodology used is not uniformly followed, or else is not as described.
» Urban sites, sites with poor comparative data, and sites with short records have been included.
» Large quantities of data are not available, and have been filled in with estimates.
» The adjustments are not equally positive and negative, and have produced a major impact on the Australian temperature record.
» The adjustments produce a trend in mean temperatures that is roughly a quarter of a degree Celsius greater than the raw data does.
» The warming bias in the temperature trend is over 40%, and in the anomaly trend is 50%.
» The trend published by BOM is 66.67% greater than that of the raw data.
You’re the one confused in thinking anyone would be impressed with your “Aldebaran” quote. It merely proves you are a sad twat (I note you didn’t argue that point – how could you) and confirms you’re just some pathetic geek virgin. Some advice, turn the computer off, go outside and get some fresh air, it might do your acne some good.
you’re just some pathetic geek virgin
This information is really going to surprise my wife. And my teenage kids, as well.
Hey, Steve, is this really the kind of blog you want?
WOW! Any shorter and the FORECAST for the NEXT WEEK might be more accurate.
Its becoming a joke really…last year we had 31 in Melbourne by Sept 12…and this coming week we had a heatwave of low 30s for about 8 days IIRC…this year has been polar opposite, pun intended.
Funnily enough, last night (27/10), Melbourne minimum dropped to 10.2 degrees, whilst Laverton 15kms away was a balmy 2.4 degrees. And every other station in Melbourne was under 4.6 degrees. Of course the BOM think that this is fine, as you would when you are sprouting forth the propaganda that it will never rain again..
Coca-Cola Amatil sales flat due to cold, wet weather
Unseasonably cold and wet weather has affected sales of soft drinks in Australia and New Zealand
http://beveragemanager.net/Article-Single-News.176.0.html?&tx_ttnews%5Btt_news%5D=3681&tx_ttnews%5BbackPid%5D=118&cHash=5a1ff17ba8
just having fun
More white and blue
http://wxmaps.org/pix/temp3.html
http://wxmaps.org/pix/temp6.html
http://wxmaps.org/pix/temp8.html
http://wxmaps.org/pix/temp11.html
In the context of nose-diving global tropospheric temps as reported by the Univ. Alabama satellite data, long predicted as a consequence of the abnormally strong La Nina and falling OHC, give it some time, this anomaly will likely persist for much more than one week.
http://discover.itsc.uah.edu/amsutemps/data/amsu_daily_85N85S_ch05.r002.txt
In the coming months it might be good advice for AGW trolls to spend more time with their wives and children.
Suggestion: Bone up on what “troll” actually means. It’s pretty specific.
What it does not mean is, “Anyone who disagrees with me.”
I agree that you aren’t trolls. Apologists or acolytes, yes, trolls, no. Glad we agree on something.
You’re so right Chris. I’ve run into this often. You present an opposing viewpoint and people start screaming, “Troll!” And then after that they usually use the terms, “Apologist or acolyte.” That’s usually an indication of when they are at a loss of anything else to say.
Yup. The denizens here are particularly egregious. Anything they don’t like is trolling, spamming, or off-point.
Main problem is a displayed inability to assimilate new information.
yes i thank the BOM.
The smoking gun at darwin zero woke me up to the warmist shenanigans.
before that and cimategate i was a lukewarmist.