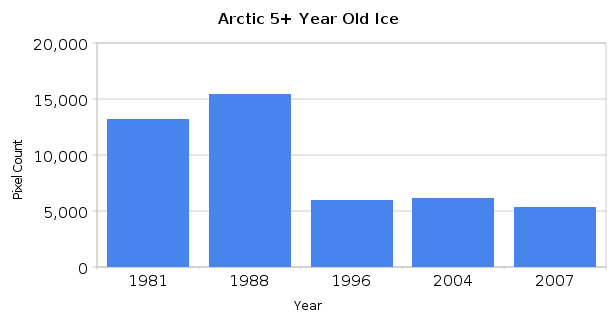
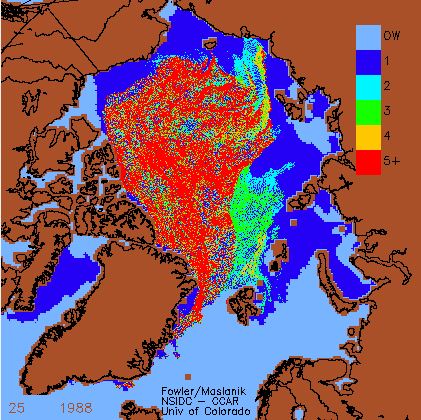
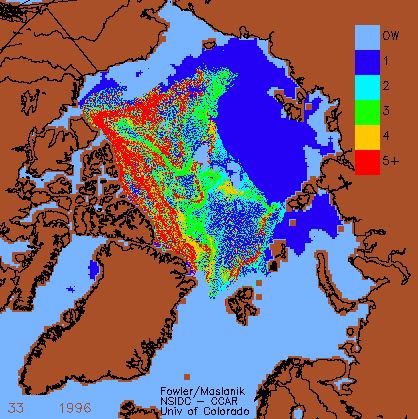
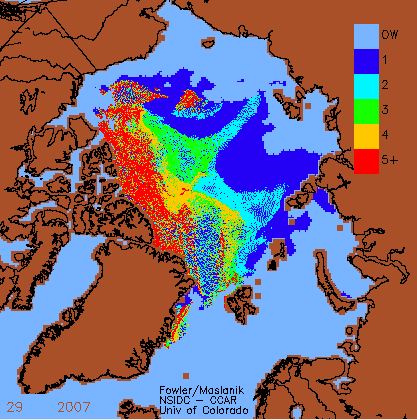
We have had a lot of discussion recently about the loss of 5+ year old ice in the Arctic. Most of the older ice loss occurred between 1988 and 1996 – during a period of normal global temperatures.
From http://nsidc.org/arcticseaicenews/2007.html
There was very little older ice loss between 1996 and the end of the “record 2007 melt season”
http://www.woodfortrees.org/plot/uah/from:1988/to:1996/plot/uah/from:1988/to:1996/trend
Conclusion : There is a story here, but it is not the one people are chasing after. 2007 is not the story. What happened between 1988 and 1996?
[youtube=http://www.youtube.com/watch?v=tIuHBPjElHI]


The story is that the Arctic Sea Ice is subject to natural cycles and there is nothing we can do about it.
Given what I am seeing with La Ninas that seem progressively stronger and more like
ah, the last cold PDO shift (1950-1977/78) I agree with Bastardi’s “Two steps forward,
one step back” in regard to ice redevelopment..
“Average January sea ice thickness increased during 1982-88 in most regions of the Arctic (+7.6 ± 0.9 cm yr-1), decreased through 1996 Arctic-wide (-6.1 ± 1.2 cm yr-1), then modestly increased through 2003 mostly in the central Arctic (+2.1 ± 0.6 cm yr-1).”
Belchansky 2008 http://cat.inist.fr/?aModele=afficheN&cpsidt=20140434
Tshudi 2010 (http://soa.arcus.org/sites/soa.arcus.org/files/sessions/2-1-observations-arctic-change/pdf/2-1-3-tschudi-mark.pdf) shows the drop in overall multiyear ice in the first half of the 90`s. And a new drop since 2005:
http://diablobanquisa.files.wordpress.com/2010/06/arctic_ice_volume-e1275496035553.jpg?w=640
From 2005 to 2008 a 40% drop in the overall MYI area in the arctic.
http://diablobanquisa.files.wordpress.com/2010/06/declaine_in_arctic_ocean_multiyear_sea_ice_coverage324873main_kwokfig4_full_610x470-e1275496629836.jpg
The extent of MYI will triple over the next few weeks.
What happened between 1988 and 1996?
A sharp shift in the AO/NAO index, from the negative to the positive state.
http://diablobanquisa.files.wordpress.com/2010/03/climate-ao-e1268153207959.png
This may go to show how unimportant 5+ year ice is in the scheme of things, as 1996 was the fifth highest minimum on record according to CT’s area numbers (at 5238185 km^2, only 1979, 1980, 1986, and 1987 were higher).
-Scott
And the highest september monthly mean sea ice extent according NSIDC.