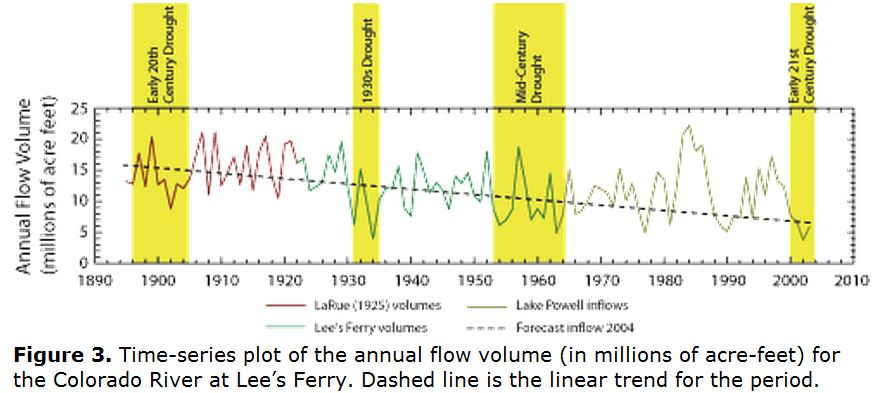
http://pubs.usgs.gov/fs/2004/3062/#fig3
The linear trend has become the scourge of climate science. We see linear trend lines drawn through every imaginable non-linear behaviour, and the graph above is a classic example. The trend line shows that Colorado River water flow has been decreasing steadily over the last 120 years. Must be due to climate change. Not!
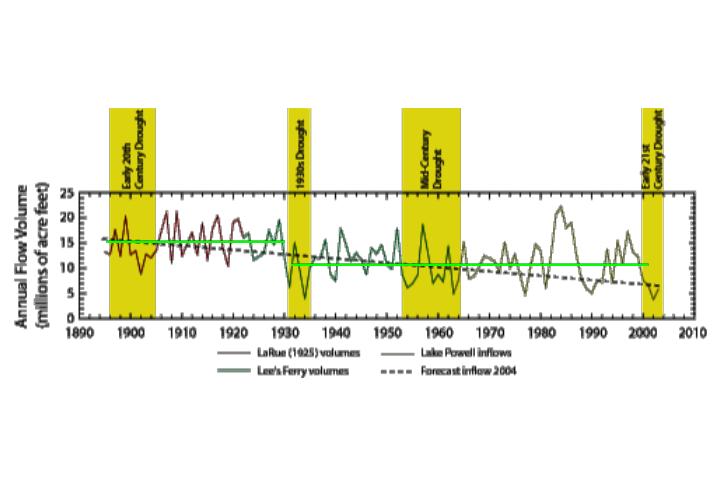
I drew two green lines on the graph (below) to show what is really happening. There was a step change in the 1930s. Was it due to a climate shift?
No. In the 1930s they dug huge tunnels through the Continental Divide and started diverting Colorado River water to Denver and Front Range farms. This dramatically lowered the volume of water reaching Arizona.
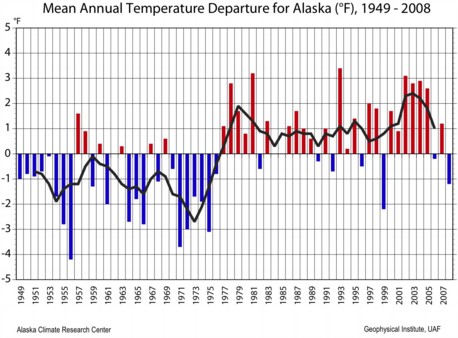
We see the abuse of linear trends all the time. Another famous step function is Alaska temperature anomalies. The PDO shift in 1977 bumped Alaska temperatures up by several degrees.
http://climate.gi.alaska.edu/ClimTrends/
The obvious nature of this shift makes no difference to reporters – who constantly misrepresent the nature of climate.
Alaska has emerged as the poster state for global warming, the climate effect attributed to higher concentrations of “greenhouse” gases — mostly carbon dioxide created by burning fossil fuels — that capture the sun’s heat in the atmosphere.


I think another big one is supposed stratospheric cooling. There were step changes following large volcanic eruptions (to my knowledge, the mechanism for that is unknown). Aside from those step changes, there really isn’t any trend at all.
I’ve looked at that subject very little – is the above (still) a valid statement?
-Scott