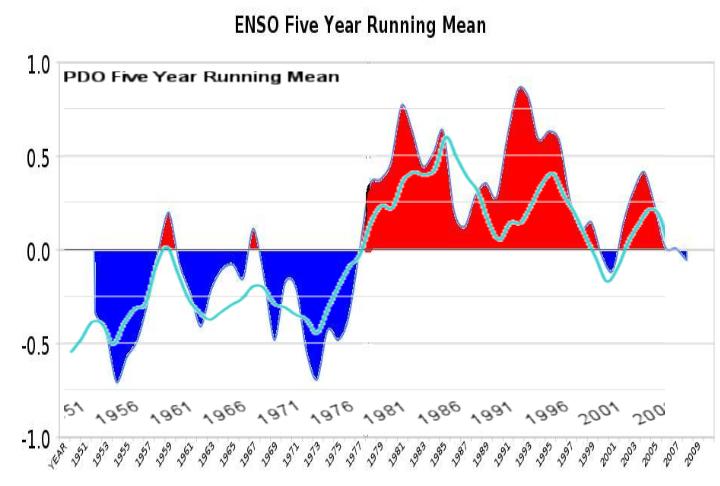
The graph above plots the five year running mean of the PDO (turquoise line) on top of the five year running mean ENSO (red and blue.) When the PDO is negative, La Niña dominates. When the PDO is positive, El Niño dominates.
Disrupting the Borg is expensive and time consuming!
Google Search
-
Recent Posts
- “Why Do You Resist?”
- Climate Attribution Model
- Fact Checking NASA
- Fact Checking Grok
- Fact Checking The New York Times
- New Visitech Features
- Ice-Free Arctic By 2014
- Debt-Free US Treasury Forecast
- Analyzing Big City Crime (Part 2)
- Analyzing Big City Crime
- UK Migration Caused By Global Warming
- Climate Attribution In Greece
- “Brown: ’50 days to save world'”
- The Catastrophic Influence of Bovine Methane Emissions on Extraterrestrial Climate Patterns
- Posting On X
- Seventeen Years Of Fun
- The Importance Of Good Tools
- Temperature Shifts At Blue Hill, MA
- CO2²
- Time Of Observation Bias
- Climate Scamming For Profit
- Climate Scamming For Profit
- Back To The Future
- “records going back to 1961”
- Analyzing Rainfall At Asheville
Recent Comments
- arn on Climate Attribution Model
- arn on Climate Attribution Model
- Gordon Vigurs on Climate Attribution Model
- Bob G on Climate Attribution Model
- Bob G on Climate Attribution Model
- Bob G on Climate Attribution Model
- arn on Climate Attribution Model
- Bob G on Climate Attribution Model
- Bob G on Climate Attribution Model
- Bob G on Climate Attribution Model


So what controls the PDO?
Probably not CO2, since it has gone negative again.
I know. But when morons at ReallyWrong Climate go on record as saying the PDO will never go negative again (due to CO2) it makes you want to slap someone…
MattN
Correction: Surrealclimate
Surreal:
From Dictionary dot com
1.
of, pertaining to, or characteristic of surrealism; surrealistic.
2.
having the disorienting, hallucinatory quality of a dream; unreal; fantastic: surreal complexities of the bureaucracy
I think that describes the site very well!
What controls the PDO?
Natural weather patterns that have been shifting since the globe has had weather. The shifting continental plates have contributed to the current pattern that began when the Isthmus closed the gap between the younger Atlantic and older Pacific oceans. The Pacific Ocean shrinking also plays a part in the ocean currents. In about 5 to 10 thousand years when Baringia is above sea level, due to ice accumulation on Antarctica and the Pacific can not longer drain through the Arctic the Arctic will remain covered with ice year round and the Laurentide Ice sheet will reform over the following 80 thousand years.
The PDO and ENSO are only outward displays of regional weather patterns as is the SOI in the Pacific. Just like any relationship, sometimes they are compatible to strengthen each other and sometimes the are in opposition and restrict each other.
Just try a different mix of PDO, ENSO and AMO in your calculations and compare it with temperature changes since 1900 detrended. You will see the positive phase of those indexes contributed more than 60% on the warming since 1975…
J:
Long term natural weather variations are the overall driver. The oscillations you mention along with others are outward displays of the natural variations in ocean atmosphere circulation patterns. Asking the cause is like trying to determine what came first, The Chicken or the egg. Action and reaction which then becomes the driver for the next reaction. I have heard that a 1% change in global cloud cover can result in a 2C change in global temperature over time. Was it the temperature change that changed the cloud cover or the change in cloud cover that changed the temperature. Maybe a combination of both driven by an outside force such as a minor change in energy from the sun or a massive Volcano eruption.
Interesting fit.
What is the source of this graph? It’s one of the most powerful and clear I’ve seen.
I’d like to post it (with due credit to you), but need a citation.
I generated the graph using the ENSO data from here. http://www.esrl.noaa.gov/psd/people/klaus.wolter/MEI/table.html
And PDO from here: http://jisao.washington.edu/pdo/PDO.latest
Thank you! That’s perfect. It is a great piece of work. Edward Tufte would approve (great author of Visual Display of Qunatitative Information)!