Our friends have become quite focused on one particular aspect of Arctic ice – the September minimum. The claimed rationale is that it affects the Earth’s energy balance, by reducing albedo.
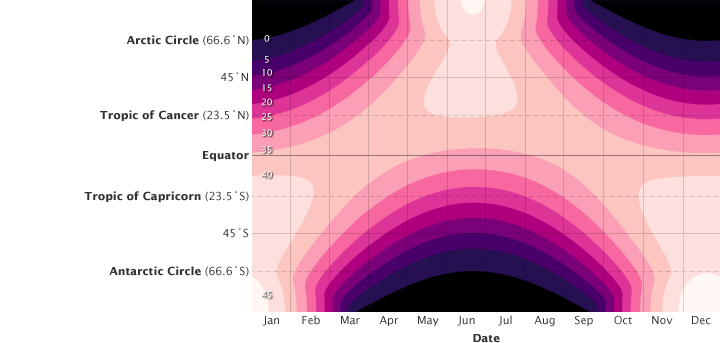
That argument is very weak – because very little sunshine reaches the Arctic atmosphere in September. Most of that is reflected by clouds, and the light which does get through is mainly reflected off the water surface, due to the high angle of incidence.

http://earthobservatory.nasa.gov/Features/EnergyBalance/page3.php
By contrast, open water in September makes it easier for longwave radiation to escape from the oceans. So ice loss in September is probably a negative feedback – rather than the positive one which is normally claimed.
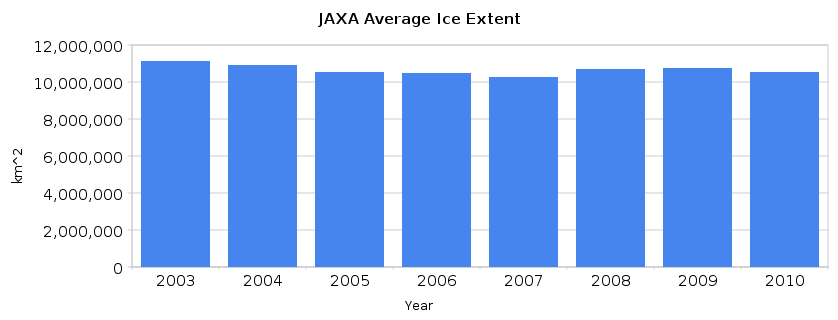
So what would be a better measure of albedo effects? How about average extent during the whole year to date?
It turns out that 2010 is higher than 2006 and about the same as 2005.
The Arctic minimum makes for good press and gives Joe Romm something to hyperventilate over, but really has very little meaning in the physical world. As we have seen, ice can grow back very quickly.


You may want to bold the “to date” in the sentence “How about average extent during the whole year to date?” Otherwise, people might miss it and accuse you of GISS-like tactics.
Anyway, in terms of albedo, I’d say March 20-Sept 22 would be the time to do the average. 2010 doesn’t do so well then, although it does beat out 2006 and 2007. More importantly, there really isn’t any sort of significant trend in the March 20-Sept 22 average JAXA extent.
Presumably better than equinox-to-equinox would be to use a time period where the sunlight actually does something. Arbitrarily moving the start and end inward a month each yields surprisingly similar numbers as the extent-to-extent calc. 2010 is a bit weaker with this metric, but not by much.
Honestly, I’d say even the best “average” measure isn’t the best indicator. To really get at it, I’d think one would need to do a weighted ice area versus latitude calculation (where the weight is based on solar irradiance for that latitude) for each day and work that up…not trivial, but should be easily do-able for people with the data in hand.
To see if ice loss results in a positive or negative net feedback, one would need to estimate the insulation of the ice versus insolation changes from the ice albedo using the above metric. 🙂
-Scott
Steve, this paper nicely discusses the ice-albedo feedback and how it influenced the 2007 melt. http://www.agu.org/journals/gl/gl0811/2008GL034007/2008GL034007.pdf
It will also help your readers better understand the ice-albedo feedback and how it affects ice melt. There are also several papers the last couple of years that have discussed Arctic Amplification in autumn, which is directly related to the ice-albedo feedback. It is the accumulated heat absorbed during summer that is important.
Julienne,
Thanks for the reference. 2007 was the lowest average extent and did have a lot of open water earlier in the summer. Didn’t that also have a lot to do with cloud cover?
Yes, cloud cover played a role as well. These last few years have seen strong Beaufort Sea Highs and associated less clouds (though not as persistent as in 2007). Both more open water and more incoming solar energy under clear skies will lead to increased absorption of incoming solar energy during summer.
Arctic Oceanic Sea ice is, on a scale of 1-10, about -.01 in terms of importance to anything relevant to the alarmist cause.
Albedo? huh, what if it is cloudy up there for years on end?
It’s all about ocean currents and lots of darkness, shh…….. whisper it quietly.
Doesn’t matter one iota, ice comes, ice goes and as Dr North pointed out once, we do not really have accurate records going back to the year dot.
Only to 79, so on that scale, the ice is lowish but if it disappeared then, so what?
There is, lots and lots of lovely ice (both sea ice – at record levels and continental ice – whoopee!) in the south, which barely gets a mention, apart from the old cherry about the western ice shelf – shock horror wasted argument.
Back to the ozone ‘hole’ I guess.
All interesting stuff Steve, thank you, enjoy the blog.
The ice was flushed out of the Arctic basin.
Watch the time lapse video
What is the paper’s title and/or who are the authors. The AGU paywall makes this difficult.
I’ve run the numbers (and studied high resolution seasonal numbers) and it can only have a local effect, and only early in the summer versus late in the melt season.
Nevermind, I found the study.
http://imb.crrel.usace.army.mil/pdfs/2008GL034007_for_IMB_web_page.pdf
Quote from the paper: “The ocean albedo was set to 0.07 based on observations by Pegau and Paulson [2001]. Values of Aw were obtained from passive microwave satellite data and Fr from operational products of the European Center for Medium Range Weather Forecasts.”
Pegau and Paulson 2001 states:
http://www.ingentaconnect.com/content/igsoc/agl/2001/00000033/00000001/art00035
“Results from summertime measurements of albedo over leads show that under cloudy conditions the average albedo is 0.066 with a standard deviation of 0.007.”
The albedo of open ocean in cloudy conditions in the early summer in the Arctic (or in Beaufort Sea) is NOT 0.07. The Pegau and Paulson paper must have made errors in their estimates.
“Our friends have become quite focused on one particular aspect of Arctic ice – the September minimum.”
Take the blinkers off Steve, I asked twice about the effect in June.
http://stevengoddard.wordpress.com/2010/10/01/sea-level-falling-in-2010/#comment-2785
And it was you that bought up the Aertic minimum …
http://stevengoddard.wordpress.com/2010/10/01/sea-level-falling-in-2010/#comment-2729
Steve: You’re quite right. Clearly when looking at the ice/albedo effect it would be best to focus on a time window around the equinox, when the insolation is highest. Turns out that this year 2010 was way below the pack through June, though it improves somewhat through July. Depending on the width of the window you choose, 2010 is either the worst, second worst, or third worst on record
I’m not sure that’s the result you wanted. Why did you average in the data from January through April, when there’s little to no sunlight and the feedback may as you say be a net negative? Including these months makes no more sense than including September – December.