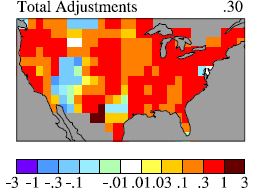
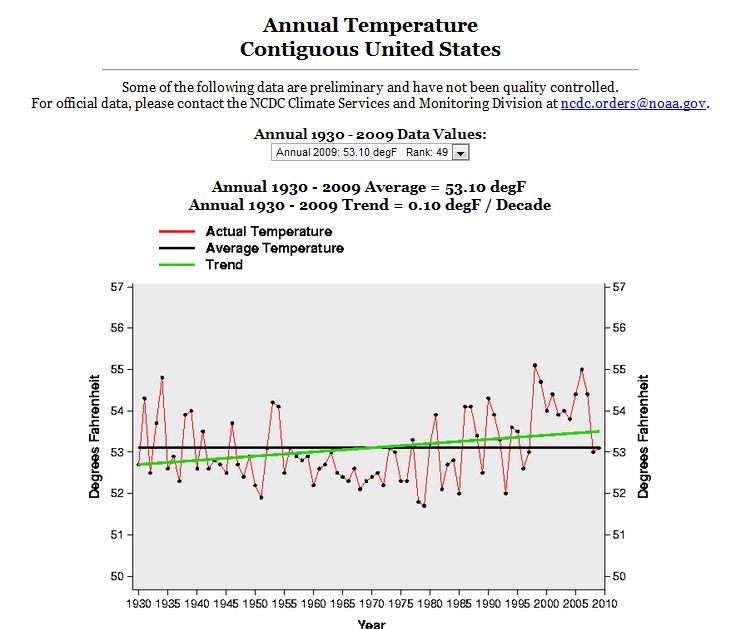
Hansen published this map which shows how much upwards adjustment (0.54ºF) is made to the thermometer readings before the data is published.
Explained simply, almost the entire US temperature trend is the result of upwards adjustments made by people at the Carbon Dioxide Information Analysis Center.
CDIAC is supported by DOE’s Climate Change Research Division
No confirmation bias there, I am sure.


wow…good to see the map and sad that policy is being written that relies on these adjustments
No confirmation bias there, I am sure.
You’re supposed to trust the government. 😉
“In our country, the lie has become not just a moral category but a pillar of the State.”
~~Alexander Solzhenitsyn