Disrupting the Borg is expensive and time consuming!
Google Search
-
Recent Posts
- “Why Do You Resist?”
- Climate Attribution Model
- Fact Checking NASA
- Fact Checking Grok
- Fact Checking The New York Times
- New Visitech Features
- Ice-Free Arctic By 2014
- Debt-Free US Treasury Forecast
- Analyzing Big City Crime (Part 2)
- Analyzing Big City Crime
- UK Migration Caused By Global Warming
- Climate Attribution In Greece
- “Brown: ’50 days to save world'”
- The Catastrophic Influence of Bovine Methane Emissions on Extraterrestrial Climate Patterns
- Posting On X
- Seventeen Years Of Fun
- The Importance Of Good Tools
- Temperature Shifts At Blue Hill, MA
- CO2²
- Time Of Observation Bias
- Climate Scamming For Profit
- Climate Scamming For Profit
- Back To The Future
- “records going back to 1961”
- Analyzing Rainfall At Asheville
Recent Comments
- Bob G on Climate Attribution Model
- Bob G on Fact Checking NASA
- arn on Climate Attribution Model
- Bob G on Climate Attribution Model
- Bob G on Climate Attribution Model
- Bob G on “Why Do You Resist?”
- Gerald Machnee on Fact Checking The New York Times
- Gerald Machnee on Climate Attribution Model
- Gerald Machnee on “Why Do You Resist?”
- arn on Climate Attribution Model
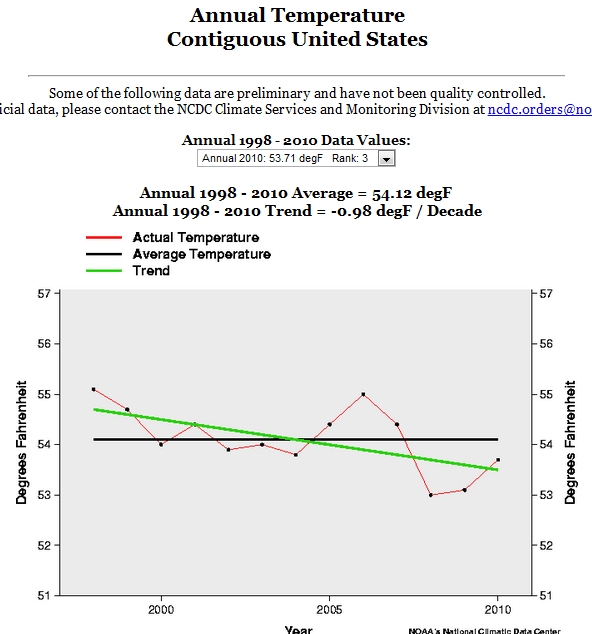
US Temperatures Dropping At A Rate Of Almost 10 Degrees Per Century Since 1998
This entry was posted in Uncategorized. Bookmark the permalink.


Just think how bad it could be with the value added enhancements to the data!
That was supposed to be “without” the value added
I think you were right first time, Mike.
Hey Steve, do another post on how long it has been since a hurricane hit the USA. I live in Florida and the news people are acting like the end of the world is coming due to a little storm in the Atlantic.
Just reading that makes me cold.
Guess now would be a good time for you Americans to invest in a company that specialises in winter clothing.
On a related note:- you can add west Africa to the areas of the earth that are experiencing a decline in temperature for this time of the year.
Given enough time and taxpayer money, I am sure Dr. James “Thumbs On The Temperature Scale” Hansen and his mighty band of ‘data homogenizers’ can get this curve to have a positive slope, if they close down a few more cooling stations, throw out pre-1900 cooling data (ie: Orland CA), expanded the deletion of cooling data sets like the Danish Meteorological Data Set of the North Pole, etc.