Disrupting the Borg is expensive and time consuming!
Google Search
-
Recent Posts
- Gaslighting 1924
- “Why Do You Resist?”
- Climate Attribution Model
- Fact Checking NASA
- Fact Checking Grok
- Fact Checking The New York Times
- New Visitech Features
- Ice-Free Arctic By 2014
- Debt-Free US Treasury Forecast
- Analyzing Big City Crime (Part 2)
- Analyzing Big City Crime
- UK Migration Caused By Global Warming
- Climate Attribution In Greece
- “Brown: ’50 days to save world'”
- The Catastrophic Influence of Bovine Methane Emissions on Extraterrestrial Climate Patterns
- Posting On X
- Seventeen Years Of Fun
- The Importance Of Good Tools
- Temperature Shifts At Blue Hill, MA
- CO2²
- Time Of Observation Bias
- Climate Scamming For Profit
- Climate Scamming For Profit
- Back To The Future
- “records going back to 1961”
Recent Comments
- Bob G on Gaslighting 1924
- Bob G on Gaslighting 1924
- conrad ziefle on Gaslighting 1924
- Bob G on Gaslighting 1924
- Bob G on Gaslighting 1924
- arn on Gaslighting 1924
- conrad ziefle on Gaslighting 1924
- Gordon Vigurs on Gaslighting 1924
- conrad ziefle on Gaslighting 1924
- Robertvd on Gaslighting 1924
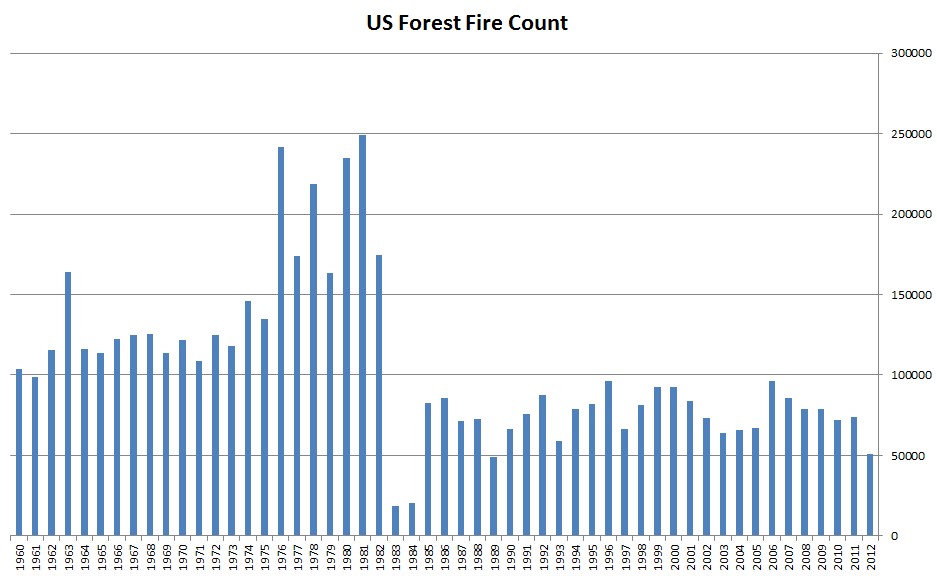
2012 – Fewest Forest Fires In Decades
This entry was posted in Uncategorized. Bookmark the permalink.


Does Jimmy Carter take credit?
Whoops.. I meant Reagan..
I need more sleep
The 60’s, 70’s and early 80’s were pretty ugly it seems. Must have been hell to live with. I left North America in ’82 so it must have been my fault. Sorry.
This is what Climate Scientists describe as Extreme[ly nice] weather.
Your timing is perfect, Steve, I am just now writing an article about extreme weather (not!), and I have someone yelling at me about wildfires creating CO2 😛
I could not find the same data you posted. I perused the nifc fire statistic info site and found multiple reports through 2011, but nowhere were there stats on 2012 unless you went to the individual state numbers and plugged those totals into a homemade chart. That should show a total fire count of 67,315. The number of fires is irrelevant since so many of the variables are out of our control (the # of idiots letting a chain drag behind their vehicles, the # of idiots who toss cigarettes out their window, the # of power lines that go down due to high wind in the summer, the number of dry lightning storms like the freak spate of storms California suffered in the summer of 2006) But the more interesting number is the number of acres burned…in 2012, it was 9,211,281 acres. That’s a very large number. As fire science advances, the number of acres burned should go down, but wildland firefighters are finding the fuel load much drier and explosive. (THAT kind of information is found in reports, not charts)(although they probably do keep records on the moisture content of the fuels in individual fires)
There are too many factors involved in fire stats to draw conclusions, so posting a single chart is kinda pointless.
And your title (2012-Fewest Forest Fires in Decades) is not true.
With the NIFC reporting 67,315 wildland fires, three years in this decade alone had fewer forest fires! (2003, 2004, 2005)
The fact that is so stunning is not the number of fires, but the number of acres burned…if you compare this decade (2002-2012) to the previous (1992-2002) the increase in acres burned is frightening (acres burned stats are found at the first link I provided)(and acres burned for 2012 was 9,211,281acres) In the past couple of decades, we went from roughly three-and-a-half million acres burned per year to roughly SEVEN-and-a-half million acres burned.
If you had confidence in your arguments, you would not feel the need to fudge facts.
http://www.nifc.gov/fireInfo/fireInfo_stats_totalFires.html
http://www.nifc.gov/fireInfo/fireInfo_stats_YTD2012.html