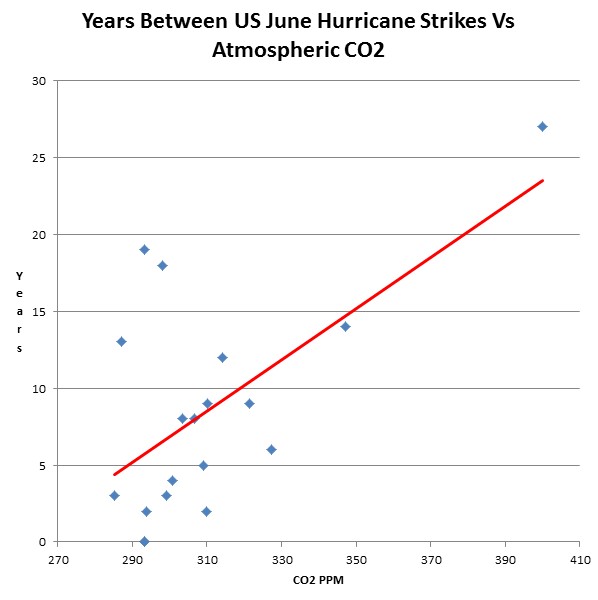
In 1886 the US had three June hurricane strikes, but it has now been more than 27 years since the US was hit by a hurricane in June.
Chronological List of All Hurricanes
As CO2 has risen, the frequency of June hurricane strikes has dropped dramatically. The feds should give carbon polluters a huge rebate for protecting the US from countless numbers of missing June hurricanes, which didn’t happen thanks to CO2.


This record is even more impressive given the NHC’s current practice of reporting wind speeds 25+ m.p.h. than actually observed. NHC reported that June’s TS Andrea had 65 m.p.h. winds when it made landfall in Florida. No land based station reported tropical storm strength winds at all.
I agree, it’s interesting that even an expert like Joe Bastardi predicted that this year’s hurricane season would be relatively strong based on the pair PDO+/AMO- that was prevalent until few months ago, but the whole scenario changed very quickly in the last few months.
Now we have a quite stable cooling in the N. Atlantic and the PDO- is weakening, approaching zero, probably going to a minimum in its negative phase. I believe the continuous positive anomaly of the SP ice (almost 20 months straight now) is part of the cause and is finally altering the oceans temperatures in a global scale, by pushing cold waters into the tropical Pacific and reversing, to some extent, the conditions that were prevalent until few months ago.
typo: … pair PDO-/AMO+ that was prevalent …
I agree with your logic Steve, you have just proven, using the method of consensual science, that CO2 causes less hurricanes.
Now, you should be probably indicated to some kind of nobel prize for helping humanity to understand hurricanes more profoundly.
How many years, I imagine, have you been studying these very intricate problems to get to such unprecedented conclusions!! Congratulations! 🙂
I object. You appear to be using wamist false data that shows CO2 levels have been rising for thousands of years when in fact they have been higher than todays levels several times in the past two centuries. OK it discredits the “extreme weather events” meme but gives credit to the deception that CO2 levels are 1) rising due to anthropogenic emissions 2) causing global warming.
For example CO2 levels were around 430ppm in 1942 and there was no global warming. From this very simple observation we can conclude that:
a) Current CO2 levels are well within normal variations.
b) CO2 does not cause global warming.
This is the only information needed to falsify the AGW hypothesis. Please do not continue to support the AGW scam.
Geek: The “warmist false data” is the set being gathered at the Mauna Kea Observatory. Local readings may vary greatly, and may show false highs or lows. But if you always collect your base data at the same location you get an accurate record. Mauna Loa is ideal because it is (a) very isolated and (b) at a high elevation, averaging out the discrepancies encountered in low-altitude readings.
I note your are a follower of WUWT. Maybe you should read a bit closer, where their author says
“Wet chemical analyses indicate three atmospheric CO2 maxima in the northern hemisphere up to approx. 400 ppm over land and sea since about 1812. The measured atmospheric CO2 concentrations since 1920 –1950 prove to be strongly correlated (more than 80 %) with the arctic sea surface temperature (SST).
“A detailed analysis of the Atlantic Ocean water during the arctic warming since 1918 – 1939 by Wattenberg (southern Atlantic ocean) and Buch (northern Atlantic ocean) indicates a very similar state of the Atlantic Ocean (pH, salinity, CO2 in water and air over sea etc.) These data show the characteristics of the warm ocean currents (part of global conveyor belt) at that time, indicating a strong CO2 degassing from the Atlantic Sea, especially in the area of Greenland/Iceland and Spitsbergen. More than 360 ppm had been measured over the sea surface.”
http://wattsupwiththat.com/2008/07/25/beck-on-co2-oceans-are-the-dominant-co2-store/
You see? They occasionally came across a “strong CO2 degassing” event. Or an event “strongly correlated with the Arctic sea surface temperature”. Those are normal exhalations from the sea surface. Up at the summit of Mauna Kea, these events don’t corrupt the readings.