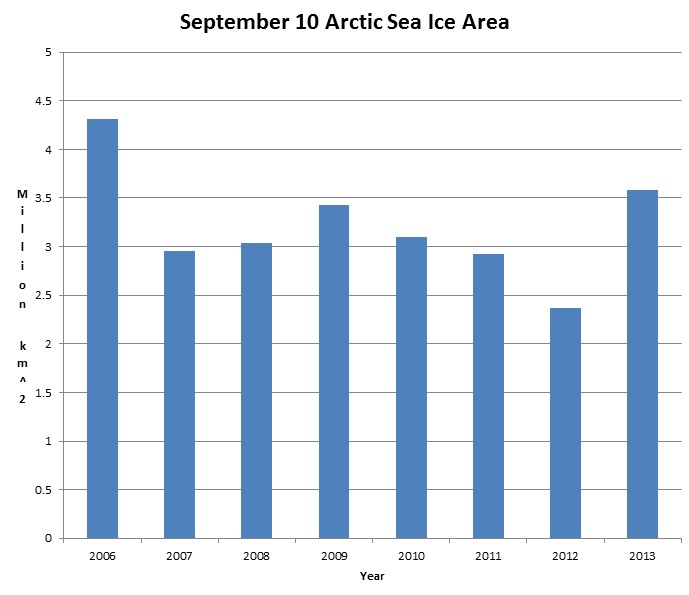
Arctic ice area is increasing, as new ice is forming rapidly north of 80N. Ice area is the highest since 2006.
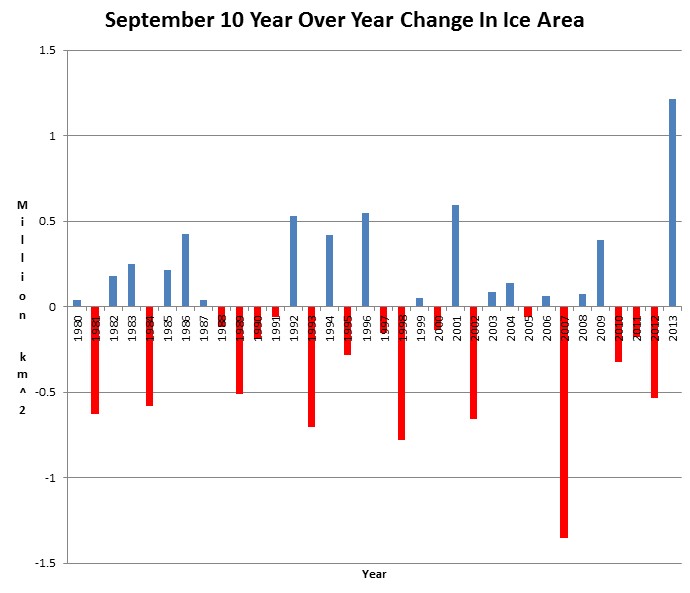
The year over year change in Arctic sea ice area has blown away the record for ice growth, by more than a factor of two.
arctic.atmos.uiuc.edu/cryosphere/timeseries.anom.1979-2008
Look for the experts to hide this information from the public for as long as they can.


Next spin: Polar Bears trapped by solid ice.
I thunked they wuz already all dead.
You can just see a polar bear with a coke bottle in one hand and an EBT card on a chain around his neck saying – “It’s too cold, we can’t find food and the AGW subsidies have run out, we need our monthly EBT card limit raised or we are all doomed”.
It’s not the end of September yet so i am not sure you can claim this.
Also, the large difference in ice extent in September over last year is not a reflection on how much ice there is this year, simply how little ice there was last year. This year is still low, just not massively low like last year. When we have exceptional years like 2007 and 2012 then the ice extent returns back to the long term trend, which is downwards
Finally what do you think about the volume amount for 2013 summer? It was a low winter
http://www.bbc.co.uk/news/science-environment-23964372
Having said that, there will be a lot more multiyear ice next year so it will be interesting to see how things go on.
Andy
You used BCC as a source? They got caught trying to push global warming scam on us…
You’re not too bright…
BCC ? You are not too bright to use a keyboard it seems
Ok, another link
http://www.esa.int/Our_Activities/Observing_the_Earth/Living_Planet_Symposium_2013/New_dimensions_on_ice
Hope you have better luck with the mouse and it’s buttons Lou
Andy
This ESA? Really? 😆
http://stevengoddard.wordpress.com/2013/09/12/european-union-junk-science-reaches-a-new-low/p
No Andy, you are incorrect, the graph is a reflection of the total amount of ice GROWTH or DECLINE, if you will actually look at the graph before pounding your little shill fingers away on the keyboard, you’ll notice that the graph finds it’s center for growth at ZERO. So it most certainly is an accurate representation of the exact amount of ice change from a starting point that goes back more than 30 years. I smell shill shit.
“So it most certainly is an accurate representation of the exact amount of ice change from a starting point that goes back more than 30 years.”
But the graph does not go back 30 years, it just shows 7.
I am not incorrect at all. :Last years was a very low low year so this years will seem a lot bigger, but if you look at September for 30 years
http://nsidc.org/arcticseaicenews/files/2000/09/Figure3.png
it’s still a lot lot less than the past.
Tell me it is 7 million square km this year and I will be impressed
Andy
You seem to be having a difficult time dealing with this.
It would be much more entertaining to look at it for the past 40-60 years.
Andy,
Interesting that your link shows a maximum thickness of 4m. Mainstreamfirstlast, the Northwest Passage rowing team, documented ice with a thickness of 12 meters, in the sea. It appears the satellites need recalibration.
How can a local measurement prove anything? Not even scientific. it’s so far away from buoy evidence I am surprised you had the guts or stupidity to post it.
it’s not the sats that need calibration.
Andy
Andy,
Tens of thousand of measurements show sea ice much thicker than 4 meters many kilometers from the Canadian coast. Someone as smart as you would call that consilience.
The satellites appear to have cutoff the maximum ice thickness at 4m, contrary to multiple lines of evidence.
There should be no trepidation introducing evidence contrary to one’s confirmation bias, even if it reduces others to insult.
Have a great day.
Andy – I’m concerned for your mental well being if you continue in denial of the facts that the AGW movement was based on failed theory. By every measure the nearly $800 billion raised and spent by the environmental left to push the AGW agenda has been a monumental waste of money and time – not to mention the terrible energy policies that have resulted.
You need to find another cult. May I suggest something a bit more real, like the Fukashima disaster ?
As usual with the obsessive-compulsive alarmist shills, Andy attempts to move the goal posts to volume when the ice stages a recovery … too bad, so sad.
Give it up Andy – you’ve been dealt a losing hand by the Arctic this melt season and your Arctic based shilling for GLO-BULL warming will have to wait until next year!
I wish the damn arctic would melt so we can easily get at all that oil. Wonder how that oil got there?
Abiogenic.
As one who thinks the AGW promoters are full of it, I do think Andy is right about his initial point. The graph demonstrates year over year change. It isn’t like the zero line is “normal” and therefore this year’s number is way above; it simply reflects the growth from last year’s minimum. It’s encouraging news and hopefully portends continued growth, but it is still only one year. We can’t crow about anything after only one year. The story on the new satellite he links to is however about old news when it discusses last winter’s lackluster peak ice extent while ignoring this summer’s improved melt. And Andy remember, the Arctic data only goes back to 1979 when we trained a satellite to measure it. If AGW proponent’s can say that the decade and a half of no warming is too short a time period to make any assumptions, then you likewise can’t tell us skeptics that you won’t be impressed until the Arctic ice extent reaches 7 million square km. What’s good for the goose…
The is making a grand recovery
Agreed.
The AGW cultists on grist have still tried to spin this to fit their world view. http://grist.org/news/sorry-skeptics-arctic-ice-is-still-melting-quickly-this-summer/
Best data, best arguments, best humour/humor this site well done SG
Andy won’t be satisfied that global warming has stopped and that the climate models were utterly wrong until the Laurentide Ice Sheet grinds up to his front door. Even then, he will insist that the return of a new ice age was due to human use of fossil fuels.
Global warming experts: “Global warming is hidden in the oceans”