
With each successive decline in temperature, the IPCC has gained confidence that their exponentially increasing warming models are correct.
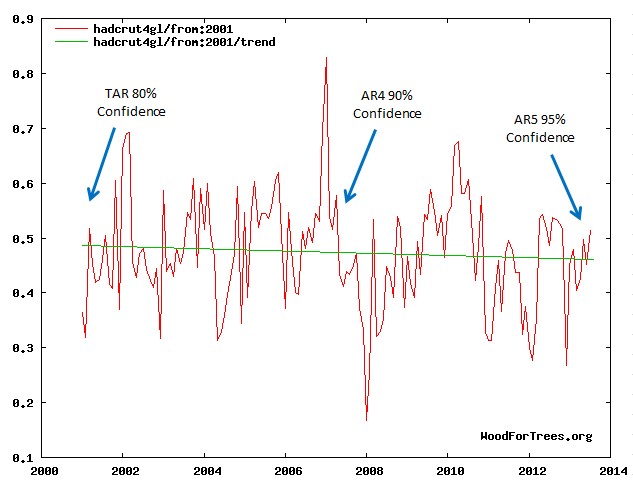
Note that the linear decline seen since TAR in 2001 is almost a perfect fit for the exponential increase of 0.4ºC predicted by Hansen during that interval.
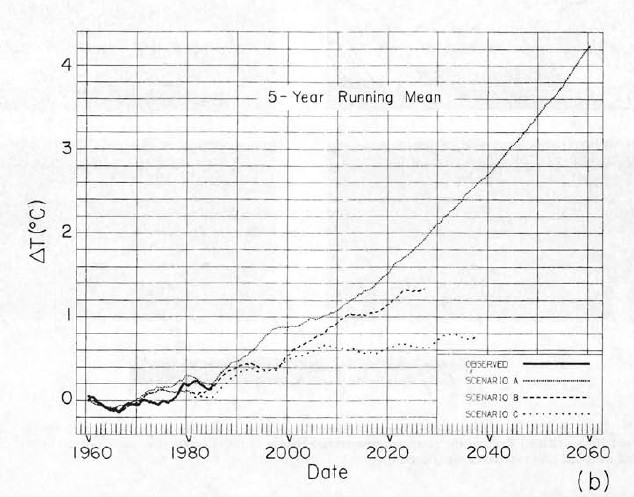
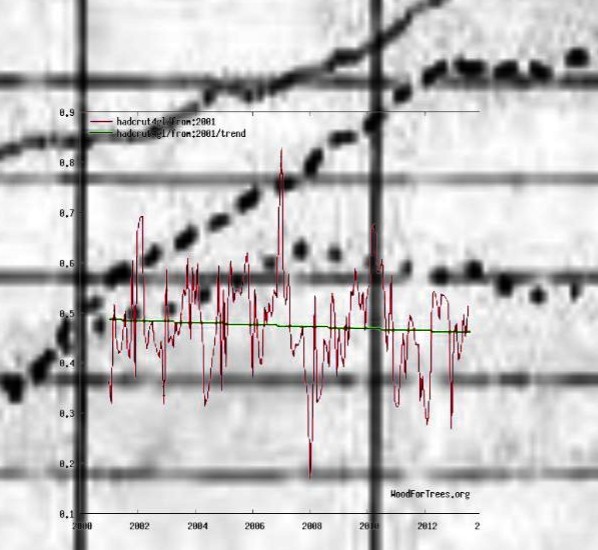
The next graph is a closeup showing actual temperatures since 2001, overlaid on Hansen’s forecasts.
Bottom line is that you would have to have the IQ of a turnip to believe any of the spectacularly transparent lies being spewed by the IPCC this week.

The IPCC says that it is a ‘pause’ in the warming. Surely it is only a pause if you KNOW (i.e. can prove) that the change will continue. It may well be a pause before a decline.
The word is “peak”.
“have to have the IQ of a turnip”
Or the IQ of a journalist.
IPCC, we are the ‘con’ in ‘confidence’.
At AR4, the trend line was still up. That was reasonable. Plus, you’ve got to look at the reasonableness of TAR by showing parts of the graph before that.
You got it
http://stevengoddard.wordpress.com/2013/09/28/warming-pause-is-actually-22-years/
Steven, this is one of your best graphics of all time.
This has lots of possibilities.
For example, a plot of temperatures from 1930 – 1981, with indicators of when Ehrlich thought the climate was the most extremely good in 1000 years (1930-1960); when Ehrlich predicted long term cooling (1974); when Schneider switched from cooling to warming; and Hansen announcing catastrophic global warming has been seen (1981).
Or a plot of temperatures from 1850 – 2013, with NYT headlines indicated by date, with catastrophic cooling in blue and catastrophic warming in red.
Or a spaghetti plot of US GISS or NOAA temperatures, with Hansen statements indicated by date.
Reblogged this on CACA.