

Disrupting the Borg is expensive and time consuming!

Google Search
-
Recent Posts
- Analyzing The Western Water Crisis
- Gaslighting 1924
- “Why Do You Resist?”
- Climate Attribution Model
- Fact Checking NASA
- Fact Checking Grok
- Fact Checking The New York Times
- New Visitech Features
- Ice-Free Arctic By 2014
- Debt-Free US Treasury Forecast
- Analyzing Big City Crime (Part 2)
- Analyzing Big City Crime
- UK Migration Caused By Global Warming
- Climate Attribution In Greece
- “Brown: ’50 days to save world'”
- The Catastrophic Influence of Bovine Methane Emissions on Extraterrestrial Climate Patterns
- Posting On X
- Seventeen Years Of Fun
- The Importance Of Good Tools
- Temperature Shifts At Blue Hill, MA
- CO2²
- Time Of Observation Bias
- Climate Scamming For Profit
- Climate Scamming For Profit
- Back To The Future
Recent Comments
- Bob G on Analyzing The Western Water Crisis
- arn on Analyzing The Western Water Crisis
- Bob G on Analyzing The Western Water Crisis
- Bob G on Analyzing The Western Water Crisis
- Bob G on Analyzing The Western Water Crisis
- Hank Phillips on Analyzing The Western Water Crisis
- Hank Phillips on Analyzing The Western Water Crisis
- Hank Phillips on Analyzing The Western Water Crisis
- Hank Phillips on Analyzing The Western Water Crisis
- Bob G on Analyzing The Western Water Crisis
Disrupting the Borg is expensive and time consuming!
Reblogged this on Health Science Watch.
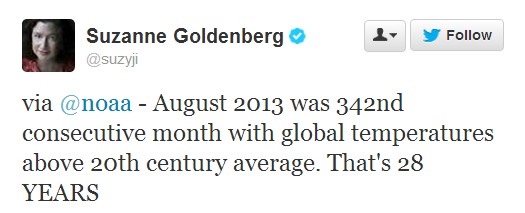
Wasn’t at least half of the 20th Century above the average as well? That’s 600 months.
LOL! Yep, right about half!
Wouldn’t that be the median that half are above?
Another use of cherry picked stats to prove a point, how utterly boring. lies, damned lies and statistics.
2013 will be (approximately) the 8500th most warmest year in the last 10,000. And the 8500th (approximately) most warmest year in the last 100,000. Are we in the first decile or the 9th decile of warming, well it depends on the period chosen. What does that have to do with human induced carbon dioxide? Nothing. The earth cools and warms naturally, and has done so since it was formed.
Which 20th century average? There are so many from which to choose.
BRAVO! .. that is exactly what I was thinking! 🙂
Probably one of those faked ones where the past has been cooled and the present warmed – is it called GISSTEMP?
making the LIA disappear
hahaha! Oh what would I do without my daily dose of this blog. Nicely done!
Yet another year when CO2 levels and global temperatures were not correlated. Ho-humm, such is life.
Perhaps Suzy might like to pick her ideal decade climate wise. Which decade of the 20thC would she like us to return to?
The freezing years in the 1970’s?
The dustbowl years of the 1930’s?
The droughts of the 1950’s?
Come on Suzy, do tell us.
Statistics from Lake Woebegone?
She is cherry picking data sets. If you look at the satellite data there are many times when temps are below average.
Here’s a nice review of what Goldenberg is really all about – from Donna LaFramboise.
http://nofrakkingconsensus.com/2013/09/16/suzanne-goldenberg-eco-activist-disguised-as-a-journalist/
She ain’t the only one!
What she is saying is that we’re at the tail end of 300 years of mild warming. We don’t know what caused the first 250 years of warming but most of the last 50 were definitely caused by humans.
If you average the top 28 years of a ~60 year sine wave you will get 28 years of above average temperatures.
If you average the last 28 years of a 9,000 year peak in solar activity you just might get above average temperatures too.
Ms Goldenberg might want to find some time to do a statistics course.
Way to slap her down…
I doubt she even realizes it or considers other stats, other comparisons… she’s probably just angry and insulted by those horrible fossil fueled ‘deniers’ out there !!
Hilarious!!