
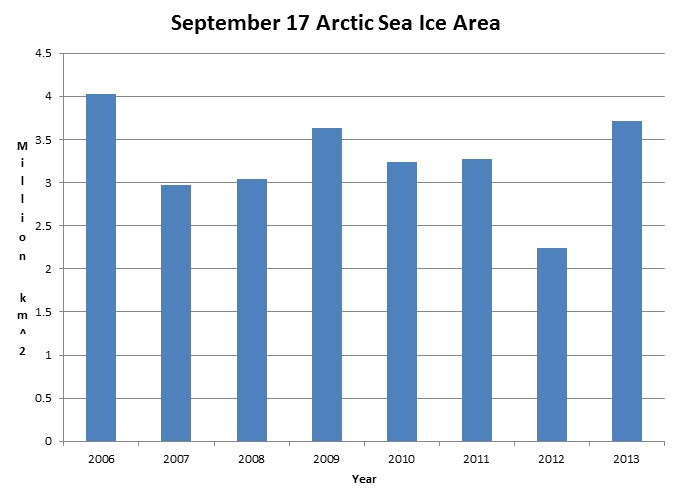
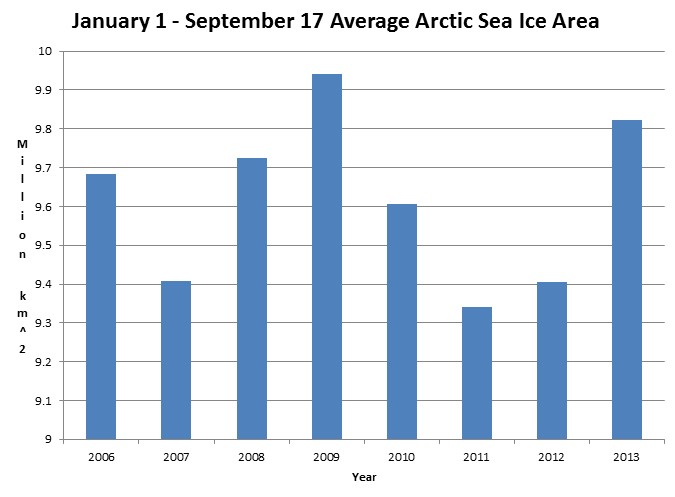
Arctic ice area the highest since 2006, and average ice area for the year to date is higher than 2006.
Disrupting the Borg is expensive and time consuming!

Google Search
-
Recent Posts
- The Real Hockey Stick Graph
- Analyzing The Western Water Crisis
- Gaslighting 1924
- “Why Do You Resist?”
- Climate Attribution Model
- Fact Checking NASA
- Fact Checking Grok
- Fact Checking The New York Times
- New Visitech Features
- Ice-Free Arctic By 2014
- Debt-Free US Treasury Forecast
- Analyzing Big City Crime (Part 2)
- Analyzing Big City Crime
- UK Migration Caused By Global Warming
- Climate Attribution In Greece
- “Brown: ’50 days to save world'”
- The Catastrophic Influence of Bovine Methane Emissions on Extraterrestrial Climate Patterns
- Posting On X
- Seventeen Years Of Fun
- The Importance Of Good Tools
- Temperature Shifts At Blue Hill, MA
- CO2²
- Time Of Observation Bias
- Climate Scamming For Profit
- Climate Scamming For Profit
Recent Comments
- arn on The Real Hockey Stick Graph
- arn on The Real Hockey Stick Graph
- Gordon Vigurs on The Real Hockey Stick Graph
- Peter Carroll on The Real Hockey Stick Graph
- Robertvd on The Real Hockey Stick Graph
- Robertvd on The Real Hockey Stick Graph
- Gordon Vigurs on The Real Hockey Stick Graph
- Jack the Insider on The Real Hockey Stick Graph
- Bob G on The Real Hockey Stick Graph
- conrad ziefle on The Real Hockey Stick Graph
The blowtorch will fight back!!!!!
Ummm….As soon as Reggie can defrost it, himself and his lighter.
We’ll get back to you….. soon. We promise. Be alarmed!!!
Hey Steven, look at the antarctic ice extent! The previous all time record of last year has been broken, the current extent is now 19.45 million km2!
Cue Mattayoyo to show up and tell us all the long term trend remains the same and temperatures are still rising, polar bears dying and Steven is still suffering from the wetter new millennium deadly climate change drought!!
The melt season is over?
http://nsidc.org/data/seaice_index/images/daily_images/N_stddev_timeseries.png
http://www.ijis.iarc.uaf.edu/seaice/extent/AMSRE_Sea_Ice_Extent_L.png
In the case of NSIDC, doesn’t the graph mean it was over 5 days ago? (smoothing)
You are probably right. I’m just being careful lest there should be some massive storm.