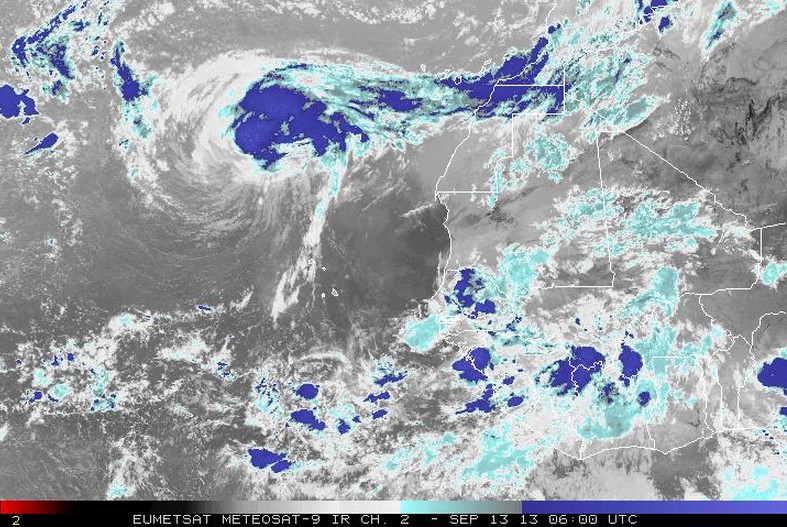
NOAA’s special friend Humberto magically reached hurricane force wind speeds a few minutes before NOAA was going to have to admit a new record for latest first hurricane.
Can you identify which one of the thunderstorms in the image below is an official NOAA hurricane?


I do feel the record is broken if it was not for satellites that were launched into space in the 1970’s Humberto would of never been known as a hurricane.
Steve, you have charts of all tropical storms/hurricanes that made landfall in the USA for each year. That record has to be broken and not getting any attention. The media that turned any weather event into Extreme Media Coverage Reporting.
Charts on this site that Dr.Ryan M. show the real tropical activity is near 1970’s levels.
Great site
http://policlimate.com/tropical/
This ACE chart showing a decline. Match it up with sunspot cycles and it is tracking them dome what.
http://policlimate.com/tropical/global_running_ace.png
Thanks for the links, looks like 2013 is following 2009 not only in the Arctic ice extent but also in the (low) total ACE of N. Atlantic storms,
http://policlimate.com/tropical/natl_ace_to_date.png
Interesting that even the pattern of earthquakes, magnitudes 7 to 9, this year is similar to 2009.
There is a symmetric pattern in terms of energy release the last 5 years, with a peak in EQ energy in 2011 (due to the Japan mega-quake), lower and comparable levels in 2010 (8.8 in Chile) and 2 strong M8.6 and M8.2 on the same day in Indonesia last year, and just one M8 this year and 2009.
2008 had not M8+ EQs.
The global ACE seems to have two main forcings: the solar cycle intensity and ENSO.
You need the magical iHurricane app that NOAA now sell.
The blue one?