
Four of the five snowiest northern hemisphere winters have been since 2009
That is because global warming has put more moisture in the atmosphere.
Snow in Mississippi is caused by an increase in humidity?
Four of the five snowiest northern hemisphere winters have been since 2009
That is because global warming has put more moisture in the atmosphere.
Snow in Mississippi is caused by an increase in humidity?

You didn’t know that global warming caused Mississippi to go from 99.8% humidity to 100%? The 0.2% increase pushed the temperature up just enough to go from too cold to snow, to snows like mad.
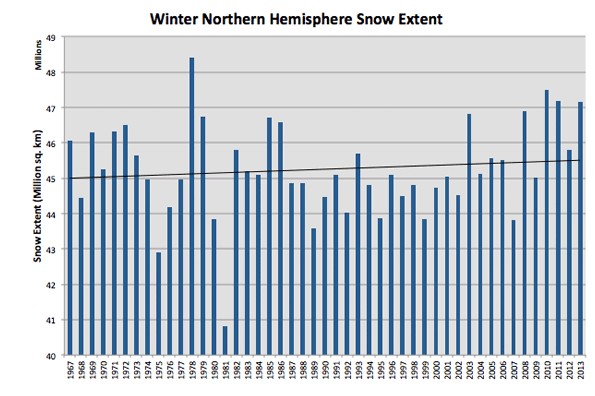
1981 must have made the Warmists very happy and given them false hope. Since then its been downhill all the way, on a toboggan.
I reckon your second favorite conversation with alarmists concerns that pesky permanent drought that’s hitting you hard again tonight. Must be tough…
When you look at that graph, and the others on the Rudgers site, you see that the vertical scale doesn’t start at zero, which is bad statistical practice.
At first glance, even though the trend in NH winter is increasing slightly, actually, the extent is always between 40 million and 49 million, and mostly between 43 m and 47 m, so the variation is less than it might appear from the graphs.
But one accommodates the y-axis for such high values the graph will become practically unreadable. Sure, it wouldn’t appear as if there’s much variation between the seasons if the graph was displayed as you intend but the whole point of having a graph displayed in such a way IS to focus on the annual variations.
As it is a natural phenomena, and such things are mostly logarithmic in nature, why not use logarithmic scales? It would certainly add a different perspective to the alarmist message. 🙂
I disagree.
The point of the graph is to show the true annual variation, without being misleading.
The intention of not starting at zero is to exaggerate the annual variation.
At the very least, the scale should start at zero, with a break in the scale clearly shown.
Canada and Russia are always covered with snow in the winter. The graph masks those constants off and accurately shows the large variations in snowfall further south.
QV, you don’t know what you’re asking for. When you start at zero, you miss subtle changes. But, it’s always a trade off. Steve didn’t make that graph Rutgers did. I rather look at it like a tit for tat. But, if it makes you feel better…….
http://suyts.wordpress.com/2013/08/30/do-seasons-change-snow-extent/
Change it to Winter Northern Hemisphere Snow Extent Anomaly, and walaah! Now you have the zero basis you desire, and the anomalies compared to the zero average anomaly appear infinite.
Let the NSIDC lead the way!
Minor point: “Four of the five snowiest northern hemisphere winters have been since 2009” should be “…since 2008”.
5 of the top 10 in Boston snowstorms in the past 10 years.
27.5 inches Feb. 17-18, 2003:
27.1 inches Feb. 6-7, 1978:
26.3 inches Feb. 24-27, 1969:
25.4 inches March 31-April 1, 1997:
24.9 inches Feb. 8-9, 2013:
22.5 inches Jan. 22-23, 2005:
21.4 inches Jan. 20-21, 1978:
19.8 inches March 3-5, 1960:
19.4 inches Feb. 16-17, 1958:
18.7 inches Feb. 8-10, 1994:
Before 1958, going back approximately 70 years, Boston’s biggest snowstorm was 16.6″. Since 1958, they have been over that figure almost more times you can count. Boston has been on the Atlantic coast a long time, thus humidity has never been a major problem when the wind come from the east.
Same with DC. During the 79 years between 1900 and 1979, there was one snowstorm over 15″. During the 34 years since, there have been 6.
I love talking about Antarctic Sea Ice.
Denier: There is record Sea Ice in the Antarctic this year.
AGW: Its the fresh water runoff from the melting ice cap.
Denier: The Daily Mean Temperature is -25C in August and September at McMurdo Station on the coast.
AGW:
Denier: Melting is rare at -25C
AGW:
RE: – “Denier: The Daily Mean Temperature is -25C in August and September at McMurdo Station on the coast.”
AGW: Thats true, but the immense pressure of all that record ice causes melting at the base of the ice sheet. The water gushes from underneath.
Realist: Due to the weight of the ice, both Antarctica and Greenland are inconveniently bowl shaped outside of the mountain ranges, so that melt is headed for Lake Vostok, not the coast.