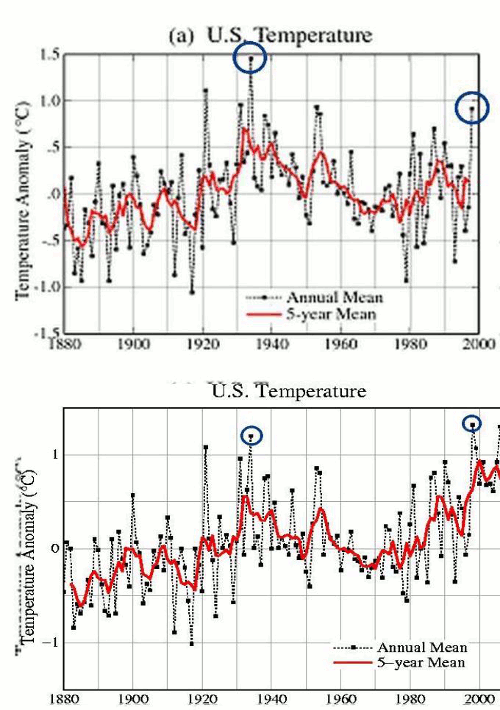
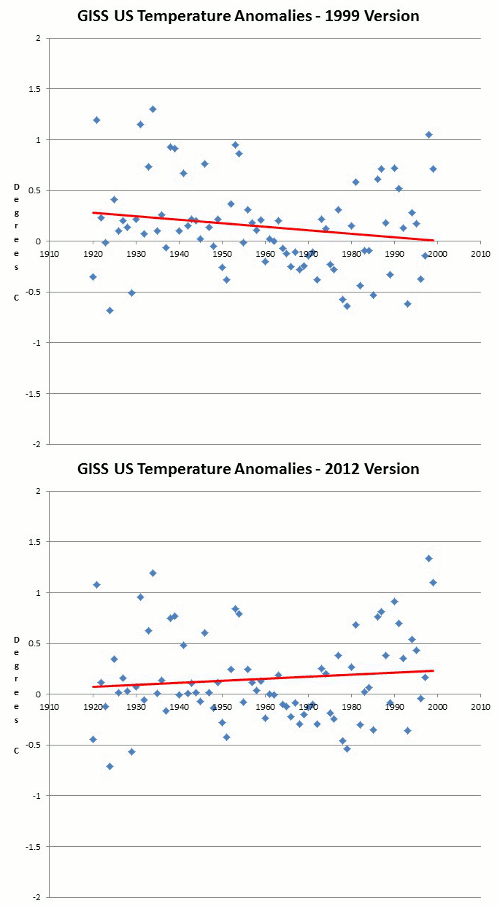
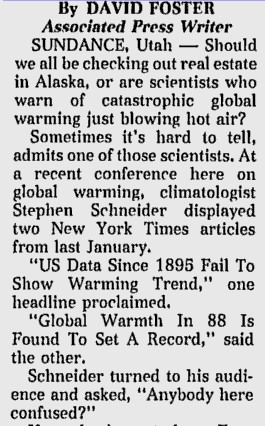
Twenty-five years ago, NOAA recognized that the most robust temperature data set (US temperatures) did not show any warming. This wasn’t going to bring any money in, so plans were made – and by the year 2000 they had completely corrupted the US temperature record – to turn a long-term cooling trend into a warming trend.


My guess is that you are only referring to climate data.
Heads up: David Suzuki brings his special brand of anti-humanist insanity to the Australian public.
http://www.brisbanetimes.com.au/comment/tony-abbott-will-doom-future-generations-if-he-ditches-carbon-tax-20130917-2tx0j.html
Look out, kangaroo lovers – you’re all DOOMED!!!!!!
Hansen learned well from another fraudster:
http://wattsupwiththat.com/2008/11/10/more-flubs-at-the-top-of-the-climate-food-chain-this-time-ncdcs-karl/
I didn’t take notice of the global warming debate until late 2009, and within a year (perhaps as early as spring, 2010), I had become aware that the alarmist climate scientists had actually only correlated CO2 with temperature from 1976 to around 2000, and had clearly tried to extend that correlation as if the temperatures in that period were representative (and also clearly ignoring the cooling from 1880 to 1910, and from around 1940 to 1975–criminal behavior, in science). I have gotten no feedback on this, so people don’t seem to care, or refuse to believe it (although, as I said, to me it soon became obvious from the graphs being presented to the public, here, for example).
But now, looking at the “before” and “after” graphs for the US you present here, it very much looks like they (no doubt Hansen and his buddies in the field) may have originally focused upon the temperature variation from just 1976 to 1989-90, and drew the entire global warming fraud of the last 20 years from that short period–notice how the trend over that small section of time remains the same in the “before” and “after” graphs, while they had to adjust the 1990-2000 temperatures to come into line with the 1976-1990 trend. You heard it here first–the whole temperature fraud is based upon the temperatures in just the 14 (or 15) year period, 1976-1990.