
Twitter / ret_ward: Article by @DavidRo21545155 …

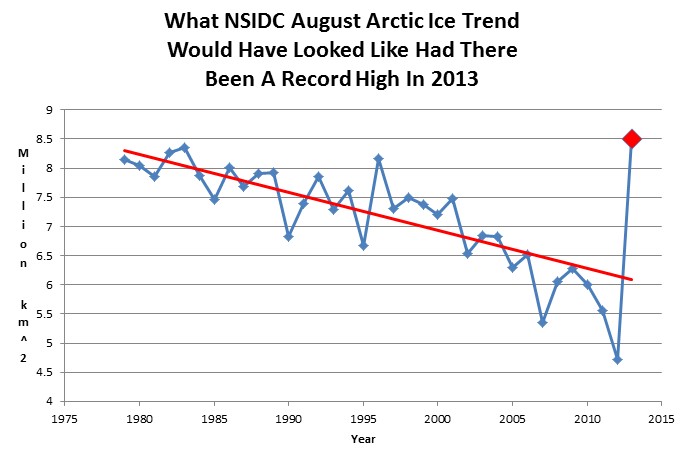
Even if the next five years were the five highest on record, the “long term trend” would still be down. They start their linear trend at a local maximum of a cyclical function – which is junk statistics at its worst.
NSIDC conveniently ignores all satellite data prior to 1979
www.ipcc.ch/ipccreports/far/wg_I/ipcc_far_wg_I_full_report.pdf


junk statistics at its worst.
A valid description of the entire Climatologist field!
I can’t seem to recall what was up with 1979? Was it the most recent peak in Arctic Ice coverage?
It was probably the peak for the 20th century.
Ok. Thanks.
What’s your source for saying “probably the peak for the 20th century?”
We also have more satellites than 1973 which is probably their “reason” for not including the older data – less reliable, but also conveniently supports their story.
Reblogged this on Health Science Watch.
No mention of the Giant Sea Ice Breaking Ships., I posted on Nevans blog the other day and Neven said it could not be more then 2% of ice lost a year from Ice Breaking Ships.
Well if you knock it down to say 1% of Arctic Sea ice is caused to melt every year from Ice breaking ships and add it up every year it comes out to 10% a Decade.
I found the missing Ice
Ice grows Ice and reflects sunlight. Ice Breaking Ships create open water that absorbs sunlight, heat and waves form that push the ice to land where it melts much faster in the shallows.
This is interesting, but in this case how could you explain the rebound this year?
“man made” ice breaking cannot explain all of it. 😉
1979 was the ultimate cherry pick. We have had satellites since the late 1950’s and airplanes long before that. I can’t believe we don’t have no idea what ice was like in the 1950’s or even 1930’s.
Ships were doing the NW Passage well over 100 years ago. Cannot believe they could do so if there was signficantly more ice than today.
Steve,
That 7-8% per decade is only for summer minimum. For maximum it is only 2.5% per decade.
I agree that 1979 is a cherry pick year. I’d never thought that it might have been the peak of the entire century, but I suppose that is possible. There were certainly other warm AMO times of reduced ice in the 1930’s, and the old maps to prove it:
http://sunriseswansong.wordpress.com/2013/08/29/cache-of-historical-arctic-sea-ice-maps-discovered/
I think it is sad, and somewhat pathetic, that they dismiss the hard work of people in the past, probably stating “It isn’t up to our high technical standards.” High standards? Ha!
By the way, the North Pole Camera moved north and south of 84 degrees latitude again today. That is the ninth and tenth time that ice has crossed that line. The ice up there simply doesn’t want to get flushed out through Fram Strait to melt in the Atlantic. If it doesn’t get a move on, there will be a lot more multi-year ice up there to start the melt-season, next year.
http://sunriseswansong.wordpress.com/2013/08/31/the-arctic-sea-ice-minimum-a-september-surprise/
Just a quick comment on your sea ice extent graph. You have labelled it as “IPCC Satellites Launched”. I understand the point you’re making, but in fact there are no IPCC satellites, just pointing that out, and the IPCC was only formed in the late 1980s. In reality they were satellites monitored by the US Navy, and the data were collated by NOAA.
I found the text from AR1 (WG I pg 224) worth repeating:
“Sea-ice conditions are now reported regularly in marine
synoptic observations, as well as by special reconnaissance
flights, and coastal radar. Especially importantly, satellite
observations have been used to map sea-ice extent
routinely since the early 1970s. The American Navy Joint
Ice Center has produced weekly charts which have been
digitised by NOAA. These data are summarized in Figure
7.20 which is based on analyses carried out on a 1° latitude
x 2.5° longitude grid. Sea-ice is defined to be present when
its concentration exceeds 10% (Ropelewski, 1983). Since
about 1976 the areal extent of sea-ice in the Northern
Hemisphere has varied about a constant climatological
level but in 1972-1975 sea-ice extent was significantly less.”
I found the last sentence very interesting, and worth quoting whenever the alarmists point to “low ice”. After all, the IPCC said it.