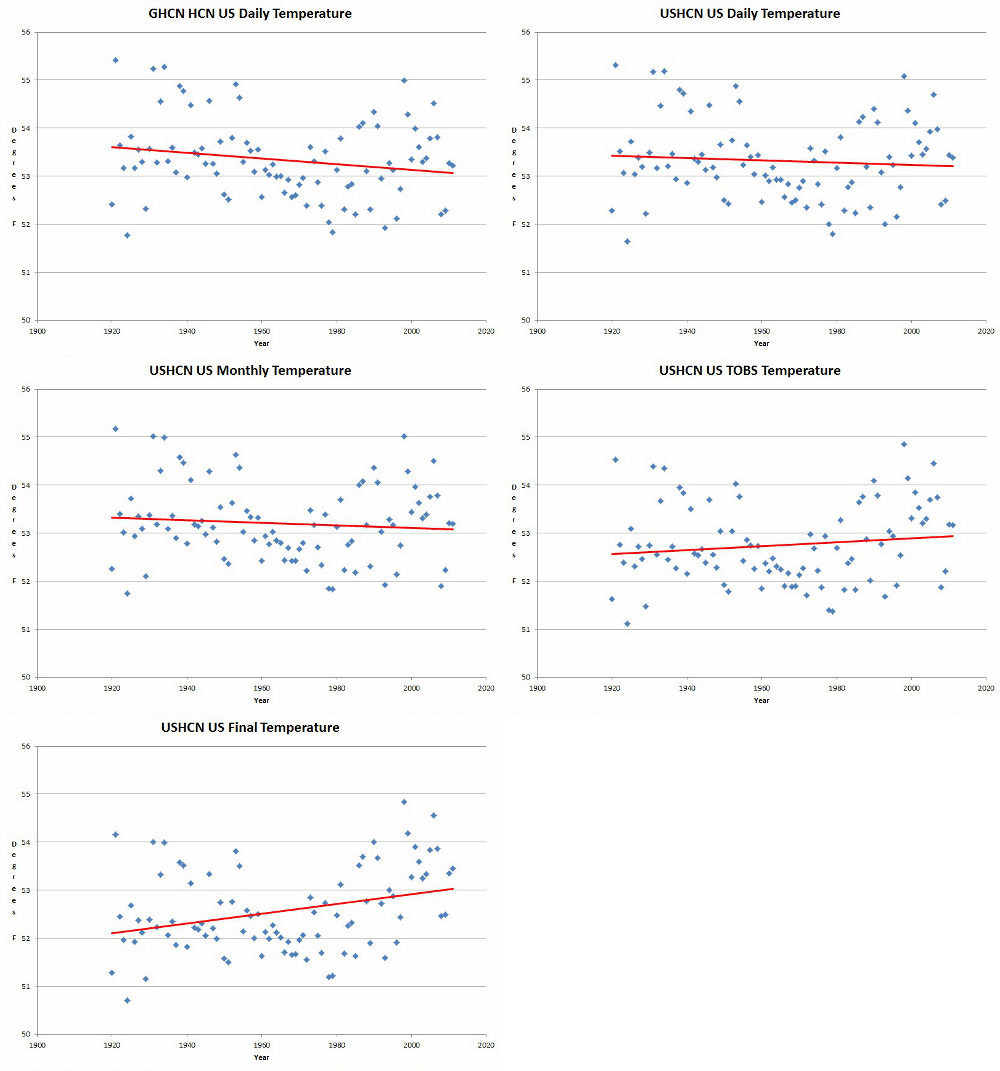
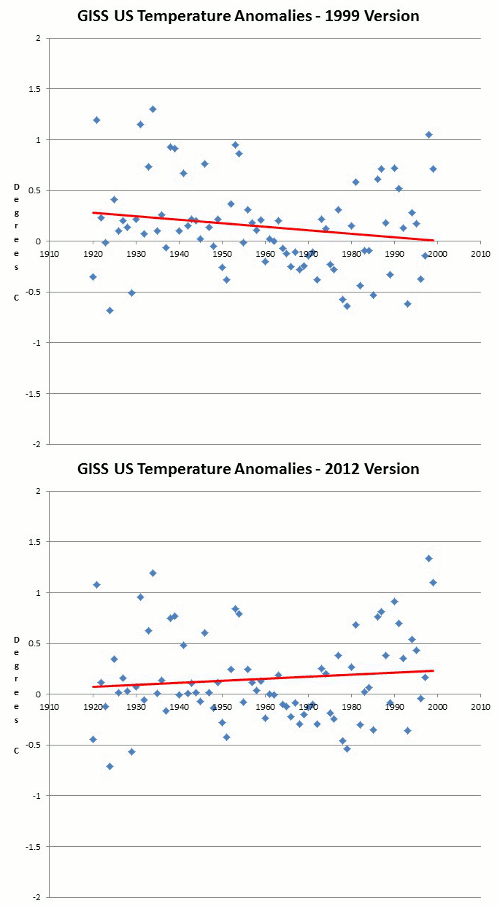
NOAA and NASA do spectacular amounts of tampering to the US temperature data set, which actually reverses the measured trend. This comes at a very high price.
- The history of the country is destroyed
- Bad policy is implemented as a result
- Children’s educations are wrecked by feeding them intellectual garbage
- The economy is damaged by taxes and destructive policies to restrict CO2
- Science itself is wrecked. People attempting to interpret the data are trying to draw conclusions based on garbage data. Thus their conclusions are also garbage.
Amazing how a small handful of unscrupulous people can wreak so much havoc.


There don’t seem to be any links or examples in this post…..
But overall I agree… So many times some Hoaxer will refer me to the NOAA site and say.. “Chart the data for yourself… See!!” They refuse to accept this data has already been “normalized”… It’s a “Trick”!!
When you control the media narrative, the educational resources, the catholic church and the swing state polling systems, this is what you receive and can expect for a long time to come!
Academic’s, twisted leftist politicians, go-along-to-get-along moderates and community agitators have fully enveloped the bully pulpits at every turn and it is either time to ignore the destructive tactics that are killing free thinking American’s and our society, or wait it out.
There does not seem to be any other alternatives when a nation is this far gone!
Our Nation is corrupt beyond belief at every level and whether people see that or not is completely irrelevant, at this point.
Your & my asses have been kicked, and that is way beyond dispute!
Another thought. Currently, of the main worldwide measurement systems, two are by satellite and three by earth surface. Considering the earth surface measurements, which are generally the average of the daily high and low temps., the fact that they were homogenized to show a warming in recent years may cause another problem for the warmist gang. As problems of measurement stations are being corrected to eliminate faulty measurements which are too high, the new readings may end up being relatively lower with respect to juiced homogenized data.
The new correct data then will then tend to show a cooling bias.
In the end, ‘team’ will have shot itself in the foot, and the creative explanations would be interesting.
An upside is that the entire charade rests upon the actions of a small group of people. Audit (then prosecute) there, and cut the head off the serpent.
It’s official. Humans caused it to be a record hot year in Australia.
This means that humans are also responsible for record cold in the Arctic, record ice extent in the Antarctic, record snow across the northern Hemisphere in early 2013.
We are just so powerful!!! Aliens better watch out or else we’ll burn them or freeze them dead! The story shows the carbon tax brigade are desperate but it is Gonski!!! One week to go before the stupidest tax on earth is consigned to the dustbin of history!
http://m.smh.com.au/environment/climate-change/humans-behind-record-australian-heat-research-shows-20130903-2t2c8.html
In Canada the scam is well and truly unmasked.
http://canadafreepress.com/index.php/article/57623
What is the explanation for the long-time dependent measurement errors in the thermometers? It seems the data suppliers must have a problem with these instruments which according to the adjustments made have been over reading in the past and under reading increasingly as time goes on.
What modifications to the design of these faulty thermometers has been made as a result of the discovery (by undeclared means) that thermometers (of whatever type used) progressively under read temperature as time progresses.
A discrepancy of up to 1.5 degrees Farenheit can only be explained as a calibration error. Why were these thermometers not calibrated before being put into service?
Incredible. According to surface stations.org (http://www.surfacestations.org/ ), the ONLY adjustments to temperature should be DOWN! The criteria are listed in the NOAA’s (yes, NOAA) Climate Reference Network Rating Guide – adopted from NCDC Climate Reference Network Handbook, 2002 and adjustments range from none (monitor in the middle of a field; no heat source within 100 m) to -5° (Temperature sensor located next to/above an artificial heating source..).
NOAA does not follow their own criteria. Surprised, anyone?
Lol, yes, the stations in-near heat island areas should just be removed from long term data trending. Thats probably most of them as they tended to install these stations in the centre of towns etc. Good for a current temperature in the town but useless for detecting trends in temperature changes across the planet as human occupation n activity around it is going to have an effect on the recordings.
Reblogged this on Power To The People and commented:
To add insult to injury in Academia, scientists who do not tow the AGW politically correct dogma are ostracized.
http://motls.blogspot.com/2013/09/the-50-to-1-project.html
Reblogged this on CACA.
Unless you are throwing out ALL the current data points in Urban areas and using only current rural areas and comparing them with rural areas 100 years ago, you are comparing apples to oranges. No way to ACCURATELY quantify the effect of urban heating. Nor can you make a blanket estimation of it’s effect from urban area to urban area because urban building requirements different from region to region based on said weather.