
Disrupting the Borg is expensive and time consuming!

Google Search
-
Recent Posts
- Analyzing The Western Water Crisis
- Gaslighting 1924
- “Why Do You Resist?”
- Climate Attribution Model
- Fact Checking NASA
- Fact Checking Grok
- Fact Checking The New York Times
- New Visitech Features
- Ice-Free Arctic By 2014
- Debt-Free US Treasury Forecast
- Analyzing Big City Crime (Part 2)
- Analyzing Big City Crime
- UK Migration Caused By Global Warming
- Climate Attribution In Greece
- “Brown: ’50 days to save world'”
- The Catastrophic Influence of Bovine Methane Emissions on Extraterrestrial Climate Patterns
- Posting On X
- Seventeen Years Of Fun
- The Importance Of Good Tools
- Temperature Shifts At Blue Hill, MA
- CO2²
- Time Of Observation Bias
- Climate Scamming For Profit
- Climate Scamming For Profit
- Back To The Future
Recent Comments
- Bob G on Analyzing The Western Water Crisis
- Bob G on Analyzing The Western Water Crisis
- Bob G on Analyzing The Western Water Crisis
- Hank Phillips on Analyzing The Western Water Crisis
- Hank Phillips on Analyzing The Western Water Crisis
- Hank Phillips on Analyzing The Western Water Crisis
- Hank Phillips on Analyzing The Western Water Crisis
- Bob G on Analyzing The Western Water Crisis
- conrad ziefle on Analyzing The Western Water Crisis
- Bob G on Analyzing The Western Water Crisis
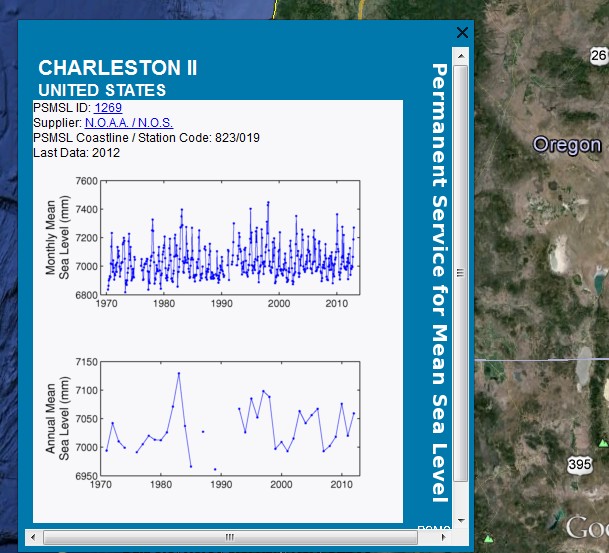
What do the numbers on the y-axis represent? 7000 mm above what?
To get a clearer picture of sea level trends maybe they should start measuring it in angstroms.
Maybe even Planck length…
I get it that the sea, as far we can see with our eyes anyway, hasn’t risen in decades in Oregon, Malibu, Manhattan, Australia, the Mediterranean, but everywhere else it’s been rising like gangbusters. That makes sense. Water is piling up. We know this because of all the cities and island nations that have been recently submerged by the merciless sea. /s
“Entire nations could be wiped off the face of the Earth by rising sea levels if the global warming trend is not reversed by the year 2000. ” -Noel Brown, ex UNEP Director, 1989
“[in twenty years (2008)] the West Side Highway (and thus much of Manhattan) will be under water.” -James Hansen, 1988, NASA
Obviously this is raw data and not yet adjusted. After adjustment you’ll see the sea level rise. That data needs adjustment!
Yes. Unadjusted data is obscene. Put some pants on it, make it behave, so we don’t have to worry where it’s been (“I sense terrible cooties in the data, Dr., and a bad attitude. Do you want me to adjust it?”–alarmist in a dominatrix costume, brandishing a whip… That is what’s REALLY making them insane: sexual control fantasies).