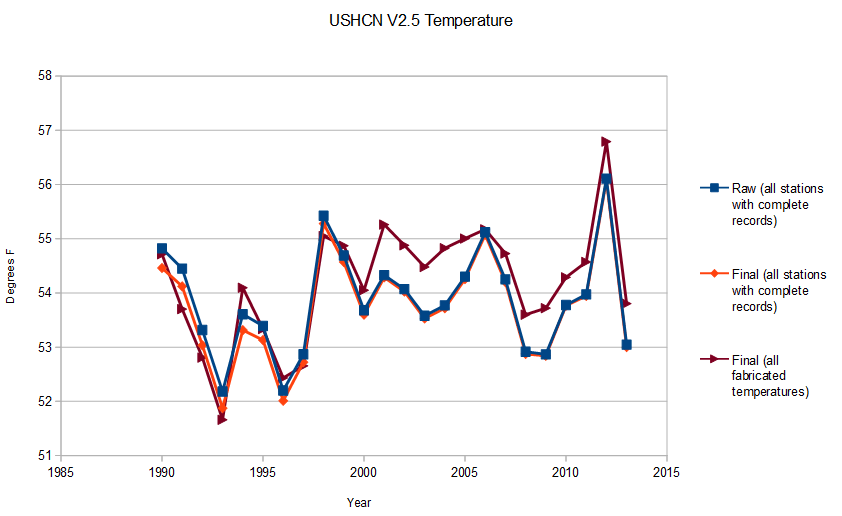
I generated a list of all stations with no fabricated data from 1990 to 2013, and generated raw and final average temperatures for those stations. I also calculated the average of all fabricated temperatures at all stations from 1990 to 2013, which comprise more than 40% of the recent USHCN data set.
As you can see below, the slope of the complete final (orange) is slightly larger than the complete raw (blue), due to TOBS adjustments, but the fabricated data is completely out of line after 1998, about 0.8 degrees warmer.
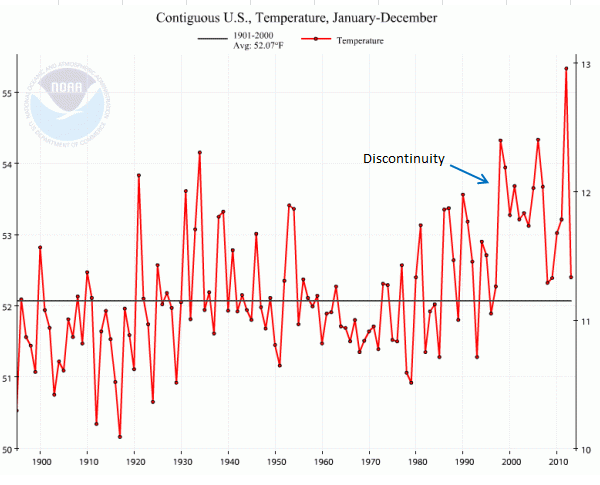
You may recall that I have previously observed a discontinuity after 1998. This is a big part of it.


I wonder if during “peer review” data is analyzed like you have?
I know the answer, they are just preaching to the choir!
Just to clarify, Steve.
Is the red line the plot for all stations where some fabrication exists (i.e. including both actual and estimated temps)?
Or is it just the estimated months themselves?
The red line is the average of all of the fabricated monthly temperatures per year.
Steve, I left this comment with Lucia, after reading his criticism of your methods. Please take up the challenge.
==========================
I have given more thought to this matter. Back at grad school I had occasion to run ag trials using statistical designs, latin squares and fractional factorials and the like. Being agriculture, we always had missing data that had to be made up in order for the designs to be analyzed. There are statistical procedures for doing so. The key constraints are that the made up data may not, not, not change the statistical parameters of the population or subpopulations; second, the more data is made up, the less confidence one has in the results. Made up data cannot add information to a design; only the observed data contributes information.
First off, accepting Goddard’s assertion that 30% of the NOAA data is “constructed” statistically, that is way beyond any number that is statistically defensible. That fact degrades our confidence in any conclusions made.
More importantly, Lucia’s post implies that the “constructed” data is taken from the actual observations of nearby stations, and thus is likely to match what the missing station would have produced. I surmise Lucia offers this as a defense of the process and a defense of using the whole dataset to reach conclusions. I am cynical of the motives of the people running the process, especially after Pelosi and Obama have announced their belief that the agencies have been purged of all “flat earthers”.
But the claim can be tested. Each “constructed” datapoint can be compared to the observations of the stations most adjacent, forming a subset. If the process has been legitimate, the values firstly should match closely. The constructed datapoint must not materially change the mean or the standard deviation of the subset. Secondly, the deviations of the constructed datapoint from the nearby observations, besides being small, should add up to zero for the entire dataset. Constructed deviations above or below its neighbors should be equal in a set of 21,000 observations per month, as Goddard calculates. Goddard claims they do not add up to zero, but introduce a huge and growing bias. Lucia claims (I deduce) that the deviations will add up to zero because the process is legitimate.
This is eminently testable. Have at it, boys.
The trend for whatever manipulation takes place is always UP…. 100% correlation here between data manipulation and increased temperatures…
What more do we need to know? We’ve just had a record year for cold…record global ice… Yet NOAA has the audacity to claim 2014 as the 2nd hottest April on record!! People read and believe this tripe thrown out by NOAA… It’s one of the major Weather/Official Government entities so people just don’t believe nor can accept their lies…