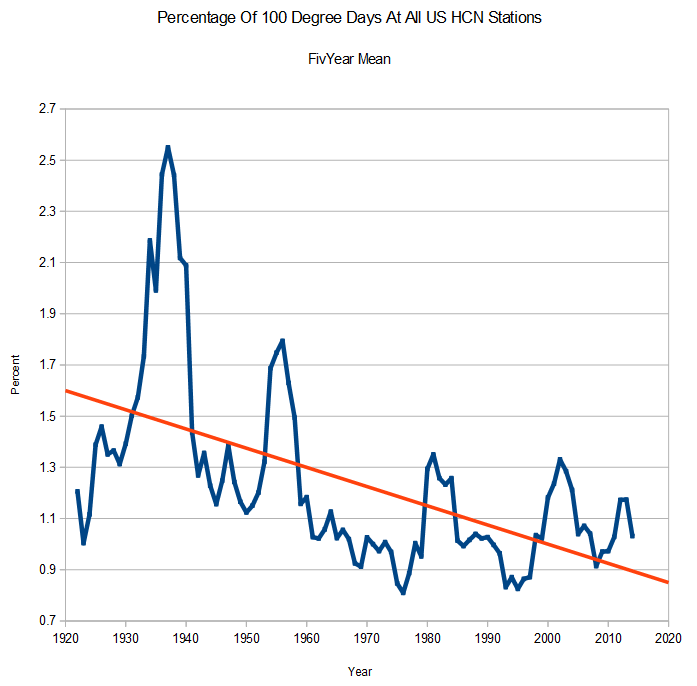
The Gavin/Zeke TOBS excuse for reversing the 1930s is utter nonsense. The 1930s were much hotter.
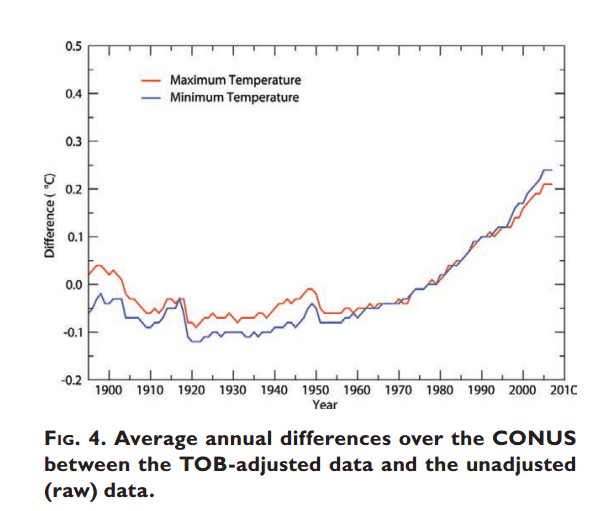
TOBS can’t account for 100 degree temperature readings, which were much more than twice as common in the 1930s. Menne 2009 shows that the TOBS adjustment for the 1930s was less than -0.1C anyway.
Perhaps all those Okies left the heat in Oklahoma during the 1930s, simply because they didn’t understand TOBS.


How are inflated numbers of single-day maxima past a given threshold not exactly the sort of effect you’d expect from TOBS bias, where PM observations of maximum thermometers frequently double-counted the higher of two-day highs?
Prove that these temperatures are wrong. We see the same pattern at all stations in the same region in the 1930s.
You think the operators were engaged in some sort of conspiracy to all double count 100 degree days to mess up the global warming scam 80 years later?
You can’t just alter data based on some academic theory, particularly without very plainly disclosing it in all graphs and publications.
Conspiracy isn’t necessary. If the real high on day 1 was 102°F, and the real high on day 2 was 98°F, and the observations were taken and thermometers reset at 5pm, then the Tmax for both days would likely come from day 1. This was a phenomenon that was well-documented in the 1930s:
http://docs.lib.noaa.gov/rescue/mwr/062/mwr-062-10-0375.pdf
You keep saying nobody knows what happened in Kansas on a given day in 1932. Yet you have no problem asserting that “TOBS can’t account for this.” Whether or not NOAA have proved to everyone’s satisfaction that it DID, it quite clearly COULD.
100 degree readings tend to be very short lived,,and unless the observer was so stupid and irresponsible as to take the reading right at the afternoon maximum and then not reset the min/max at night, it isn’t going to happen very often.
TOBS is not a subtle problem. When I was seven years old it took me about three days to recognize that you have to reset the thermometer at night.
Produce some evidence to show actual duplicates.
Are you reading at 5 PM or 6 PM local? Either way, you will be down about 4 – 5 deg F from that 102 deg high at 5 PM. So the next day should read rounds about 98 deg range, as that would be the temp when you reset the thermometer where the high that day was 102 deg F.
The problem seems to be the average maximum ‘step’ down in the fall from day to day will be about 5 deg F from day to day.
The pdf referenced was working with “average” reported temperature (resulting from min max readings), and gave worst case for 5 PM readings of +1.5 deg F in April.
.
If it so much hotter now then the 1930’s, where are all the dust storms.
My dead mother will be doing back flips in her grave to hear that the dirty thirties she lived through were nothing more than a TOBS mistake and it really wasn’t hot and dry 😉
That Steinbeck: such a lying liar. Was he one of the first deniers?
Ok. The ’30s weren’t that hot. Then what happened?
http://www.ldeo.columbia.edu/res/div/ocp/drought/dust_storms.shtml
We live in good times.
AWG, another term for good weather.
A minor remark on the 1930s.
It was a drought and when there is very little humidity the temperatures are often much much higher. Think desert vs rain forest.
For example:
Brazilian rain forest, Barcelos, Brazil (elevation ~ 30 meters (100 ft) 0.9750° S, “Direct Radiation Horizontal Surface” @ noon for 0S= 1150 watts/meter^2 )
….monthly min 20C, monthly max 33C, monthly average 26C
Average humidity 90%
N. African Desert, Adrar, Algeria (further north Elevation: 280 metres (920 feet) 27.8667° N, “Direct Radiation Horizontal Surface” @ noon for 30S= 970 watts/meter^2 )
…..monthly min 9C monthly max 44C, monthly average 30C
Average humidity around 0%
The data is from May 2012
If the dirty thirties were not a heck of a lot warmer I would be very much surprised.
As Steve says, you need to look at this information from a lot of angles.